Powerpoint Templates and Google slides for Operational Dashboards
Save Your Time and attract your audience with our fully editable PPT Templates and Slides.
-
 Information Technology System Dashboard For Monitoring Business Operations
This slide shows information technology system dashboard for monitoring business operations which can be beneficial for making decisions for their growth. It contains information about learning, internal, finance or customers and users. Presenting our well structured Information Technology System Dashboard For Monitoring Business Operations. The topics discussed in this slide are Learning, Finance And Customers, Users. This is an instantly available PowerPoint presentation that can be edited conveniently. Download it right away and captivate your audience.
-
 Dashboard Of Property Operations And Maintenance
This slide focuses on maintenance dashboard for certified reliability engineer which covers team efficiency, cumulative savings, planned maintenance, chiller performance analysis, portfolio comparison, alarm and fault diagnostics, etc. Presenting our well structured Dashboard Of Property Operations And Maintenance. The topics discussed in this slide are Portfolio Comparison, Cumulative Savings, Alarm And Fault Diagnostics. This is an instantly available PowerPoint presentation that can be edited conveniently. Download it right away and captivate your audience.
-
 Predictive Maintenance Dashboard With Total Engines In Operations
This slide presents the predictive maintenance dashboard such as normal, warning and critical engines with total engine status, optimal condition, monitor changes, requires immediate maintenance , etc. with predicted charts. Presenting our well structured Predictive Maintenance Dashboard With Total Engines In Operations. The topics discussed in this slide are Predictive Maintenance Dashboard With Total Engines In Operations. This is an instantly available PowerPoint presentation that can be edited conveniently. Download it right away and captivate your audience.
-
 Business Loan Operations Dashboard For Banks
This slide displays the dashboard for corporate loan operations management. It include KPIs such as open cases with service level agreements, average open cases by agents, open cases by age, proposed exposure by risk rating, etc. Introducing our Business Loan Operations Dashboard For Banks set of slides. The topics discussed in these slides are Business Loan Operations Dashboard For Banks. This is an immediately available PowerPoint presentation that can be conveniently customized. Download it and convince your audience.
-
 Devops KPI Metrics Dashboard With Operational Optimization
This slide covers about devops operational activities with performance metrics which includes input output operations and writing operations. Further it includes about central processing units operational efficiency. Presenting our well structured Devops KPI Metrics Dashboard With Operational Optimization. The topics discussed in this slide are Devops KPI Metrics Dashboard with Operational Optimization. This is an instantly available PowerPoint presentation that can be edited conveniently. Download it right away and captivate your audience.
-
 Manufacturing operation best practices dashboard
Deliver an outstanding presentation on the topic using this Manufacturing Operation Best Practices Dashboard. Dispense information and present a thorough explanation of Dashboard using the slides given. This template can be altered and personalized to fit your needs. It is also available for immediate download. So grab it now.
-
 Manufacturing operation best practices dashboard snapshot for measuring kpis
The following slide displays the key performance Indicators of manufacturing, these KPIs can be units produced, units lost, overall plant productivity and productivity by machine Present the topic in a bit more detail with this Manufacturing Operation Best Practices Dashboard For Measuring Kpis. Use it as a tool for discussion and navigation on Production Dashboard Snapshot For Measuring Kpis. This template is free to edit as deemed fit for your organization. Therefore download it now.
-
 Compensation management operations dashboard
Present the topic in a bit more detail with this Compensation Management Operations Dashboard. Use it as a tool for discussion and navigation on Compensation Per Sale, Compensation Per Plan, Compensation Per Plan, Top 10, Compensation Per Component Rank. This template is free to edit as deemed fit for your organization. Therefore download it now.
-
 Finance KPI Dashboard Illustrating Gross And Operating Profit Margin
Introducing our Finance KPI Dashboard Illustrating Gross And Operating Profit Margin set of slides. The topics discussed in these slides are Gross Profit Margin, Operating Profit Margin, Net Profit Margin. This is an immediately available PowerPoint presentation that can be conveniently customized. Download it and convince your audience.
-
 Dashboard to track inventory improving logistics management operations
This slide focuses on the dashboard to track inventory management status which covers annual stock conversion into sales, inventory turnover, inventory carrying cost and accuracy.Deliver an outstanding presentation on the topic using this Dashboard To Track Inventory Improving Logistics Management Operations. Dispense information and present a thorough explanation of Inventory Carrying Cost, Inventory Accuracy, Stock Conversion using the slides given. This template can be altered and personalized to fit your needs. It is also available for immediate download. So grab it now.
-
 Supply chain activity tracking dashboard improving logistics management operations
This slide shows the dashboard that depicts supply chain management which includes retailer and warehouse capacity, delivery status from supplier to warehouse, time to reach there, etc.Deliver an outstanding presentation on the topic using this Supply Chain Activity Tracking Dashboard Improving Logistics Management Operations. Dispense information and present a thorough explanation of Supply Chain Activity Tracking Dashboard using the slides given. This template can be altered and personalized to fit your needs. It is also available for immediate download. So grab it now.
-
 Corporate Dashboard Illustrating Revenue And Operational Expenses
This graph or chart is linked to excel, and changes automatically based on data. Just left click on it and select edit data. Introducing our Corporate Dashboard Illustrating Revenue And Operational Expenses set of slides. The topics discussed in these slides are Gross Profit Margin, PEX Ratio, EBIT Margin, Net Profit Margin. This is an immediately available PowerPoint presentation that can be conveniently customized. Download it and convince your audience.
-
 Corporate Operating Expenses Dashboard Snapshot With Gross Profit
This graph or chart is linked to excel, and changes automatically based on data. Just left click on it and select edit data. Introducing our Corporate Operating Expenses Dashboard With Gross Profit set of slides. The topics discussed in these slides are Breakdowns, Employee Satisfaction Nps, Customer Satisfaction Nps, Revenue, Gross Profit. This is an immediately available PowerPoint presentation that can be conveniently customized. Download it and convince your audience.
-
 Warehouse Operations Dashboard Snapshot And Shipment Management
This graph or chart is linked to excel, and changes automatically based on data. Just left click on it and select edit data. Introducing our Warehouse Operations Dashboard SnapshoAnd Shipment Management set of slides. The topics discussed in these slides are Warehouse Operating Costs, Perfect Order Rate, Total Shipments By Country, Warehouse Operating, Cost Distribution, On Time Shipments. This is an immediately available PowerPoint presentation that can be conveniently customized. Download it and convince your audience.
-
 Warehouse Operations Dashboard With Orders Management
This graph or chart is linked to excel, and changes automatically based on data. Just left click on it and select edit data. Presenting our well structured Warehouse Operations Dashboard With Orders Management. The topics discussed in this slide are Collecting Time in Minutes, 15 Most Ordered Products, Orders per Day, Number of Workers Per Shift, 15 Least Ordered Products. This is an instantly available PowerPoint presentation that can be edited conveniently. Download it right away and captivate your audience.
-
 Reducing Cost Of Operations Through Digital Twins Healthcare Dashboard Showing Analytical Data
This slide shows the healthcare dashboard that presents analytical data such as occupancy, patient turnover, efficiency and costs, satisfaction and service indicators. Present the topic in a bit more detail with this Reducing Cost Of Operations Through Digital Twins Healthcare Dashboard Showing Analytical Data. Use it as a tool for discussion and navigation on Healthcare, Dashboard, Analytical. This template is free to edit as deemed fit for your organization. Therefore download it now.
-
 Reducing Cost Of Operations Through Iot And Dashboard Depicting Supply Chain Metrics
This slide depicts the dashboard that shows supply chain metrics that covers net sales, supply chain costs, average cash-to-cash cycle, carrying costs of inventory, etc. Deliver an outstanding presentation on the topic using this Reducing Cost Of Operations Through Iot And Dashboard Depicting Supply Chain Metrics. Dispense information and present a thorough explanation of Dashboard Depicting Supply Chain Metrics using the slides given. This template can be altered and personalized to fit your needs. It is also available for immediate download. So grab it now.
-
 Company Snapshot Analysis Dashboard With Operating Ratio
Introducing our Company Snapshot Analysis Dashboard With Operating Ratio set of slides. The topics discussed in these slides are Company Marketing Ranking Snapshot With Site Audit. This is an immediately available PowerPoint presentation that can be conveniently customized. Download it and convince your audience.
-
 Financial Performance Tracking Dashboard Optimize Business Core Operations
This slide presents the dashboard which will help firm in tracking the financial performance. This dashboard displays number of customers, vendors and revenues generated, expenses and profit incurred. Present the topic in a bit more detail with this Financial Performance Tracking Dashboard Optimize Business Core Operations. Use it as a tool for discussion and navigation on Financial Performance Tracking Dashboard. This template is free to edit as deemed fit for your organization. Therefore download it now.
-
 Potential Prospect Management Dashboard Optimize Business Core Operations
The dashboard will provide overall scenario of all accounts and track new leads, top campaigns, expected revenue earned, etc. Present the topic in a bit more detail with this Potential Prospect Management Dashboard Optimize Business Core Operations. Use it as a tool for discussion and navigation on Potential Prospect Management Dashboard. This template is free to edit as deemed fit for your organization. Therefore download it now.
-
 Dashboards For Retail Store Customer Service Retail Store Operations Performance Assessment
This slide includes dashboards for retail store customer service providing details of NPS, CSAT score. It also covers details of shoppers response towards product quality and price. Present the topic in a bit more detail with this Dashboards For Retail Store Customer Service Retail Store Operations Performance Assessment. Use it as a tool for discussion and navigation on Dashboards For Retail Store Customer Service. This template is free to edit as deemed fit for your organization. Therefore download it now.
-
 F246 Retail Store Employee Engagement Dashboards Retail Store Operations Performance Assessment
This slide represents the dashboard to showcase retail stores employee engagement score teamwise, hierarchy levels wise. It also provides details of score on multiple engagement dimensions such as work life balance, salary, growth opportunities etc. Deliver an outstanding presentation on the topic using this F246 Retail Store Employee Engagement Dashboards Retail Store Operations Performance Assessment. Dispense information and present a thorough explanation of Engagement, Dashboards, Opportunities using the slides given. This template can be altered and personalized to fit your needs. It is also available for immediate download. So grab it now.
-
 F248 Dashboard For Retail Store Inventory Retail Store Operations Performance Assessment
This slide depicts the retail store inventory dashboard providing information regarding expired items, low stock items, returned goods. It also covers details of stock demand planning. Deliver an outstanding presentation on the topic using this F248 Dashboard For Retail Store Inventory Retail Store Operations Performance Assessment. Dispense information and present a thorough explanation of Dashboard For Retail Store Inventory using the slides given. This template can be altered and personalized to fit your needs. It is also available for immediate download. So grab it now.
-
 F249 Dashboards For Retail Store Customer Retention Retail Store Operations Performance Assessment
This slide illustrates the dashboard for retail store customer retention providing information regarding customer and revenue churn, loyal customer rate along with MRR growth Present the topic in a bit more detail with this F249 Dashboards For Retail Store Customer Retention Retail Store Operations Performance Assessment. Use it as a tool for discussion and navigation on Dashboards For Retail Store Customer Retention. This template is free to edit as deemed fit for your organization. Therefore download it now.
-
 F264 Social Media Dashboards For Retail Store Retail Store Operations Performance Assessment
This slide showcase dashboard for retail store social media channels performance in terms of reach, new fans, engagement, shares, likes, comments etc. Deliver an outstanding presentation on the topic using this F264 Social Media Dashboards For Retail Store Retail Store Operations Performance Assessment. Dispense information and present a thorough explanation of Social Media Dashboards FOR Retail Store using the slides given. This template can be altered and personalized to fit your needs. It is also available for immediate download. So grab it now.
-
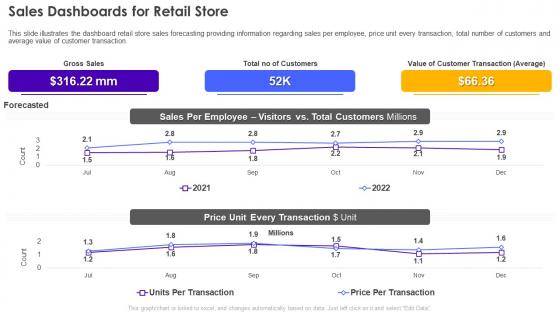 Sales Dashboards For Retail Store Retail Store Operations Performance Assessment
This slide illustrates the dashboard retail store sales forecasting providing information regarding sales per employee, price unit every transaction, total number of customers and average value of customer transaction. Present the topic in a bit more detail with this Sales Dashboards For Retail Store Retail Store Operations Performance Assessment. Use it as a tool for discussion and navigation on Dashboards, Customer, Transaction. This template is free to edit as deemed fit for your organization. Therefore download it now.
-
 Actual Vs Targeted Operating And Net Profit Margin Dashboard
This slide showcases dashboard that can help organization to compare the actual and targeted profit generated by company per month. Its key components are gross, operating and net profit margin. Introducing our Actual Vs Targeted Operating And Net Profit Margin Dashboard set of slides. The topics discussed in these slides are Gross Profit Margin, Operating Profit Margin, Net Profit Margin. This is an immediately available PowerPoint presentation that can be conveniently customized. Download it and convince your audience.
-
 Net And Gross Operating Margin Dashboard With Department Annual Profits
This slide showcases dashboard that can help organization to identify the operating margin and annual profits generated by different departments. Its key components are gross profit margin, operating profit margin, net profit margin and country wise profit margins. Presenting our well-structured Net And Gross Operating Margin Dashboard With Department Annual Profits. The topics discussed in this slide are Gross Profit Margin, Operating Profit Margin, Net Profit Margin. This is an instantly available PowerPoint presentation that can be edited conveniently. Download it right away and captivate your audience.
-
 Operating Profit Margin Dashboard With Income Statement And Expenses
This slide showcases dashboard that can help organization to estimate the profit generated by organization from its core operations and expenses incurred for different activities. Its key components are operating profit margin, net profit margin, income statement and EBIT. Introducing our Operating Profit Margin Dashboard With Income Statement And Expenses set of slides. The topics discussed in these slides are Gross Profit Margin, Operating Expenses Ratio, Operating Profit Margin. This is an immediately available PowerPoint presentation that can be conveniently customized. Download it and convince your audience.
-
 Departmental Operations Training Status Dashboard
This slide covers employees training status dashboard for HR manager. It includes KPIs such as training cost, cost per participant, training type, number of participants, training hours, occupancy rates, etc. Introducing our Departmental Operations Training Status Dashboard set of slides. The topics discussed in these slides are Departmental Operations, Training Status, Dashboard. This is an immediately available PowerPoint presentation that can be conveniently customized. Download it and convince your audience.
-
 Banking Operation Strategy Dashboard Highlighting Strategy To Transform Banking Operations Model
This slide highlights the banking operation strategy which includes accounts opened and closed, total deposit vs branch goal, accounts by type, expense to budget and referrals by product. Deliver an outstanding presentation on the topic using this Banking Operation Strategy Dashboard Highlighting Strategy To Transform Banking Operations Model. Dispense information and present a thorough explanation of Operation, Strategy, Dashboard using the slides given. This template can be altered and personalized to fit your needs. It is also available for immediate download. So grab it now.
-
 Strategy To Transform Banking Operations Model Banking Operation Strategy Dashboard Highlighting
This slide highlights the banking operation strategy dashboard which showcases current account and saving account growth rate, savings account deposits, current account deposits and retail term deposits. Present the topic in a bit more detail with this Strategy To Transform Banking Operations Model Banking Operation Strategy Dashboard Highlighting. Use it as a tool for discussion and navigation on Operation, Strategy, Dashboard. This template is free to edit as deemed fit for your organization. Therefore download it now.
-
 Design And Implement Hospital Hospital Performance Dashboard To Improve Operations
This slide focuses on the hospital performance dashboard to improve operations which covers total patients, operational expenses, patient satisfaction, average waiting time, staff per department, etc. Present the topic in a bit more detail with this Design And Implement Hospital Hospital Performance Dashboard To Improve Operations. Use it as a tool for discussion and navigation on Doctors Treatment Plan, Paitent Sarisfaction, Staff Per Department. This template is free to edit as deemed fit for your organization. Therefore download it now.
-
 Artificial intelligence for IT operations dashboard snapshot ppt introduction
This slide shows the dashboard for AIOps that covers the details of Cloud DevOps team performance, including the total number of currently assigned situations, acknowledged, resolved, and the number of recent comments. Present the topic in a bit more detail with this artificial intelligence for IT operations dashboard snapshot ppt introduction. Use it as a tool for discussion and navigation on Assigned Situations, Acknowledged Situations, Resolved Situations. This template is free to edit as deemed fit for your organization. Therefore download it now.
-
 Supply Chain Activity Tracking Dashboard Building Excellence In Logistics Operations
This slide shows the dashboard that depicts supply chain management which includes retailer and warehouse capacity, delivery status from supplier to warehouse, time to reach there, etc. Deliver an outstanding presentation on the topic using this Supply Chain Activity Tracking Dashboard Building Excellence In Logistics Operations. Dispense information and present a thorough explanation of Warehouse Capacity, Sustainability, Profitability using the slides given. This template can be altered and personalized to fit your needs. It is also available for immediate download. So grab it now.
-
 Innovation Dashboard With Relevant Operational Information
Introducing our Innovation Dashboard With Relevant Operational Information set of slides. The topics discussed in these slides are Innovation Dashboard, Relevant Operational Information. This is an immediately available PowerPoint presentation that can be conveniently customized. Download it and convince your audience.
-
 Packing And Shipping Dashboard With Operating Costs
The following slide showcases of dashboard that provides centralized overview of shipping and packing. It further includes revenue, costs, profit, shipments, average delivery time, fleet and delivery status. Presenting our well structured Packing And Shipping Dashboard With Operating Costs. The topics discussed in this slide are Warehouse Operating Cost, Perfect Order Rate, Total Shipments Country. This is an instantly available PowerPoint presentation that can be edited conveniently. Download it right away and captivate your audience.
-
 Quarterly Analysis Dashboard Of Marketing Operations Management
The following slide presents the KPIs of marketing operations to assess the performance. It includes quarterly values of elements such as budgeted vs actual total expenditure, impressions, cost per acquisition, clicks etc. Presenting our well structured Quarterly Analysis Dashboard Of Marketing Operations Management. The topics discussed in this slide are Campaign Wise, Cost Per Acquisition, Acquisition Rate. This is an instantly available PowerPoint presentation that can be edited conveniently. Download it right away and captivate your audience.
-
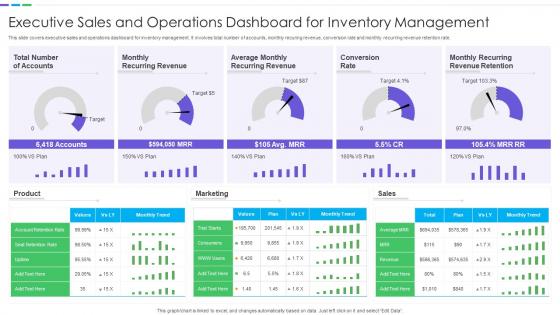 Executive Sales And Operations Dashboard Snapshot For Inventory Management
This slide covers executive sales and operations dashboard snapshot for inventory management. It involves total number of accounts, monthly recuring revenue, conversion rate and monthly recurring revenue retention rate. Introducing our Executive Sales And Operations Dashboard For Inventory Management set of slides. The topics discussed in these slides are Monthly Recurring Revenue, Conversion Rate, Recurring Revenue Retention. This is an immediately available PowerPoint presentation that can be conveniently customized. Download it and convince your audience.
-
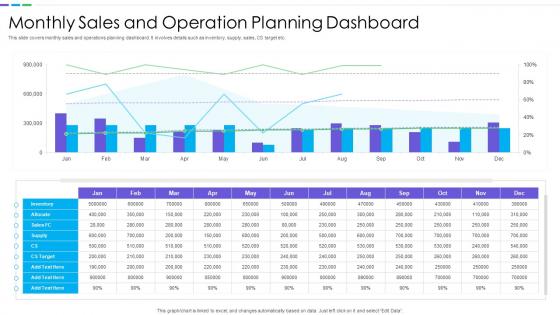 Monthly Sales And Operation Planning Dashboard
This slide covers monthly sales and operations planning dashboard. It involves details such as inventory, supply, sales, CS target etc. Presenting our well structured Monthly Sales And Operation Planning Dashboard. The topics discussed in this slide are Monthly Sales, Operation Planning, Dashboard. This is an instantly available PowerPoint presentation that can be edited conveniently. Download it right away and captivate your audience.
-
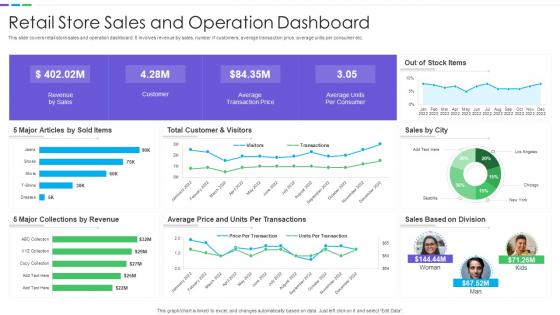 Retail Store Sales And Operation Dashboard
This slide covers retail store sales and operation dashboard. It involves revenue by sales, number if customers, average transaction price, average units per consumer etc. Introducing our Retail Store Sales And Operation Dashboard set of slides. The topics discussed in these slides are Retail Store Sales, Operation Dashboard. This is an immediately available PowerPoint presentation that can be conveniently customized. Download it and convince your audience.
-
 Sales And Operation Dashboard For Performance Management
This slide covers sales and operation dashboard for performance management. It involves details such as number of new buyers, sales revenue, average revenue per unit etc. Presenting our well structured Sales And Operation Dashboard For Performance Management. The topics discussed in this slide are Customer Lifetime Value, Customer Acquisition Cost, Average Revenue Per Unit. This is an instantly available PowerPoint presentation that can be edited conveniently. Download it right away and captivate your audience.
-
 Sales And Operation Dashboard To Analyze Performance
This slide covers sales and operation dashboard to analyze performance. It involves sales, revenue, profit, sale size and monthly productivity. Introducing our Sales And Operation Dashboard To Analyze Performance set of slides. The topics discussed in these slides are Sales, Revenue, Profit. This is an immediately available PowerPoint presentation that can be conveniently customized. Download it and convince your audience.
-
 Sales And Operations Dashboard Snapshot For Distribution Company
This slide covers sales and operations dashboard for distribution company. It involves details such as total sales by location, gross margin, monthly sales trends, average revenue and sales by major customers. Presenting our well structured Sales And Operations Dashboard Snapshot For Distribution Company. The topics discussed in this slide are Monthly Sales Trend, Actual Vs Budget, Gross Margin. This is an instantly available PowerPoint presentation that can be edited conveniently. Download it right away and captivate your audience.
-
 Sales And Operations Dashboard For Ecommerce Business
This slide covers sales and operations dashboard for ecommerce business. It involves details such as total sales generated, number of brands, total revenue generated, number of units sold and gender and age range breakdown. Introducing our Sales And Operations Dashboard For Ecommerce Business set of slides. The topics discussed in these slides are Sales And Operations, Dashboard, Ecommerce Business. This is an immediately available PowerPoint presentation that can be conveniently customized. Download it and convince your audience.
-
 Sales And Operations Dashboard To Drive Effective Productivity
This slide covers sales and operations dashboard to drive effective productivity. It involves details such as number of account assigned, working accounts, engaged accounts and total account activity. Presenting our well structured Sales And Operations Dashboard To Drive Effective Productivity. The topics discussed in this slide are Working Accounts, Account Activity, Meeting Booking. This is an instantly available PowerPoint presentation that can be edited conveniently. Download it right away and captivate your audience.
-
 Sales And Operations KPI Dashboard To Increase Efficiency
This slide covers sales and operations KPI dashboard to increase efficiency. It involves performance, increase in profit, target, monthly profit and quarterly revenue trend. Introducing our Sales And Operations KPI Dashboard To Increase Efficiency set of slides. The topics discussed in these slides are Increase In Profit, Quartely Revenue Trend, Account In Arrear. This is an immediately available PowerPoint presentation that can be conveniently customized. Download it and convince your audience.
-
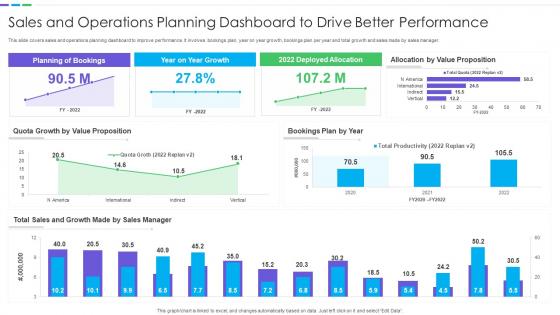 Sales And Operations Planning Dashboard To Drive Better Performance
This slide covers sales and operations planning dashboard to improve performance. It involves bookings plan, year on year growth, bookings plan per year and total growth and sales made by sales manager. Presenting our well structured Sales And Operations Planning Dashboard To Drive Better Performance. The topics discussed in this slide are Value Proposition, Sales And Growth, Sales Manager. This is an instantly available PowerPoint presentation that can be edited conveniently. Download it right away and captivate your audience.
-
 Operational Leverage Dashboard With Income Statement
This slide illustrates graphical representation of company revenue and income statement. It includes monthly revenue, revenue by products, revenue by country etc. Introducing our Operational Leverage Dashboard With Income Statement set of slides. The topics discussed in these slides are Monthly Revenue, Operational Leverage, Operating Income. This is an immediately available PowerPoint presentation that can be conveniently customized. Download it and convince your audience.
-
 Dashboard Snapshot Survey Results Report For Mobile Operating System
This graph or chart is linked to excel, and changes automatically based on data. Just left click on it and select Edit Data. Introducing our Dashboard Snapshot Survey Results Report For Mobile Operating System set of slides. The topics discussed in these slides are Survey Results, Survey Details, Completed Survey, Reviewed Survey. This is an immediately available PowerPoint presentation that can be conveniently customized. Download it and convince your audience.
-
 Dashboard Snapshot Of Shipment Transportation With Operating Cost
The following slide highlights dashboard snapshot of shipment transportation with operating cost illustrating transportation operating cost, monthly order completion rate, operating cost distribution, order completion trend, transportation by destination and transportation efficiency. Introducing our Dashboard Of Shipment Transportation With Operating Cost set of slides. The topics discussed in these slides are Dashboard, Shipment, Transportation. This is an immediately available PowerPoint presentation that can be conveniently customized. Download it and convince your audience.
-
 Dashboard Highlighting CRM Ticketing Tool Operations Service Desk Management To Enhance
This slide illustrates dashboard showcasing customer relationship management ticketing tool operations. It provides information about satisfaction, new tickets, chats, calls, invoicing, tech support, sales, engineers, replies, etc. Present the topic in a bit more detail with this Dashboard Highlighting CRM Ticketing Tool Operations Service Desk Management To Enhance. Use it as a tool for discussion and navigation on Dashboard Highlighting, Ticketing Tool Operations. This template is free to edit as deemed fit for your organization. Therefore download it now.
-
 Operational Risk Management Key Metrics Dashboard Enterprise Risk Mitigation Strategies
This slide represents dashboard representing the key metrics of operational risk management. It includes KPIs such as operational risk by rating, by month, operational risk list etc. Present the topic in a bit more detail with this Operational Risk Management Key Metrics Dashboard Enterprise Risk Mitigation Strategies. Use it as a tool for discussion and navigation on Operational, Risk Management, Dashboard. This template is free to edit as deemed fit for your organization. Therefore download it now.
-
 F666 Operational Risk Management Key Metrics Dashboard Erm Program Ppt Slides Background
This slide represents dashboard representing the key metrics of operational risk management. It includes KPIs such as operational risk by rating, by month, operational risk list etc. Present the topic in a bit more detail with this F666 Operational Risk Management Key Metrics Dashboard Erm Program Ppt Slides Background. Use it as a tool for discussion and navigation on Operational, Management, Dashboard. This template is free to edit as deemed fit for your organization. Therefore download it now.
-
 Q427 Shipping And Logistics Management Dashboard With Perfect Order Rate And Warehouse Operating
This slide covers KPIs to track the automation system of the company including warehouse operating costs, perfect order cost, on time shipment etc. Deliver an outstanding presentation on the topic using this Q427 Shipping And Logistics Management Dashboard With Perfect Order Rate And Warehouse Operating. Dispense information and present a thorough explanation of Warehouse Operating Costs, Perfect Order Rate, On Time Shipments using the slides given. This template can be altered and personalized to fit your needs. It is also available for immediate download. So grab it now.
-
 Dashboard For Retail Store Inventory Analysis Of Retail Store Operations Efficiency
This slide depicts the retail store inventory dashboard providing information regarding expired items, low stock items, returned goods. It also covers details of stock demand planning. Deliver an outstanding presentation on the topic using this Dashboard For Retail Store Inventory Analysis Of Retail Store Operations Efficiency. Dispense information and present a thorough explanation of Inventory Snapshot, Stock Demand Planning, Retail Store Inventory using the slides given. This template can be altered and personalized to fit your needs. It is also available for immediate download. So grab it now.
-
 Shipping And Logistics Management Dashboard With Perfect Order Rate And Warehouse Operating Costs
This slide covers KPIs to track the automation system of the company including warehouse operating costs, perfect order cost, on time shipment etc. Deliver an outstanding presentation on the topic using this Shipping And Logistics Management Dashboard With Perfect Order Rate And Warehouse Operating Costs. Dispense information and present a thorough explanation of Shipping And Logistics Management, Dashboard With Perfect Order, Rate And Warehouse Operating Costs using the slides given. This template can be altered and personalized to fit your needs. It is also available for immediate download. So grab it now.
-
 F531 Operational Risk Management Key Metrics Dashboard Snapshot Enterprise Management Mitigation Plan
This slide represents dashboard representing the key metrics of operational risk management. It includes KPIs such as operational risk by rating, by month, operational risk list etc. Present the topic in a bit more detail with this F531 Operational Risk Management Key Metrics Dashboard Snapshot Enterprise Management Mitigation Plan. Use it as a tool for discussion and navigation on Operational, Management, Dashboard. This template is free to edit as deemed fit for your organization. Therefore download it now.
-
 Security Automation Dashboard Highlighting Network Enabling Automation In Cyber Security Operations
This slide highlights the dashboard for security automation which includes total automations performed, hours saved, cost savings, records created, automation ratio, incidents by group and incident timeline. Present the topic in a bit more detail with this Security Automation Dashboard Highlighting Network Enabling Automation In Cyber Security Operations. Use it as a tool for discussion and navigation on Automation, Dashboard, Highlighting. This template is free to edit as deemed fit for your organization. Therefore download it now.
-
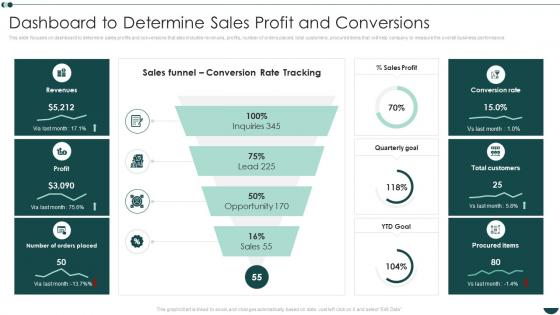 Business Process Reengineering Operational Efficiency Dashboard To Determine Sales Profit And Conversions
This slide focuses on dashboard to determine sales profits and conversions that also includes revenues, profits, number of orders placed, total customers, procured items that will help company to measure the overall business performance. Present the topic in a bit more detail with this Business Process Reengineering Operational Efficiency Dashboard To Determine Sales Profit And Conversions. Use it as a tool for discussion and navigation on Conversions, Dashboard, Revenues. This template is free to edit as deemed fit for your organization. Therefore download it now


