Powerpoint Templates and Google slides for Improve Average
Save Your Time and attract your audience with our fully editable PPT Templates and Slides.
-
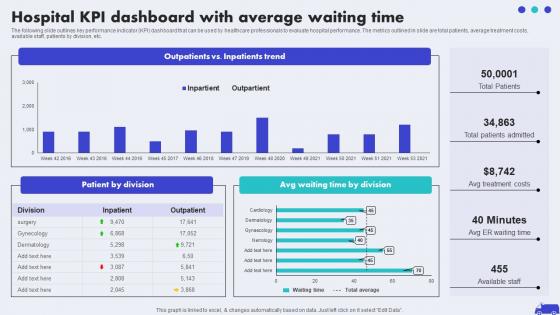 Hospital KPI Dashboard With Average Waiting Hospital Marketing Plan To Improve Patient Strategy SS V
The following slide outlines key performance indicator KPI dashboard that can be used by healthcare professionals to evaluate hospital performance. The metrics outlined in slide are total patients, average treatment costs, available staff, patients by division, etc. Deliver an outstanding presentation on the topic using this Hospital KPI Dashboard With Average Waiting Hospital Marketing Plan To Improve Patient Strategy SS V. Dispense information and present a thorough explanation of Patient By Division, Time By Division using the slides given. This template can be altered and personalized to fit your needs. It is also available for immediate download. So grab it now.
-
 Facebook Advertising Strategy Ways To Improve Average Engagement Rate Strategy SS V
The following slide outlines multiple methods through which advertisers can boost engagement rate on Facebook and improve brand awareness. Information covered in this slide is related to using video captions, video duration, live session, behind the scenes, responding to customer queries, etc. Introducing Facebook Advertising Strategy Ways To Improve Average Engagement Rate Strategy SS V to increase your presentation threshold. Encompassed with eight stages, this template is a great option to educate and entice your audience. Dispence information on Engagement Rate, Improve Average, Engagement Rate using this template. Grab it now to reap its full benefits.
-
 Ways To Improve Average Engagement Rate Driving Web Traffic With Effective Facebook Strategy SS V
The following slide outlines multiple methods through which advertisers can boost engagement rate on Facebook and improve brand awareness. Information covered in this slide is related to using video captions, video duration, live session, behind the scenes, responding to customer queries, etc. Increase audience engagement and knowledge by dispensing information using Ways To Improve Average Engagement Rate Driving Web Traffic With Effective Facebook Strategy SS V. This template helps you present information on eight stages. You can also present information on double engagement rate, Post behind, Post videos using this PPT design. This layout is completely editable so personaize it now to meet your audiences expectations.
-
 Ways To Improve Average Engagement Rate Step By Step Guide To Develop Strategy SS V
The following slide outlines multiple methods through which advertisers can boost engagement rate on Facebook and improve brand awareness. Information covered in this slide is related to using video captions, video duration, live session, behind the scenes, responding to customer queries, etc. Introducing Ways To Improve Average Engagement Rate Step By Step Guide To Develop Strategy SS V to increase your presentation threshold. Encompassed with eight stages, this template is a great option to educate and entice your audience. Dispence information on Multiple Calls To Action, Customer Queries Within, Post Videos, using this template. Grab it now to reap its full benefits.
-
 Facebook Ads Strategy To Improve Ways To Improve Average Engagement Rate Strategy SS V
The following slide outlines multiple methods through which advertisers can boost engagement rate on Facebook and improve brand awareness. Information covered in this slide is related to using video captions, video duration, live session, behind the scenes, responding to customer queries, etc. Introducing Facebook Ads Strategy To Improve Ways To Improve Average Engagement Rate Strategy SS V to increase your presentation threshold. Encompassed with eight stages, this template is a great option to educate and entice your audience. Dispence information on Engagement Rate, Respond To Customer Queries, Conduct Live Session, Video Duration, using this template. Grab it now to reap its full benefits.
-
 Ways To Improve Average Engagement Rate Facebook Advertising Strategy SS V
The following slide outlines multiple methods through which advertisers can boost engagement rate on Facebook and improve brand awareness. Information covered in this slide is related to using video captions, video duration, live session, behind the scenes, responding to customer queries, etc. Introducing Ways To Improve Average Engagement Rate Facebook Advertising Strategy SS V to increase your presentation threshold. Encompassed with eight stages, this template is a great option to educate and entice your audience. Dispence information on Engagement Rate, Customer Queries, Improve Average using this template. Grab it now to reap its full benefits.
-
 Average product delivery effective qa transformation strategies improve product quality
This slide shows details about the increasing Final Product Delivery Time in the past 5 years. The average delivery time is constantly increasing due to absence of advanced software testing techniques leading to increased bug rate in the product. Hence, leading to increased time in delivering the final product. Present the topic in a bit more detail with this Average Product Delivery Effective Qa Transformation Strategies Improve Product Quality Delivery. Use it as a tool for discussion and navigation on Average Product Delivery Time In Absence Of Effective Qa Transformation Techniques. This template is free to edit as deemed fit for your organization. Therefore download it now.
-
 Estimated average product qa transformation improved product quality user satisfaction
This slide shows details about the Estimated Average Product Delivery Time in the coming 5 years. Average Product Delivery Time will decline due to application of advanced software testing techniques that speeds up the entire process, remove bugs quickly and delivers the final product in short span of time. Deliver an outstanding presentation on the topic using this Estimated Average Product QA Transformation Improved Product Quality User Satisfaction. Dispense information and present a thorough explanation of Techniques, Software, Average using the slides given. This template can be altered and personalized to fit your needs. It is also available for immediate download. So grab it now.
-
 Qa transformation improved product quality user satisfaction average product delivery
This slide shows details about the increasing Final Product Delivery Time in the past 5 years. The average delivery time is constantly increasing due to absence of advanced software testing techniques leading to increased bug rate in the product. Hence, leading to increased time in delivering the final product. Present the topic in a bit more detail with this QA Transformation Improved Product Quality User Satisfaction Average Product Delivery. Use it as a tool for discussion and navigation on Increase, Average, Product. This template is free to edit as deemed fit for your organization. Therefore download it now.
-
 Recruitment training to improve selection process average cost of filling the position
This slide provides the graph of average hiring cost that shows decline in hiring costs after implementing the recruitment training program Deliver an outstanding presentation on the topic using this Recruitment Training To Improve Selection Process Average Cost Of Filling The Position. Dispense information and present a thorough explanation of Average Cost Of Filling The Position using the slides given. This template can be altered and personalized to fit your needs. It is also available for immediate download. So grab it now.
-
 Recruitment training to improve selection process average hiring time to fill the position
This slide provides the graph of average hiring time that shows decline in hiring timings after implementing the recruitment training program Present the topic in a bit more detail with this Recruitment Training To Improve Selection Process Average Hiring Time To Fill The Position. Use it as a tool for discussion and navigation on Average Hiring Time To Fill The Position. This template is free to edit as deemed fit for your organization. Therefore download it now.
-
 Improving Average Order Value Rate Improving Financial Management Process
The following slide showcases improvement of average order value rate. It provides information about product recommendations, customer loyalty program, product bundling, discount minimums, etc. Deliver an outstanding presentation on the topic using this Improving Average Order Value Rate Improving Financial Management Process. Dispense information and present a thorough explanation of Improving Average, Order Value Rate using the slides given. This template can be altered and personalized to fit your needs. It is also available for immediate download. So grab it now.
-
 Leveraging Sales Pipeline To Improve Customer Determine Average Sales Cycle In Pipeline
This slide provides information regarding average sales cycle existing in sales pipeline. The department will consistently monitor sales cycle to ensure on time closure of deal. Present the topic in a bit more detail with this Leveraging Sales Pipeline To Improve Customer Determine Average Sales Cycle In Pipeline. Use it as a tool for discussion and navigation on Current Sales Cycle, Conversion Capability, Improving Opportunity. This template is free to edit as deemed fit for your organization. Therefore download it now.
-
 Action Plan Quality Improvement In Bpo Call Center Action Plan Dashboard Highlighting Average Answer
answer time. Deliver an outstanding presentation on the topic using this Action Plan Quality Improvement In Bpo Call Center Action Plan Dashboard Highlighting Average Answer. Dispense information and present a thorough explanation of Dashboard, Resolutions, Highlighting Average using the slides given. This template can be altered and personalized to fit your needs. It is also available for immediate download. So grab it now.
-
 Call Center Action Plan Dashboard Highlighting Average Answer Call Center Performance Improvement Action
This slide showcases call center action plan dashboard which highlights first call resolution, unresolved calls, customers call report, response time by weekday and average answer time. Deliver an outstanding presentation on the topic using this Call Center Action Plan Dashboard Highlighting Average Answer Call Center Performance Improvement Action. Dispense information and present a thorough explanation of Dashboard, Highlighting, Resolutions using the slides given. This template can be altered and personalized to fit your needs. It is also available for immediate download. So grab it now.
-
 Improving Average Order Value Rate Practices For Enhancing Financial Administration Ecommerce
The following slide showcases improvement of average order value rate. It provides information about product recommendations, customer loyalty program, product bundling, discount minimums, etc. Deliver an outstanding presentation on the topic using this Improving Average Order Value Rate Practices For Enhancing Financial Administration Ecommerce. Dispense information and present a thorough explanation of Overview, Strategies, Complementary using the slides given. This template can be altered and personalized to fit your needs. It is also available for immediate download. So grab it now.
-
 Improving Average Order Value Rate How Ecommerce Financial Process Can Be Improved
The following slide showcases improvement of average order value rate. It provides information about product recommendations, customer loyalty program, product bundling, discount minimums, etc. Present the topic in a bit more detail with this Improving Average Order Value Rate How Ecommerce Financial Process Can Be Improved. Use it as a tool for discussion and navigation on Overview, Strategies, Products. This template is free to edit as deemed fit for your organization. Therefore download it now.
-
 Call Center Improvement Strategies Call Center Action Plan Dashboard Highlighting Average
This slide showcases dashboard for call center action plan which includes total calls, average answer speed, abandon rate, average calls per minute with agent performance and overall customer satisfaction score. Present the topic in a bit more detail with this Call Center Improvement Strategies Call Center Action Plan Dashboard Highlighting Average. Use it as a tool for discussion and navigation on Customers Call Report, Response Time, Resolutions. This template is free to edit as deemed fit for your organization. Therefore download it now.
-
 Performance Improvement Plan For Efficient Customer Service Impact 1 Decline In Average Response Time
This slide showcases the impact of good support service on the company. The metrics covered are average response time and first call resolution. Deliver an outstanding presentation on the topic using this Performance Improvement Plan For Efficient Customer Service Impact 1 Decline In Average Response Time. Dispense information and present a thorough explanation of Service, Software, Expectations using the slides given. This template can be altered and personalized to fit your needs. It is also available for immediate download. So grab it now.
-
 Performance Improvement Plan For Efficient Customer Service Issue 1 Increasing Average Response Time
This slide provides an overview of major KPIs of customer service team. The metrics covered are average response time and first call resolution. Present the topic in a bit more detail with this Performance Improvement Plan For Efficient Customer Service Issue 1 Increasing Average Response Time. Use it as a tool for discussion and navigation on Communication, Response, Dissatisfied Customers. This template is free to edit as deemed fit for your organization. Therefore download it now.
-
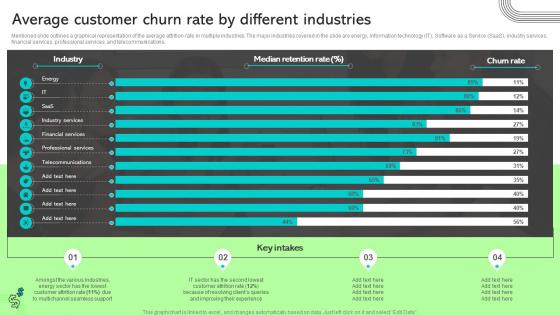 Average Customer Churn Rate By Different Industries Ways To Improve Customer Acquisition Cost
Mentioned slide outlines a graphical representation of the average attrition rate in multiple industries. The major industries covered in the slide are energy, information technology IT, Software as a Service SaaS, industry services, financial services, professional services, and telecommunications. Present the topic in a bit more detail with this Average Customer Churn Rate By Different Industries Ways To Improve Customer Acquisition Cost. Use it as a tool for discussion and navigation on Telecommunications, Professional, Financial. This template is free to edit as deemed fit for your organization. Therefore download it now.
-
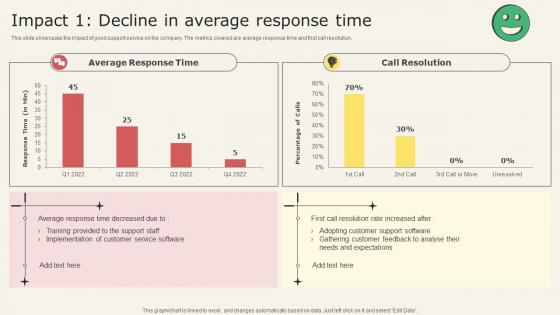 Analyzing Metrics To Improve Customer Experience Impact 1 Decline In Average Response Time
This slide showcases the impact of good support service on the company. The metrics covered are average response time and first call resolution. Present the topic in a bit more detail with this Analyzing Metrics To Improve Customer Experience Impact 1 Decline In Average Response Time. Use it as a tool for discussion and navigation on Customer Needs And Expectations, Adopting Customer, Support Software, Customer Feedback. This template is free to edit as deemed fit for your organization. Therefore download it now.
-
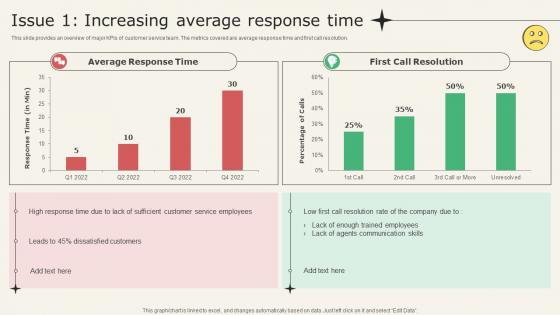 Analyzing Metrics To Improve Customer Experience Issue 1 Increasing Average Response Time
This slide provides an overview of major KPIs of customer service team. The metrics covered are average response time and first call resolution. Present the topic in a bit more detail with this Analyzing Metrics To Improve Customer Experience Issue 1 Increasing Average Response Time. Use it as a tool for discussion and navigation on Average Response Time, First Call Resolution, Communication Skills. This template is free to edit as deemed fit for your organization. Therefore download it now.
-
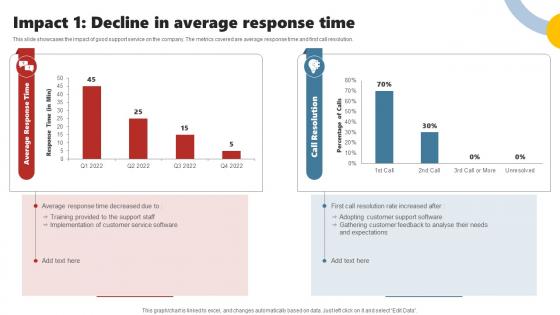 Impact 1 Decline In Average Response Time Enhancing Customer Experience Using Improvement
This slide showcases the impact of good support service on the company. The metrics covered are average response time and first call resolution. Deliver an outstanding presentation on the topic using this Impact 1 Decline In Average Response Time Enhancing Customer Experience Using Improvement. Dispense information and present a thorough explanation of Customer Service Software, Support Staff, Expectations, Customer Feedback using the slides given. This template can be altered and personalized to fit your needs. It is also available for immediate download. So grab it now.
-
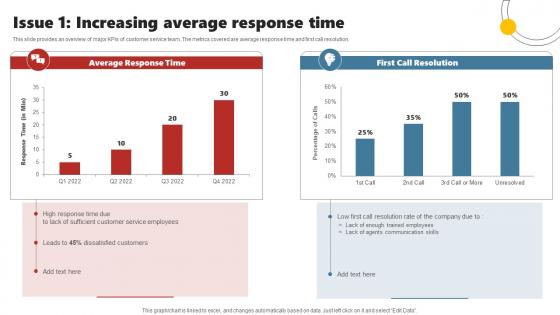 Issue 1 Increasing Average Response Time Enhancing Customer Experience Using Improvement
This slide provides an overview of major KPIs of customer service team. The metrics covered are average response time and first call resolution. Present the topic in a bit more detail with this Issue 1 Increasing Average Response Time Enhancing Customer Experience Using Improvement. Use it as a tool for discussion and navigation on Customer Service Employees, Dissatisfied Customers, Communication Skills. This template is free to edit as deemed fit for your organization. Therefore download it now.
-
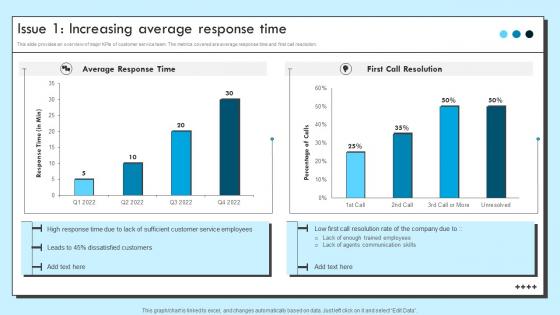 Issue 1 Increasing Average Response Time Improvement Strategies For Support
This slide provides an overview of major KPIs of customer service team. The metrics covered are average response time and first call resolution. Deliver an outstanding presentation on the topic using this Issue 1 Increasing Average Response Time Improvement Strategies For Support. Dispense information and present a thorough explanation of Average Response Time, First Call Resolution using the slides given. This template can be altered and personalized to fit your needs. It is also available for immediate download. So grab it now.
-
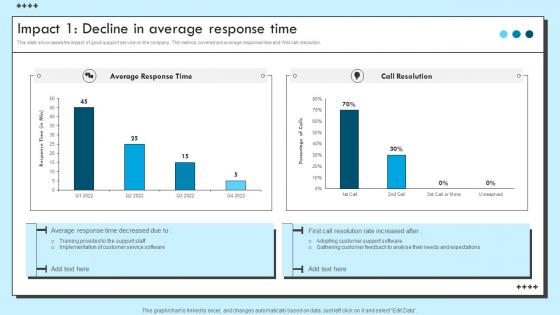 Impact 1 Decline In Average Response Time Improvement Strategies For Support
This slide showcases the impact of good support service on the company. The metrics covered are ticket backlog and support cost. Deliver an outstanding presentation on the topic using this Impact 1 Decline In Average Response Time Improvement Strategies For Support. Dispense information and present a thorough explanation of Average Response Time, Call Resolution using the slides given. This template can be altered and personalized to fit your needs. It is also available for immediate download. So grab it now.
-
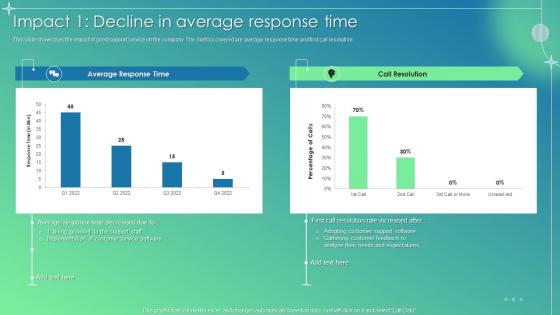 Customer Service Improvement Plan Impact 1 Decline In Average Response Time
This slide showcases the impact of good support service on the company. The metrics covered are average response time and first call resolution. Present the topic in a bit more detail with this Customer Service Improvement Plan Impact 1 Decline In Average Response Time. Use it as a tool for discussion and navigation on Call Resolution, Training Provided, Support Staff, Customer Service Software. This template is free to edit as deemed fit for your organization. Therefore download it now.
-
 Customer Service Improvement Plan Issue 1 Increasing Average Response Time
This slide provides an overview of major KPIs of customer service team. The metrics covered are average response time and first call resolution. Deliver an outstanding presentation on the topic using this Customer Service Improvement Plan Issue 1 Increasing Average Response Time. Dispense information and present a thorough explanation of Average Response Time, First Call Resolution, Agents Communication Skills using the slides given. This template can be altered and personalized to fit your needs. It is also available for immediate download. So grab it now.
-
 Call Center Action Plan Dashboard Highlighting Average Bpo Performance Improvement Action Plan
This slide showcases call center action plan dashboard which highlights first call resolution, unresolved calls, customers call report, response time by weekday and average answer time. Present the topic in a bit more detail with this Call Center Action Plan Dashboard Highlighting Average Bpo Performance Improvement Action Plan. Use it as a tool for discussion and navigation on Resolutions, Dashboard, Response. This template is free to edit as deemed fit for your organization. Therefore download it now.
-
 Average cost of automated measured reported improved kpis ppt slide
Presenting average cost of automated measured reported improved kpis ppt slide. This presentation slide shows three Key Performance Indicators or KPIs in a Dashboard style design. The first KPI that can be shown is Average Cost of Automated Measurement Per KPI. The second KPI is percentage of KPIs Reported According to Approved Plan and the third is percentage of KPIs That are Improved. These KPI Powerpoint graphics are all data driven, and the shape automatically adjusts according to your data. Just right click on the KPI graphic, enter the right value and the shape will adjust automatically. Make a visual impact with our KPI slides.
-
 Average Cost Home Improvement Projects Ppt Powerpoint Presentation Cpb
Presenting Average Cost Home Improvement Projects Ppt Powerpoint Presentation Cpb slide which is completely adaptable. The graphics in this PowerPoint slide showcase three stages that will help you succinctly convey the information. In addition, you can alternate the color, font size, font type, and shapes of this PPT layout according to your content. This PPT presentation can be accessed with Google Slides and is available in both standard screen and widescreen aspect ratios. It is also a useful set to elucidate topics like Average Cost Home Improvement Projects. This well structured design can be downloaded in different formats like PDF, JPG, and PNG. So, without any delay, click on the download button now.
-
 Ways In Which Average Engagement Rate Can Be Improved Video Marketing Strategies To Increase Customer
The following slide outlines different ways which will assist marketer to improve the engagement rate with Facebook video marketing.It provides information about using short caption, posting video of shorter duration and conducting live sessions etc.Present the topic in a bit more detail with this Ways In Which Average Engagement Rate Can Be Improved Video Marketing Strategies To Increase Customer.Use it as a tool for discussion and navigation on Facebook Engagement, Respond Customer, Engagement Rate.This template is free to edit as deemed fit for your organization.Therefore download it now.
-
 Ways In Which Average Engagement Rate Can Be Improved Implementing Video Marketing
The following slide outlines different ways which will assist marketer to improve the engagement rate with Facebook video marketing. It provides information about using short caption, posting video of shorter duration and conducting live sessions etc. Introducing Ways In Which Average Engagement Rate Can Be Improved Implementing Video Marketing to increase your presentation threshold. Encompassed with eight stages, this template is a great option to educate and entice your audience. Dispence information on Average Engagement Rate, Be Improved, using this template. Grab it now to reap its full benefits.
-
 Ways In Which Average Engagement Rate Can Be Improved Building Video Marketing Strategies
The following slide outlines different ways which will assist marketer to improve the engagement rate with facebook video marketing. It provides information about using short caption, posting video of shorter duration and conducting live sessions etc.Introducing Ways In Which Average Engagement Rate Can Be Improved Building Video Marketing Strategies to increase your presentation threshold. Encompassed with eight stages, this template is a great option to educate and entice your audience. Dispence information on Engagement, Respond To Customer, Video Caption, using this template. Grab it now to reap its full benefits.
-
 Ecommerce Accounting Management Improving Average Order Value Rate
The following slide showcases improvement of average order value rate. It provides information about product recommendations, customer loyalty program, product bundling, discount minimums, etc. Present the topic in a bit more detail with this Ecommerce Accounting Management Improving Average Order Value Rate. Use it as a tool for discussion and navigation on Customer, Bundling Products, Average Cart Value. This template is free to edit as deemed fit for your organization. Therefore download it now.
-
 Ways In Which Average Engagement Rate Can Be Improved Improving SEO Using Various Video
The following slide outlines different ways which will assist marketer to improve the engagement rate with Facebook video marketing. It provides information about using short caption, posting video of shorter duration and conducting live sessions etc. Increase audience engagement and knowledge by dispensing information using Ways In Which Average Engagement Rate Can Be Improved Improving SEO Using Various Video. This template helps you present information on eight stages. You can also present information on Average Engagement Rate, Improved, Customer using this PPT design. This layout is completely editable so personaize it now to meet your audiences expectations.
-
 Analyzing Average Time On Page To Improve Landing Page Content Marketing Analytics Guide
This slide covers an overview of the average time on the page to identify the amount of time a visitor spends on the landing page. It also includes strategies to improve, such as decreasing load time, improving post readability, and using exit intent popups. Present the topic in a bit more detail with this Analyzing Average Time On Page To Improve Landing Page Content Marketing Analytics Guide. Use it as a tool for discussion and navigation on Analyzing average, improve landing, page content. This template is free to edit as deemed fit for your organization. Therefore download it now.
-
 Ways In Which Average Engagement Rate Can Be Improved Effective Video Marketing Strategies For Brand Promotion
The following slide outlines different ways which will assist marketer to improve the engagement rate with Facebook video marketing. It provides information about using short caption, posting video of shorter duration and conducting live sessions etc. Introducing Ways In Which Average Engagement Rate Can Be Improved Effective Video Marketing Strategies For Brand Promotion to increase your presentation threshold. Encompassed with eight stages, this template is a great option to educate and entice your audience. Dispence information on Engagement, Marketing, Information, using this template. Grab it now to reap its full benefits.
-
 Analyzing Average Time On Page To Improve Landing Page Content Top Marketing Analytics Trends
This slide covers an overview of the average time on the page to identify the amount of time a visitor spends on the landing page. It also includes strategies to improve, such as decreasing load time, improving post readability, and using exit intent popups. Deliver an outstanding presentation on the topic using this Analyzing Average Time On Page To Improve Landing Page Content Top Marketing Analytics Trends. Dispense information and present a thorough explanation of Decrease Load Time, Improve Post Readability, Use Exit Intent Popups using the slides given. This template can be altered and personalized to fit your needs. It is also available for immediate download. So grab it now.
-
 Marketing Analytics Effectiveness Analyzing Average Time On Page To Improve Landing Page Content
This slide covers an overview of the average time on the page to identify the amount of time a visitor spends on the landing page. It also includes strategies to improve, such as decreasing load time, improving post readability, and using exit intent popups. Present the topic in a bit more detail with this Marketing Analytics Effectiveness Analyzing Average Time On Page To Improve Landing Page Content. Use it as a tool for discussion and navigation on Pageviews, Unique Pageviews, Analyzing Average. This template is free to edit as deemed fit for your organization. Therefore download it now.
-
 Marketing Analytics Guide To Measure Analyzing Average Time On Page To Improve
This slide covers an overview of the average time on the page to identify the amount of time a visitor spends on the landing page. It also includes strategies to improve, such as decreasing load time, improving post readability, and using exit intent popups. Deliver an outstanding presentation on the topic using this Marketing Analytics Guide To Measure Analyzing Average Time On Page To Improve. Dispense information and present a thorough explanation of Average Time Benchmark, Strategies To Improve, Analyzing Average using the slides given. This template can be altered and personalized to fit your needs. It is also available for immediate download. So grab it now.
-
 W15 Ways In Which Average Engagement Rate Can Be Improved Effective Facebook Marketing Strategies
The following slide outlines different ways which will assist marketer to improve the engagement rate with Facebook video marketing. It provides information about using short caption, posting video of shorter duration and conducting live sessions etc. Increase audience engagement and knowledge by dispensing information using W15 Ways In Which Average Engagement Rate Can Be Improved Effective Facebook Marketing Strategies. This template helps you present information on eight stages. You can also present information on Average, Engagement, Improved using this PPT design. This layout is completely editable so personaize it now to meet your audiences expectations.
-
 Maximizing Brand Reach Ways To Improve Average Engagement Rate Strategy SS
The following slide outlines multiple methods through which advertisers can boost engagement rate on Facebook and improve brand awareness. Information covered in this slide is related to using video captions, video duration, live session, behind the scenes, responding to customer queries, etc. Introducing Maximizing Brand Reach Ways To Improve Average Engagement Rate Strategy SS to increase your presentation threshold. Encompassed with eight stages, this template is a great option to educate and entice your audience. Dispence information on Engagement Rate, Brand Awareness, Customer Queries, using this template. Grab it now to reap its full benefits.
-
 Average sales cycle product availability improve forecasting accuracy
Presenting this set of slides with name - Average Sales Cycle Product Availability Improve Forecasting Accuracy. This is an editable five graphic that deals with topics like Average Sales Cycle, Product Availability, Improve Forecasting Accuracy to help convey your message better graphically. This product is a premium product available for immediate download, and is 100 percent editable in Powerpoint. Download this now and use it in your presentations to impress your audience.
-
 Five ways to improve average handling time
Presenting this set of slides with name Five Ways To Improve Average Handling Time. The topics discussed in these slides are Five Ways, Improve, Average, Handling Time. This is a completely editable PowerPoint presentation and is available for immediate download. Download now and impress your audience.
-
 Forecasted employee efficiency and average productivity performance coaching to improve
This slide shows the forecasted data of average production per employee in tonne and employee efficiency in percentage for the next five years 2022 to 2026 Present the topic in a bit more detail with this Forecasted Employee Efficiency And Average Productivity Performance Coaching To Improve. Use it as a tool for discussion and navigation on Forecasted Employee Efficiency And Average Productivity. This template is free to edit as deemed fit for your organization. Therefore download it now.


