Powerpoint Templates and Google slides for Dashboard Indicating
Save Your Time and attract your audience with our fully editable PPT Templates and Slides.
-
 Quality Indicator Dashboard Powerpoint Ppt Template Bundles
If you require a professional template with great design, then this Quality Indicator Dashboard Powerpoint Ppt Template Bundles is an ideal fit for you. Deploy it to enthrall your audience and increase your presentation threshold with the right graphics, images, and structure. Portray your ideas and vision using fifteen slides included in this complete deck. This template is suitable for expert discussion meetings presenting your views on the topic. With a variety of slides having the same thematic representation, this template can be regarded as a complete package. It employs some of the best design practices, so everything is well-structured. Not only this, it responds to all your needs and requirements by quickly adapting itself to the changes you make. This PPT slideshow is available for immediate download in PNG, JPG, and PDF formats, further enhancing its usability. Grab it by clicking the download button.
-
 Indicators Business Growth Graph Performance Development Arrow Pressure Location Dashboard
This complete deck covers various topics and highlights important concepts. It has PPT slides which cater to your business needs. This complete deck presentation emphasizes Indicators Business Growth Graph Performance Development Arrow Pressure Location Dashboard and has templates with professional background images and relevant content. This deck consists of total of thirteen slides. Our designers have created customizable templates, keeping your convenience in mind. You can edit the colour, text and font size with ease. Not just this, you can also add or delete the content if needed. Get access to this fully editable complete presentation by clicking the download button below.
-
 Dashboard Icon Analysis Performance Indicators Informational Business
It covers all the important concepts and has relevant templates which cater to your business needs. This complete deck has PPT slides on Dashboard Icon Analysis Performance Indicators Informational Business with well suited graphics and subject driven content. This deck consists of total of twelve slides. All templates are completely editable for your convenience. You can change the colour, text and font size of these slides. You can add or delete the content as per your requirement. Get access to this professionally designed complete deck presentation by clicking the download button below.
-
 Employee Engagement Icon Statistics Indicating Targets Satisfaction Dashboard
Deliver a lucid presentation by utilizing this Employee Engagement Icon Statistics Indicating Targets Satisfaction Dashboard. Use it to present an overview of the topic with the right visuals, themes, shapes, and graphics. This is an expertly designed complete deck that reinforces positive thoughts and actions. Use it to provide visual cues to your audience and help them make informed decisions. A wide variety of discussion topics can be covered with this creative bundle such as Employee Engagement,Statistics,Indicating,Targets,Satisfaction. All the twelve slides are available for immediate download and use. They can be edited and modified to add a personal touch to the presentation. This helps in creating a unique presentation every time. Not only that, with a host of editable features, this presentation can be used by any industry or business vertical depending on their needs and requirements. The compatibility with Google Slides is another feature to look out for in the PPT slideshow.
-
 Team Coordination Strategies Kpi Dashboard Indicating Teams Performances
The following slide exhibits the dashboard showcasing team performances and the best performers team members. Its key elements include product sales by team, customer satisfaction rating, revenue earned by teams, top revenue earners, etc. Present the topic in a bit more detail with this Team Coordination Strategies Kpi Dashboard Indicating Teams Performances. Use it as a tool for discussion and navigation on Product Sales By Team, Customer Satisfaction Ratings. This template is free to edit as deemed fit for your organization. Therefore download it now.
-
 Key Indicator Dashboard For Measuring Retail KPI Performance
This slide showcases ways to mesure retail KPI performance with key indicator dashboard. This further includes average shopping time, average basket money spend, online vs offline sales etc. Introducing our Key Indicator Dashboard For Measuring Retail KPI Performance set of slides. The topics discussed in these slides are Average Shopping Time, Average Basket Spend. This is an immediately available PowerPoint presentation that can be conveniently customized. Download it and convince your audience.
-
 Key Indicator Dashboard To Measure Reverse Factoring
This slide showcases measure of reverse factoring key indicator dashboard. This further includes amount financed, breakdown for invoices, currencies etc. Presenting our well structured Key Indicator Dashboard To Measure Reverse Factoring. The topics discussed in this slide are Amount Financed, Invoice Financed.This is an instantly available PowerPoint presentation that can be edited conveniently. Download it right away and captivate your audience.
-
 Key Indicator Dashboard For Workforce Development Planning
This slide represents workforce development planning for key indicator dashboard. This further includes supply, skills demand and gap, skill supply, skill analysis, surplus deficit, headcount vs competency etc. Introducing our Key Indicator Dashboard For Workforce Development Planning set of slides. The topics discussed in these slides are Skill Supply, Surplus Deficit, Headcount Competency. This is an immediately available PowerPoint presentation that can be conveniently customized. Download it and convince your audience.
-
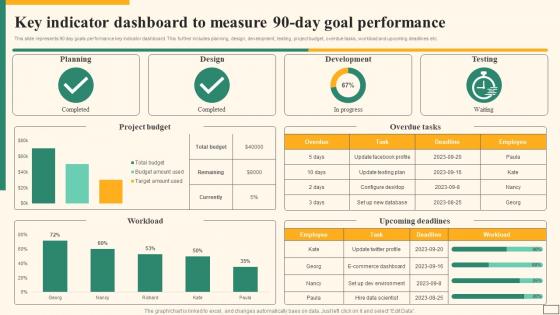 Key Indicator Dashboard To Measure 90 Day Goal Performance
This slide represents 90 day goals performance key indicator dashboard. This further includes planning, design, development, testing, project budget, overdue tasks, workload and upcoming deadlines etc. Introducing our Key Indicator Dashboard To Measure 90 Day Goal Performance set of slides. The topics discussed in these slides are Planning,Design,Development. This is an immediately available PowerPoint presentation that can be conveniently customized. Download it and convince your audience.
-
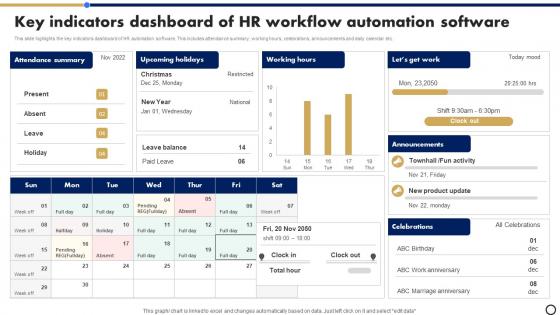 Key Indicators Dashboard Of HR Workflow Automation Software
This slide highlights the key indicators dashboard of HR automation software. This includes attendance summary, working hours, celebrations, announcements and daily calendar etc. Introducing our Key Indicators Dashboard Of HR Workflow Automation Software set of slides. The topics discussed in these slides are Attendance Summary, Upcoming Holidays, Working Hours. This is an immediately available PowerPoint presentation that can be conveniently customized. Download it and convince your audience.
-
 Key Indicator Dashboard To Measure Budget Report Projection
This slide represents ways to measure budget report projection with key indicator dashboard. This includes budget, spent, left to spend, budget by projects, budget vs spend etc. Presenting our well structured Key Indicator Dashboard To Measure Budget Report Projection. The topics discussed in this slide are Budget, Spent, Left To Spend. This is an instantly available PowerPoint presentation that can be edited conveniently. Download it right away and captivate your audience.
-
 Key Indicator Dashboard For Crisis Management For Employees And Customers
This slide showcases crisis management for employees and customers key indicator dashboard. This slide includes articles published, total interaction, overtime change in public interest and overtime change in media interest. Presenting our well structured Key Indicator Dashboard For Crisis Management For Employees And Customers. The topics discussed in this slide are Media Interest, Public Interest. This is an instantly available PowerPoint presentation that can be edited conveniently. Download it right away and captivate your audience.
-
 Key Indicator Dashboard For IOT Data Visualization
This slide represents IOT data visualization key indicator dashboard. This slide includes traffic loops, speed of cars average, patterns as per weekly and hourly and date wise traffic density low or high. Introducing our Key Indicator Dashboard For IOT Data Visualization set of slides. The topics discussed in these slides are Key Benefits With Data Visualization In IOT. This is an immediately available PowerPoint presentation that can be conveniently customized. Download it and convince your audience.
-
 Key Indicator Dashboard To Measure Brand Performance
This slide highlights brand performance key indicator dashboard. This further includes total impressions, total clicks, total acquisition and total cost per acquisition and campaigns with budget. Introducing our Key Indicator Dashboard To Measure Brand Performance set of slides. The topics discussed in these slides are Indicator, Measure, Brand. This is an immediately available PowerPoint presentation that can be conveniently customized. Download it and convince your audience.
-
 Key Indicators Dashboard Of HR Automation Software
This slide highlights the key indicators dashboard of HR automation software. This includes attendance summary, working hours, celebrations, announcements and daily calendar etc. Introducing our Key Indicators Dashboard Of HR Automation Software set of slides. The topics discussed in these slides are Attendance Summary, Upcoming Holidays, Working Hours. This is an immediately available PowerPoint presentation that can be conveniently customized. Download it and convince your audience.
-
 Key Indicator Dashboard Of Export Market Software
This slide highlights the key indicators dashboard of export market software. This includes analytics, buyer analysis, seller countries and top importers to help business understand the performance. Presenting our well structured Key Indicator Dashboard Of Export Market Software. The topics discussed in this slide are Analytics, Analysis Of Buyers. This is an instantly available PowerPoint presentation that can be edited conveniently. Download it right away and captivate your audience.
-
 Key Indicator Dashboard For Predictive Analysis In Healthcare
This slide represents predictive analysis in healthcare key indicator dashboard. This further includes number of inpatients, number of outpatients, average wait in minutes and current patients by division etc. Presenting our well structured Key Indicator Dashboard For Predictive Analysis In Healthcare. The topics discussed in this slide are Number Of Inpatients, Current Patients.This is an instantly available PowerPoint presentation that can be edited conveniently. Download it right away and captivate your audience.
-
 Key Indicator Dashboard For Construction Quality Project
This slide showcases construction quality project key indicator dashboard. This further includes project work status, utilized budget, project duration and actual vs planned resources etc. Presenting our well structured Key Indicator Dashboard For Construction Quality Project. The topics discussed in this slide are Project Completion Percentage, Utilized Duration.This is an instantly available PowerPoint presentation that can be edited conveniently. Download it right away and captivate your audience.
-
 Key Indicator Dashboard Of Organization Resource Planning Software
This slide highlights the dashboard of organization resource planning software. It includes planned time for project, actual time taken for project and time variance in data and pie chart form. Introducing our Key Indicator Dashboard Of Organization Resource Planning Software set of slides. The topics discussed in these slides are Planned Time, Actual Time. This is an immediately available PowerPoint presentation that can be conveniently customized. Download it and convince your audience.
-
 Audit Key Performance Indicators Dashboard
This slide showcases the effective audit key performance indicators dashboard which helps an organization to provide cloud based platform that transforms risk management system. It include details such as satisfactory, requires some improvement, unsatisfactory, etc. Introducing our Audit Key Performance Indicators Dashboard set of slides. The topics discussed in these slides are Planned Audits Status, Audit Observation Summary, Planned Audit Risk Rating, Completed Audits Results. This is an immediately available PowerPoint presentation that can be conveniently customized. Download it and convince your audience.
-
 OKR Dashboard To Assess Business Performance Indicators
This slide depicts the OKR dashboard to evaluate the business performance indicators. The purpose of this slide is to help the business track its performance through measurement of indicators such as profitability rate, conversion rate, etc. Introducing our OKR Dashboard To Assess Business Performance Indicators set of slides. The topics discussed in these slides are Profitability Rate, Average Online, Conversion Rate Retail This is an immediately available PowerPoint presentation that can be conveniently customized. Download it and convince your audience.
-
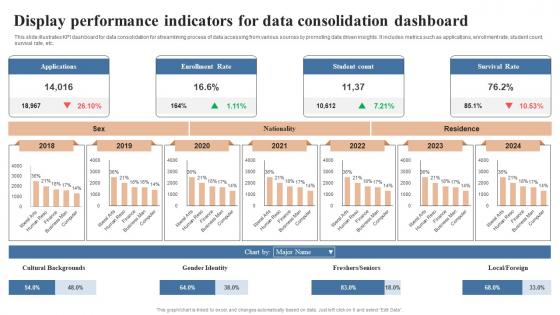 Display Performance Indicators For Data Consolidation Dashboard
This slide illustrates KPI dashboard for data consolidation for streamlining process of data accessing from various sources by promoting data driven insights. It includes metrics such as applications, enrollment rate, student count, survival rate, etc. Introducing our Display Performance Indicators For Data Consolidation Dashboard set of slides. The topics discussed in these slides are Applications, Enrollment Rate, Survival Rate This is an immediately available PowerPoint presentation that can be conveniently customized. Download it and convince your audience.
-
 Key Indicator Dashboard To Measure Okr Report Performance
This slide represents okr report performance measuring key indicator dashboard. This further includes revenue, new restaurant, new hires, avg revenue per restaurant, avg set up time etc. Presenting our well structured Key Indicator Dashboard To Measure Okr Report Performance. The topics discussed in this slide are Dashboard, Measure, Performance. This is an instantly available PowerPoint presentation that can be edited conveniently. Download it right away and captivate your audience.
-
 Key Indicator Dashboard Of Product Release
Presenting our well structured Key Indicator Dashboard Of Product Release The topics discussed in this slide are Tasks By Priority, Tasks By Type, Release StatusThis is an instantly available PowerPoint presentation that can be edited conveniently. Download it right away and captivate your audience.
-
 Dashboard Indicating Growth Hacking Strategies Impact
The purpose of the slide is to showcase the dashboard indicating growth hacking strategies impact. It include elements such as performance tracker, link clicks, number of leads, page likes, campaign details, total clicks etc. Introducing our Dashboard Indicating Growth Hacking Strategies Impact set of slides. The topics discussed in these slides are Dashboard, Strategies Impact, Performance. This is an immediately available PowerPoint presentation that can be conveniently customized. Download it and convince your audience.
-
 Dashboard Indicating Integrated Retail Marketing Impact
The slide depicts omnichannel retail marketing impact dashboard enabling retailers to analyze campaign performance. It include elements such as total conversations, customer satisfaction rate, incoming conversations, abandon rate etc. Introducing our Dashboard Indicating Integrated Retail Marketing Impact set of slides. The topics discussed in these slides are Dashboard Indicating Integrated, Retail Marketing Impact, Incoming Conversations, Abandon Rate. This is an immediately available PowerPoint presentation that can be conveniently customized. Download it and convince your audience.
-
 Safety Leading And Lagging Indicators Dashboard
This slide showcases dashboard for safety leading and lagging indicators. It aims to track progress in reaching business goals by providing valuable insights to monitor safety performance metrics. It includes various elements such as total manpower, incidents by hazard type, unsafe acts or conditions, etc. Introducing our Safety Leading And Lagging Indicators Dashboard set of slides. The topics discussed in these slides are Safety Leading And Lagging, Indicators Dashboard. This is an immediately available PowerPoint presentation that can be conveniently customized. Download it and convince your audience.
-
 Dashboard Indicating Insider Trading Buyers And Sellers
The slide represents dashboard providing real time insights into insider trading buying and selling activities. It include elements such as total insiders, net buyers, buy sell ratio, and trend analysis. Presenting our well structured Dashboard Indicating Insider Trading Buyers And Sellers. The topics discussed in this slide are Dashboard, Analysis, Net Buyers. This is an instantly available PowerPoint presentation that can be edited conveniently. Download it right away and captivate your audience.
-
 Key Indicator Dashboard Of Vertical Channel Marketing Software
This slide showcases the key indicators for vertical channel marketing software. This further includes reach, engagement and conversion data along with geography and industry. Introducing our premium set of slides with Key Indicator Dashboard Of Vertical Channel Marketing Software Ellicudate the Four stages and present information using this PPT slide. This is a completely adaptable PowerPoint template design that can be used to interpret topics like Geography, Industry, Conversion. So download instantly and tailor it with your information.
-
 Key Indicator Dashboard For Employee Mid Year Review
This slide represents mid year review key indicator dashboard. This further includes topics, average score, self assessment, manager score and selected reviewers. Introducing our Key Indicator Dashboard For Employee Mid Year Review set of slides. The topics discussed in these slides are Hide Score Legend, Average Score. This is an immediately available PowerPoint presentation that can be conveniently customized. Download it and convince your audience.
-
 Cash Flow Dashboard Business Sustainability Performance Indicators
Following slide covers cash flow dashboard covering details like beginning cash on hand, cash going in, cash going out, profit or loss and ending cash on hand. It also includes detail of accounts receivable and payable. Present the topic in a bit more detail with this Cash Flow Dashboard Business Sustainability Performance Indicators. Use it as a tool for discussion and navigation on Dashboard, Accounts Payable, Receivable. This template is free to edit as deemed fit for your organization. Therefore download it now.
-
 Customer Satisfaction Dashboard Business Sustainability Performance Indicators
Mentioned slide covers customer satisfaction dashboard with a 12 month format. It includes customer satisfaction details by region and by district. Present the topic in a bit more detail with this Customer Satisfaction Dashboard Business Sustainability Performance Indicators. Use it as a tool for discussion and navigation on Customer, Satisfaction, Dashboard. This template is free to edit as deemed fit for your organization. Therefore download it now.
-
 Customer Service Dashboard Business Sustainability Performance Indicators
Following slide illustrates customer service dashboard covering details such as request answered, total requests, total revenue and support cost revenue. It also includes customer satisfaction score, customer retention in a 12 months format. Deliver an outstanding presentation on the topic using this Customer Service Dashboard Business Sustainability Performance Indicators. Dispense information and present a thorough explanation of Customer, Service, Dashboard using the slides given. This template can be altered and personalized to fit your needs. It is also available for immediate download. So grab it now.
-
 Dashboard indicating hr consultancy team performance
Presenting our well structured Dashboard Indicating HR Consultancy Team Performance. The topics discussed in this slide are Dashboard Indicating HR Consultancy Team Performance. This is an instantly available PowerPoint presentation that can be edited conveniently. Download it right away and captivate your audience.
-
 Dashboard indicating retail banking business lines performance
Introducing our Dashboard Indicating Retail Banking Business Lines Performance set of slides. The topics discussed in these slides are Average, Revenue, Performance. This is an immediately available PowerPoint presentation that can be conveniently customized. Download it and convince your audience.
-
 Information Technology Dashboard Indicating Website Traffic Analysis
This slide shows information technology dashboard indicating website traffic analysis which can be beneficial for IT managers for making changes to drive more visitors into their websites. It includes information about locational sessions, bounce rate, medium classification, user vs new user, etc. Introducing our Information Technology Dashboard Indicating Website Traffic Analysis set of slides. The topics discussed in these slides are Bounce Rate, Medium Classification, Users Vs New Users. This is an immediately available PowerPoint presentation that can be conveniently customized. Download it and convince your audience.
-
 HR Dashboard Indicating Weekly Career Counselling KPIs
This slide illustrates HR career counselling dashboard. It provides information about hours of consultation, satisfaction rate, per consultant rate, popular counselors, etc. Introducing our HR Dashboard Indicating Weekly Career Counselling KPIs set of slides. The topics discussed in these slides are HR Dashboard Indicating Weekly Career Counselling KPIs. This is an immediately available PowerPoint presentation that can be conveniently customized. Download it and convince your audience.
-
 Business Identity Dashboard Snapshot Indicating Brand Marketing KPIS
This slide shows business identity dashboard snapshot indicating brand marketing performance metrics. It contains details about brand metrics, advertisement metrics and purchase metrics. It also includes details from brand awareness to repeat purchase. Presenting our well structured Business Identity Dashboard Indicating Brand Marketing KPIS. The topics discussed in this slide are Brand Metrics, Advertising Metrics, Purchase Metrics. This is an instantly available PowerPoint presentation that can be edited conveniently. Download it right away and captivate your audience.
-
 Dashboard Indicating Status Of Change Requests For Effective Leadership Decisions
This slide showcase leadership dashboard indicating status of change requests for effective leadership decisions which can benefit organizations in earning additional revenues and stimulate employee performance. It contains change request due in a week, change request due in month, open changes, waiting for approval, open changes by risk, change requests by status and change requests by due date. Introducing our Dashboard Indicating Status Of Change Requests For Effective Leadership Decisions set of slides. The topics discussed in these slides are Dashboard Indicating Status Of Change Requests For Effective Leadership Decisions. This is an immediately available PowerPoint presentation that can be conveniently customized. Download it and convince your audience.
-
 Employee proficiency management with progress indicators dashboard
Introducing our Employee Proficiency Management With Progress Indicators Dashboard set of slides. The topics discussed in these slides are Employee Proficiency Management With Progress Indicators Dashboard. This is an immediately available PowerPoint presentation that can be conveniently customized. Download it and convince your audience.
-
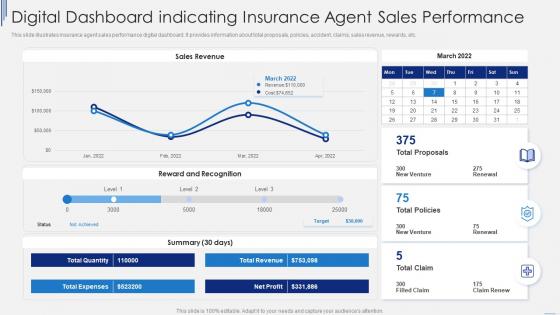 Digital Dashboard Indicating Insurance Agent Sales Performance
This slide illustrates insurance agent sales performance digital dashboard. It provides information about total proposals, policies, accident, claims, sales revenue, rewards, etc. Introducing our Digital Dashboard Indicating Insurance Agent Sales Performance set of slides. The topics discussed in these slides are Sales Revenue, Reward And Recognition, Expenses. This is an immediately available PowerPoint presentation that can be conveniently customized. Download it and convince your audience.
-
 Staff Turnover Key Performance Indicators Dashboard Snapshot
The following slide highlights the staff turnover key performance Indicators dashboard snapshot illustrating employee turn over, turn over rate, average tenure, turnover per quarter, turnover per department, turnover type, turnover time period, turnover per position and turnover reasons. Introducing our Staff Turnover Key Performance Indicators Dashboard set of slides. The topics discussed in these slides are Turnover Per Quarter, Turnover Time Period, Turnover Per Position. This is an immediately available PowerPoint presentation that can be conveniently customized. Download it and convince your audience.
-
 Third Party Vendors Risk Key Performance Indicators Dashboard Snapshot
This slide illustrates graphical representation of risk key performance indicators. It includes third party vendors trust score, impact score and risk score. Presenting our well structured Third Party Vendors Risk Key Performance Indicators Dashboard Snapshot. The topics discussed in this slide are Key Performance, Vendors Trust Score, Vendors Impact Score, Vendors Risk Score. This is an instantly available PowerPoint presentation that can be edited conveniently. Download it right away and captivate your audience.
-
 HR Dashboard Indicating New Employee Hiring And Introduction
The following slide exhibits human resource dashboard highlighting new employee onboarding and hiring status. It provides information about offers sent, hired, introduction time, progress, tasks, applications received, etc. Introducing our HR Dashboard Indicating New Employee Hiring And Introduction set of slides. The topics discussed in these slides are Offer Acceptance Ratio, Applications Received, Time To Accept Offer, New Employees Hired. This is an immediately available PowerPoint presentation that can be conveniently customized. Download it and convince your audience.
-
 Hr Structure Dashboard Snapshot Indicating Kpis Of Employees
This slide represents human resource HR structure dashboard Snapshot indicating key performance indicators KPIs of employees. it provides information regarding absenteeism, overtime hours, training costs etc. Presenting our well-structured Hr Structure Dashboard Indicating Kpis Of Employees. The topics discussed in this slide are Structure, Dashboard, Employees. This is an instantly available PowerPoint presentation that can be edited conveniently. Download it right away and captivate your audience.
-
 Dashboard Indicating Funding Ask Capital Raising Stages
This slide showcases dashboard indicating status of multiple stages in funding ask. It provides information about valuation, discount, investors, seed round, angel, previous funding, etc. Introducing our Dashboard Indicating Funding Ask Capital Raising Stages set of slides. The topics discussed in these slides are Building Expenses, Resource Requirement. This is an immediately available PowerPoint presentation that can be conveniently customized. Download it and convince your audience.
-
 TCO Dashboard Indicating Cost Breakdown And Storage Analysis
This slide shows total cost of ownershipTCO dashboard indicating cost breakdown and storage analysis. It contains information about hardware, overhead, on premise, cloud software, etc. Introducing our TCO Dashboard Indicating Cost Breakdown And Storage Analysis set of slides. The topics discussed in these slides are Capacity, Cost, Cloud. This is an immediately available PowerPoint presentation that can be conveniently customized. Download it and convince your audience.
-
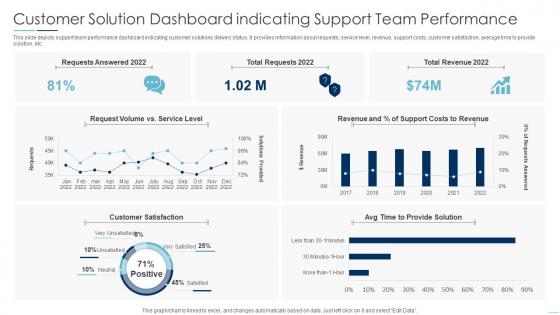 Customer Solution Dashboard Indicating Support Team Performance
This slide depicts support team performance dashboard indicating customer solutions delivery status. It provides information about requests,service level,revenue,support costs,customer satisfaction,average time to provide solution,etc. Introducing our Customer Solution Dashboard Indicating Support Team Performance set of slides. The topics discussed in these slides are Costs To Revenue, Customer Satisfaction, Total Requests. This is an immediately available PowerPoint presentation that can be conveniently customized. Download it and convince your audience.
-
 Finance KPI Dashboard Indicating Account Receivable And Account Payable
Introducing our Finance KPI Dashboard Indicating Account Receivable And Account Payable set of slides. The topics discussed in these slides are Monthly Cash Flow, Payment Timeline, Accounts Payable. This is an immediately available PowerPoint presentation that can be conveniently customized. Download it and convince your audience.
-
 Finance KPI Dashboard Indicating Portfolio Performance
Presenting our well structured Finance KPI Dashboard Indicating Portfolio Performance. The topics discussed in this slide are Asset Management, Portfolio Performance. This is an instantly available PowerPoint presentation that can be edited conveniently. Download it right away and captivate your audience.
-
 Finance KPI Dashboard Indicating Product And Service Revenue
Introducing our Finance KPI Dashboard Indicating Product And Service Revenue set of slides. The topics discussed in these slides are Finance KPI Dashboard Indicating Product And Service Revenue. This is an immediately available PowerPoint presentation that can be conveniently customized. Download it and convince your audience.
-
 Finance KPI Dashboard Indicating Short Term Assets
Presenting our well structured Finance KPI Dashboard Indicating Short Term Assets. The topics discussed in this slide are Global Financial Performance, Quick Ratio, Short Term Assets. This is an instantly available PowerPoint presentation that can be edited conveniently. Download it right away and captivate your audience.
-
 Cash flow dashboard snapshot measure sustainability key performance indicators
Following slide covers cash flow dashboard snapshot covering details like beginning cash on hand, cash going in, cash going out, profit or loss and ending cash on hand. It also includes detail of accounts receivable and payable. Present the topic in a bit more detail with this Cash Flow Dashboard Measure Sustainability Key Performance Indicators. Use it as a tool for discussion and navigation on Beginning Cash On Hand, Cash Going, Cash Going Out, Profit, Loss, Ending Cash Hand. This template is free to edit as deemed fit for your organization. Therefore download it now.
-
 Customer satisfaction dashboard snapshot measure sustainability key performance indicators
Mentioned slide covers customer satisfaction dashboard with a 12-month format. It includes customer satisfaction details by region and by district. Present the topic in a bit more detail with this Customer Satisfaction Dashboard Snapshot Measure Sustainability Key Performance Indicators. Use it as a tool for discussion and navigation on Best Demonstrated, Worst Demonstrated, Avg Variance Target. This template is free to edit as deemed fit for your organization. Therefore download it now.
-
 Customer service dashboard snapshot measure sustainability key performance indicators
Following slide illustrates customer service dashboard covering details such as request answered, total requests, total revenue and support cost revenue. It also includes customer satisfaction score, customer retention in a 12 months format. Deliver an outstanding presentation on the topic using this Customer Service Dashboard Snapshot Measure Sustainability Key Performance Indicators. Dispense information and present a thorough explanation of Costs Per Support, Avg. Time To Solve Issue, Customer Retention, Request Volume Vs Service Level, Customer Satisfaction using the slides given. This template can be altered and personalized to fit your needs. It is also available for immediate download. So grab it now.
-
 Measure sustainability key performance indicators cash flow dashboard
Mentioned slide covers cash flow dashboard. It shows detailed cash flow status in a 12 months format and working capital with accounts receivable and payable details. Present the topic in a bit more detail with this Measure Sustainability Key Performance Indicators Cash Flow Dashboard. Use it as a tool for discussion and navigation on Cash Flow, Days Sales Outstanding, Projected, Working Capital. This template is free to edit as deemed fit for your organization. Therefore download it now.
-
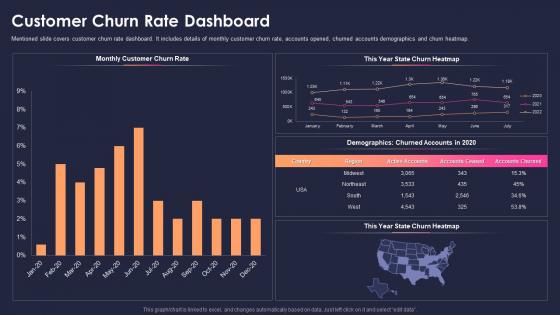 Measure sustainability key performance indicators customer churn rate dashboard
Mentioned slide covers customer churn rate dashboard. It includes details of monthly customer churn rate, accounts opened, churned accounts demographics and churn heatmap. Deliver an outstanding presentation on the topic using this Measure Sustainability Key Performance Indicators Customer Churn Rate Dashboard. Dispense information and present a thorough explanation of Monthly Customer, Churn Rate, Demographics, Churned Accounts 2020 using the slides given. This template can be altered and personalized to fit your needs. It is also available for immediate download. So grab it now.
-
 Measure sustainability key performance indicators customer lifetime value dashboard
This slide covers customer lifetime value dashboard. It covers details of average customer lifetime and average lifetime value in a 12 months format. Present the topic in a bit more detail with this Measure Sustainability Key Performance Indicators Customer Lifetime Value Dashboard. Use it as a tool for discussion and navigation on Average Customer Lifetime, Average Lifetime Value. This template is free to edit as deemed fit for your organization. Therefore download it now.
-
 Measure sustainability key performance indicators customer satisfaction dashboard
Following slide shows customer satisfaction dashboard covering net promoter score. It also includes customer retention metrics with a 12-month format. Deliver an outstanding presentation on the topic using this Measure Sustainability Key Performance Indicators Customer Satisfaction Dashboard. Dispense information and present a thorough explanation of Net Promoter Score, Customer Retention, Promoters, Passives, Detractors using the slides given. This template can be altered and personalized to fit your needs. It is also available for immediate download. So grab it now.
-
 Measure sustainability key performance indicators customer service dashboard
This slide covers customer service dashboard. It includes weekly details of number of support incidents, average first response time, average resolution time, abandon rate, average waiting time and first contact resolution. Present the topic in a bit more detail with this Measure Sustainability Key Performance Indicators Customer Service Dashboard. Use it as a tool for discussion and navigation on Number support incident week, Resolution Time by Channel, Average First Response Time, Average Resolution Time, First Contact Resolution . This template is free to edit as deemed fit for your organization. Therefore download it now.


