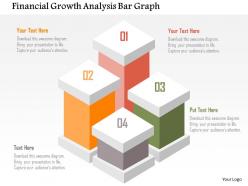
Financial growth analysis bar graph flat powerpoint design
Projecting Financial growth has never been easier with our financial growth analysis bar graph flat PowerPoint design. Our developers tried hard to create a PowerPoint presentation which could be used by officials working in the finance and marketing organisations. With this PPT template, you have the best tool to project financial growth for a quarter or six months or even yearly growth. The PPT layout contains four bars which can be used to signify different variables. For instance, the PPT diagram can be used to depict four different phases of the yearly financial growth or it is up to you to decide to show those bar graphs for showing the projected growth every quarter. The color scheme of this PowerPoint template is attractive and holds the potential to grab the attention of the audience. This takes a lot of unnecessary load off the shoulders of facilitator. Hurry up and download our PowerPoint slide to simplify your work. Our Financial Growth Analysis Bar Graph Flat Powerpoint Design are bound to flabbergast you. You will discover fascination anew.
You must be logged in to download this presentation.
 Impress your
 audience
Editable
of Time
PowerPoint presentation slides
Easily convertible into PDF & JPEG format. Beneficial for marketing and finance professionals. Smooth interface is compatible with Google slides and other softwares. Customisable layout allows you to change color schemes and use different sizes. Add business details to avoid plagiarism. No Pixilation which means crystal clear display on bigger screens. High Resolution graphics and quick to download.
People who downloaded this PowerPoint presentation also viewed the following :
Financial growth analysis bar graph flat powerpoint design with all 5 slides:
Dispel all gloom with our Financial Growth Analysis Bar Graph Flat Powerpoint Design. Their eyes will glisten with expectation.
-
Very unique, user-friendly presentation interface.
-
Innovative and attractive designs.


