Data visualization
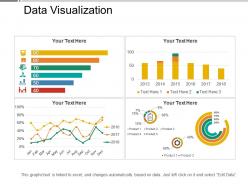
Use this Data Visualization PowerPoint presentation to communicate the company data to your employees. The quantitative data can be conveyed by using dots, lines, or bars, using this data visualization PPT layout. By using this visualization tools PowerPoint theme, the trends, outliers, and patterns in data can be identified with the help of a bar chart, histogram, scatterplot, Gantt chart, line chart, heat map, matrix, pie chart, etc. Professionals in fields of government, finance, marketing, history, consumer goods, service industries, education, sports and researchers can employ this statistical graphics PPT theme. The data analysis of the company can be effectively depicted using this descriptive statistical PowerPoint template. The advantages of data visualization can be discussed with your employees using this graphical PPT theme. You can explain the complex data in easy to understand manner using this statistical PowerPoint template. Hence download this data interpretation PPT layout to make large data sets coherent to different variables.
You must be logged in to download this presentation.
 Impress your
 audience
Editable
of Time
PowerPoint presentation slides
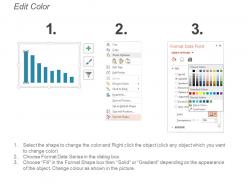
Presenting this Data Visualization PowerPoint slide. This PPT presentation is Google Slides compatible hence it is easily accessible. You can download and save this PowerPoint layout in different formats like PDF, PNG, and JPG. This PPT theme is available in both 4:3 and 16:9 aspect ratios. As this PowerPoint template is 100% editable, you can modify color, font size, font type, and shapes as per your requirements.
People who downloaded this PowerPoint presentation also viewed the following :
Data visualization with all 5 slides:
Experience creativity at it's best with our Data Visualization. You will find them an aesthetic delight.
-
Top Quality presentations that are easily editable.
-
Presentation Design is very nice, good work with the content as well.


