Charts, Graphs PowerPoint Designs, Presentation Charts Designs & PPT Graphics
- Sub Categories
-
- Arrows and Targets
- Bullet and Text Slides
- Charts and Graphs
- Circular Cycle Diagrams
- Concepts and Shapes
- Custom Flat Designs
- Dashboards and Measuring
- Flow Process
- Funnels
- Gears
- Growth
- Harvey Balls
- Idea Innovation and Light Bulbs
- Leadership
- Linear Process Diagrams
- Magnifying Glass
- Misc Other Graphics
- Opportunity and Handshake
- Organization Charts
- Puzzles
- Pyramids
- Roadmaps and Timelines
- Silhouettes
- Steps
- Strategic Planning Analysis
- SWOT Analysis
- Tables and Matrix
- Teamwork
- Technology and Communication
- Venn Diagrams
- Visuals and Illustrations
-
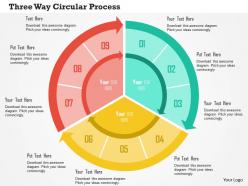 Three way circular process flat powerpoint design
Impactful show of graphical visuals. Extraordinary match of the topic and the PPT components. Impressive designing to incorporate your tailor-made needs. High resolution PowerPoint visuals which do not get pixelate when projected on wide screen. Stunning picture quality does not deer when undergoes modification.
-
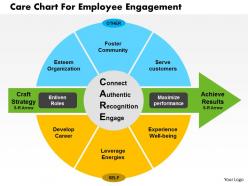 Care chart for employee engagement flat powerpoint design
Compatible with Google slides and most of the common softwares. Changeable into PDF or JPEG format. Customisable in terms of color schemes and rewritable text. No pixilation when used on bigger and wider screens. High quality graphics. Small size saves space and the presentation is easily downloadable. Introduce company’s name or logo to avoid imitation from competitors. Extremely useful for employers.
-
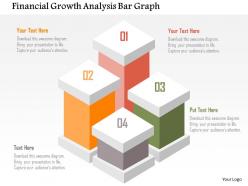 Financial growth analysis bar graph flat powerpoint design
Easily convertible into PDF & JPEG format. Beneficial for marketing and finance professionals. Smooth interface is compatible with Google slides and other softwares. Customisable layout allows you to change color schemes and use different sizes. Add business details to avoid plagiarism. No Pixilation which means crystal clear display on bigger screens. High Resolution graphics and quick to download.
-
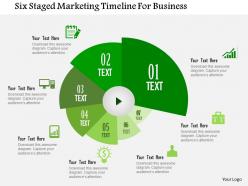 Six staged marketing timeline for business flat powerpoint design
We are proud to present our six staged marketing timeline for business flat powerpoint design. Six staged timeline graphic has been used to craft this power point template. This PPT diagram contains the concept of displaying marketing success milestones. This PPT diagram can be used sales and marketing related presentations.
-
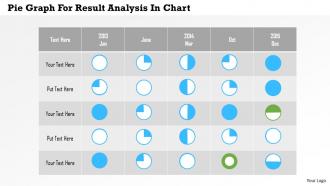 Pie graph for result analysis in chart flat powerpoint design
We are proud to present our pie graph for result analysis in chart flat powerpoint design. Graphic of pie graph has been used to craft this power point template diagram. This PPT diagram contains the concept of result analysis. This diagram can be used for business and marketing presentations.
-
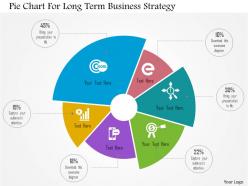 Pie chart for long term business strategy flat powerpoint design
Unique presentation of business concept. Adjustable with multiple topics related to sales and marketing. Compatible with numerous format options. Harmonious with big set of software. High resolution. No issue of pixilation when projected on wide screen. 100 percent editable. Modify the slide content as per individual preference. Personalize the presentation with company name and logo.
-
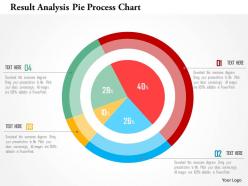 Result analysis pie process chart flat powerpoint design
Widescreen output without the problem of pixilation. 100 percent editable content. Easy inclusion and exclusion of PPT icons, colors, orientation, etc. Personalize the content with company name and logo. Ease of inclusion or exclusion of details in slide background. Ease of download and compatibility with varied software. Significantly useful PowerPoint slide icons by financial analysts, students, teachers and banking professionals.
-
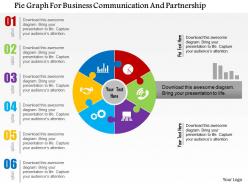 Pie graph for business communication and partnership flat powerpoint design
This presentation template is fully compatible with Google slides. Picture quality remain unaffected even when resize the image. Easily converted to other software’s like JPG and PDF formats. Ideal recommendation for marketing, entrepreneurs and big organizations. Change PowerPoint design for font, text, color and design as per your style. Trouble-free data input of company logo, brand or name.
-
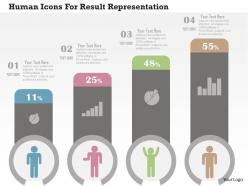 Human icons for result representation flat powerpoint design
We are proud to present our human icons for result representation flat powerpoint design. This power point template diagram has been crafted with graphic of human icon. This PPT diagram contains the concept of result representation. Use this PPT diagram can be used for business and management related presentations.
-
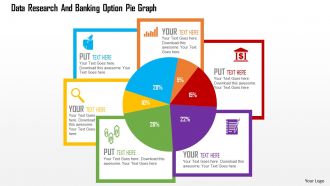 Data Research And Banking Option Pie Graph Flat Powerpoint Design
Exclusive patterns and graphics which are inspired by the current trends to impress the audience. Versatile and multipurpose PPT presentation diagram. Creates transparency of business processes. Enables better understanding and memorising the information displayed. Runs smoothly with all software’s. Compatible with Google framework. 100% amendable icons and images.
-
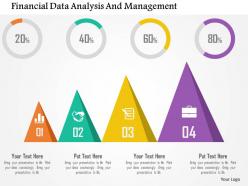 Financial data analysis and management flat powerpoint design
We are proud to present our financial data analysis and management flat powerpoint design. This power point template has been crafted with graphic of triangular bar graph. This PPT diagram contains the concept of financial data analysis and management. Use this PPT diagram for finance related topics.
-
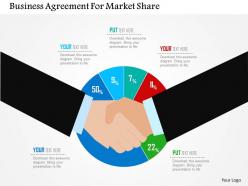 Business agreement for market share flat powerpoint design
We are proud to present our business agreement for market share flat powerpoint design. Concept of business agreement for market research and share has been displayed in this PPT diagram. This PPT diagram contains the graphic of handshake and pie graph. Use this PPT diagram for business and marketing related presentations.
-
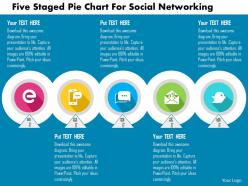 Five staged pie chart for social networking flat powerpoint design
We are proud to present our five staged pie chart for social networking flat powerpoint design. Five staged pie chart has been used to craft this power point template diagram. This PPT diagram contains the concept of social networking. Use this diagram PPT for business and marketing related presentations.
-
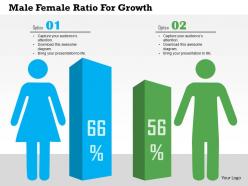 Male female ratio for growth flat powerpoint design
We are proud to present our male female ratio for growth flat powerpoint design. Concept of balance in male and female ratio has been described in this PPT diagram. This PPT diagram contains the graphic of male and female icons with respective bar graphs. Use this PPT diagram for business and social topics related presentations.
-
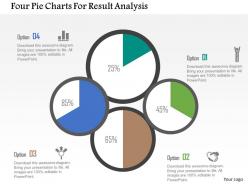 Four Pie Charts For Result Analysis Flat Powerpoint Design
High quality visuals with splendid resolution. 100 percent editable PPT slide templates. Aesthetically designed and professionally proficient. Include or exclude the slide content at your ease and requirement. Compatible with several software options. Harmonious with numerous format options life JPEG, JPG or PDF. Ease of personalization with your company specific name, logo and or trademark.
-
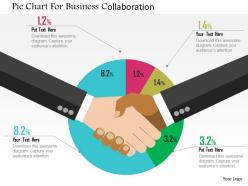 Pie chart for business collaboration flat powerpoint design
We are proud to present our pie chart for business collaboration flat powerpoint design. Graphic of pie chart has been used to craft this power point template diagram. This PPT diagram contains the concept of business collaboration. Use this PPT diagram for business presentations.
-
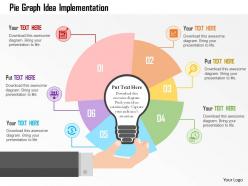 Pie graph idea implementation flat powerpoint design
SlideTeam proudly presents to you its pie graph idea implementation flat PowerPoint design. As this presentation slideshow is fully editable you can modify the font size, font style and even the font color of the text used as per your requirements. You can view the template in either standard size display ratio of 4:3 or widescreen display ratio of 16:9. The PPT slideshow can be saved in format of PDF or JPG. This deck of slides is also compatible with Google slides.
-
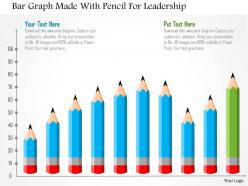 Bar graph made with pencil for leadership flat powerpoint design
We are proud to present our bar graph made with pencil for leadership flat powerpoint design. Graphic of bar graph and pencil has been used to design this power point template. This PPT diagram contains the concept of leadership. Use this PPT diagram for business and marketing related presentations.
-
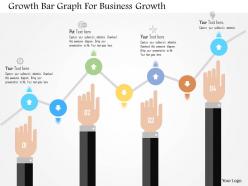 Growth bar graph for business growth flat powerpoint design
We are proud to present our growth bar graph for business growth flat powerpoint design. Concept of business growth has been defined in this power point template diagram. This PPT diagram contains the graphic of bar graph. Use this PPT diagram for business and marketing related presentations.
-
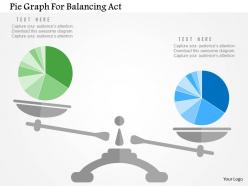 Pie graph for balancing act flat powerpoint design
We are proud to present our pie graph for balancing act flat powerpoint design. Graphic of pie graph has been used to craft this power point template diagram. This PPT diagram contains the concept of balance. Use this PPT diagram for business and technology related presentations.
-
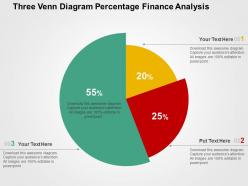 Three venn diagram percentage finance analysis flat powerpoint design
Presentation slide graphic of for financial analysis. Can be used by marketers, students, professors, sales people, business analysts, etc. Compatible with number of software options. Colors and text can be easily changed as the PPT slide is completely editable. Personalize the presentation with individual company name and logo. Available in both Standard and Widescreen slide size. Easy and quick downloading process.
-
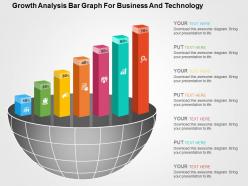 Growth analysis bar graph for business and technology flat powerpoint design
High resolution Presentation slide comes with great picture quality. Download is fast which saves time as well as effort. Customize it by inserting corporation name and logo. Display in both Standard and Widescreen format. Totally responsive and works well with Google slides. Download PPT design to insert text and share. PowerPoint template comes with creative and professional approach. Presentation graphic comes with great pixel quality which ensures better experience for the audience.
-
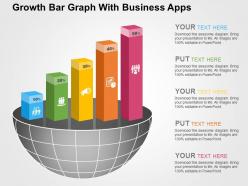 Growth bar graph with business apps flat powerpoint design
We are proud to present our growth bar graph with business apps flat powerpoint design. Graphic of bar graph and business apps has been used to craft this power point template diagram. This PPT diagram contains the concept of growth analysis. Use this PPT diagram for business and marketing related presentations.
-
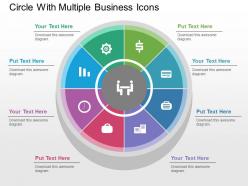 Circle with multiple business icons flat powerpoint design
We are proud to present our circle with multiple business icons flat powerpoint design. Graphic of circle and multiple business icons has been used to craft this power point template diagram. This PPT diagram contains the concept of business data representation. Use this PPT diagram for business and finance related presentations.
-
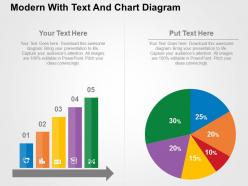 Modern with text and chart diagram flat powerpoint design
PowerPoint slides effortlessly coordinate with Google slides. Vertical bars and pie chart can have customised colors according to liking. High resolution PPT graphics leave no scope for pixilation on bigger and wider screens. Useful for data analysts, students and consumer-based companies. Amendable PPT layouts gives pin point control to the user. Supporting variety of software's, presentation design can be transformed into JPG and PDF easily.
-
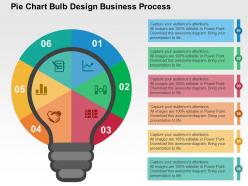 Pie chart bulb design business process flat powerpoint design
We are proud to present our pie chart bulb design business process flat powerpoint design. This power point template diagram has been crafted with graphic of pie chart and bulb design. This PPT diagram contains the concept of business process and idea representation. Use this PPT diagram for business and marketing related presentations.
-
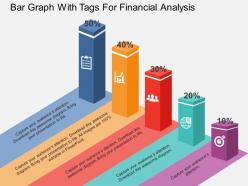 Bar graph with tags for financial analysis flat powerpoint design
Skillfully crafted bar graph with financial analysis PowerPoint slide. Amendable color, text, layout as per the preference and industry requirement. PPT illustration accessible in standard and widescreen display view. Quick download and easy to alter into other formats available such as JPG and PDF. Access to add business information i.e. name, sign, logo etc.
-
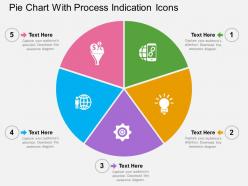 Pie chart with process indication icons flat powerpoint design
We are proud to present our pie chart with process indication icons flat powerpoint design. Graphic of pie chart and icons has been used to design this power point template diagram. This PPT diagram contains the concept of result analysis and process flow. Use this PPT diagram for business and marketing related presentations.
-
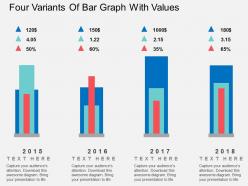 Four variants of bar graph with values flat powerpoint design
We are proud to present our four variants of bar graph with values flat powerpoint design. Graphic of four variants of bar graph with values has been used to craft this power point template diagram. This PPT diagram contains the concept of result analysis. Use this PPT diagram for business and marketing result related presentations.
-
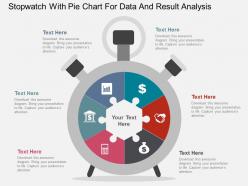 Stopwatch with pie chart for data and result analysis flat powerpoint design
Basic theme yet it can modified with respect to font, color and layout. Attractive and professional color scheme. PPT graphic offers font size which can be read from a distance. High resolution is offered by the presentation slide show. Easy to download and instant use of pre designed PPT layout adds to its advantage. High color resolution offered by PPT. PPT layout is beneficial for businessmen, project managers for business and managerial purposes.
-
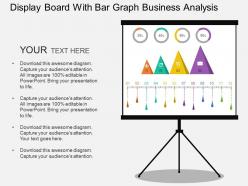 Display board with bar graph business analysis flat powerpoint design
We are proud to present our display board with bar graph business analysis flat powerpoint design. This power point template diagram has been crafted with graphic of display board and bar graph. This PPT diagram contains the concept of business analysis. Use this PPT diagram for business and marketing related presentations.
-
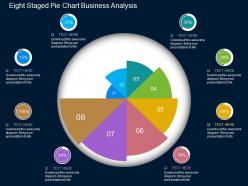 Eight staged pie chart business analysis flat powerpoint design
We are proud to present our eight staged pie chart business analysis flat powerpoint design. Eight staged pie chart has been used to craft this power point template diagram. This PPT diagram contains the concept of business analysis. Use this PPT diagram for business and marketing related presentations.
-
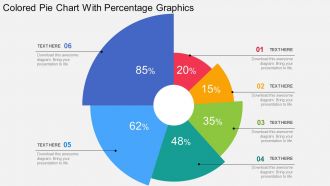 Colored pie chart with percentage graphics flat powerpoint design
We are proud to present our colored pie chart with percentage graphics flat powerpoint design. Graphic of colored pie chart has been used to craft this power point template diagram. This PPT diagram contains the concept of financial analysis. Use this PPT diagram for business and finance related presentations.
-
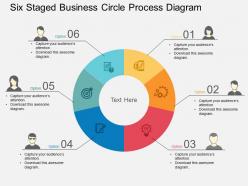 Six staged business circle process diagram flat powerpoint design
We are proud to present our six staged business circle process diagram flat powerpoint design. Six staged business circle process diagram has been used to craft this power point diagram. This PPT diagram contains the concept of process flow. Use this PPT diagram for business and marketing related presentations.
-
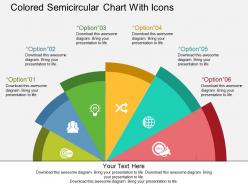 Colored semicircular chart with icons flat powerpoint design
We are proud to present our colored semicircular chart with icons flat powerpoint design. This power point template diagram has been crafted with graphic of colored semicircular chart with icons .This PPT diagram contains the concept of result analysis. Use this PPT diagram for business and marketing related presentations.
-
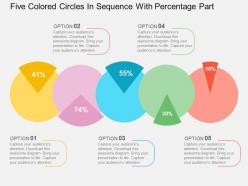 Five colored circles in sequence with percentage part flat powerpoint design
Adjustable PPT Slide with percentage values. Smoothly convertible into numerous format options such as JPG or PDF. Provides a professional outlook to your PowerPoint presentation. Customization of each PowerPoint graphic and text as per your industry requirement. Multiple display option such as standard and widescreen view. Freedom to customize it with company name and logo. PPT slides goes well with Google slides.
-
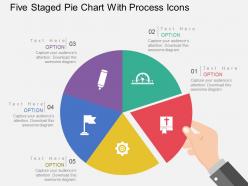 Five staged pie chart with process icons flat powerpoint design
We are proud to present our five staged pie chart with process icons flat powerpoint design. Five staged pie chart with process icons has been used to design this power point template diagram. This PPT diagram contains the concept of result analysis. Use this PPT diagram for business and marketing related presentations.
-
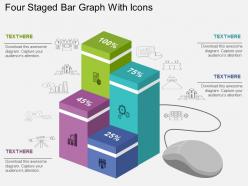 Four staged bar graph with icons flat powerpoint design
We are proud to present our four staged bar graph with icons flat powerpoint design. Four staged bar graph with icons has been used to design this power point template diagram. This PPT diagram contains the concept of result analysis representation. Use this PPT diagram for business and marketing related presentations.
-
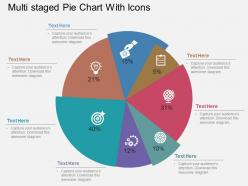 Multi staged pie chart with icons flat powerpoint design
We are proud to present our multi staged pie chart with icons flat powerpoint design. This power point template diagram has been crafted with graphic of multistage pie chart with icons. This PPT diagram contains the concept of result analysis. Use this PPT diagram and build a quality presentation for related topics.
-
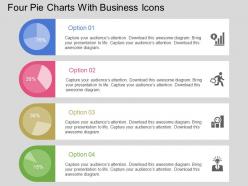 Four Pie Charts With Business Icons Flat Powerpoint Design
Presenting four pie charts with business icons flat PowerPoint template. Slides can be viewed in wide screens for more clear vision. PowerPoint slides are well-matched with Google slides. Fully editable PPT template as can be edited as required. Download is quick and saving is possible. Easy to convert into Jpeg and Pdf document. Perfect for business professionals and managers. They propose the information precisely without any confusions. They can be converted to different formats. They are result and technology oriented.
-
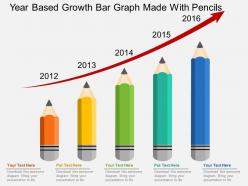 Year based growth bar graph made with pencils flat powerpoint design
We are proud to present our year based growth bar graph made with pencils flat powerpoint design. This power point template diagram has been crafted with graphic of year based growth bar graph made of pencils. This PPT diagram contains the concept of growth representation. Use this PPT diagram for business and finance related presentations and get good remarks.
-
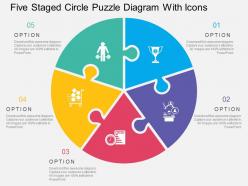 Five staged circle puzzle diagram with icons flat powerpoint design
Businessmen, micro, small and medium enterprises can use the PPT visual as a master slide. PowerPoint presentation supports filling background in a different color from the text. All images are 100% editable in the presentation slide. Text can be differentiated form the background by the handy features provided by PPT layout. There is no space constrain in the PowerPoint slide, thus enabling easy addition or edition of data.
-
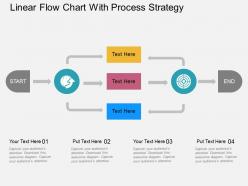 Linear flow chart with process strategy flat powerpoint design
We are proud to present our linear flow chart with process strategy flat powerpoint design. Graphic of linear flow chart has been used to craft this power point template diagram. This PPT diagram contains the concept of process strategy representation. Use this PPT diagram for business and marketing related presentations.
-
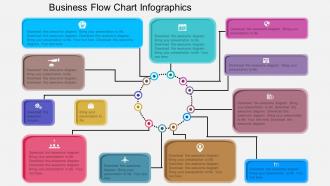 Business flow chart infographics flat powerpoint desgin
Images quality don't pixelate when anticipated on wide screen. PPT designs go perfect with Google slides. Straightforward and quick to incorporate titles and sub titles. Changeable slides graphics, colors, font size and style, and concept as per necessities. Layouts can be effectively changed over into PDF or JPG positions. Unique affirmation PowerPoint slides outlines. Ideal for business affiliation gathering, specialists, authorities, marketing experts, IT affiliations, lenders, merchants, brokers, promoters, business people, and pioneers.
-
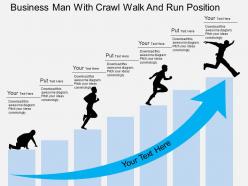 Pd business man with crawl walk and run position flat powerpoint design
Visually stunning PPT presentation illustrations. Offers thousands of icons and numerous colours to alter the appearance. Beneficial for the organisations, investors, clients and customers. Capable of enhancing the image and profits of the enterprise. Completely professional look and feel. 100% modifiable as per the needs of the user.
-
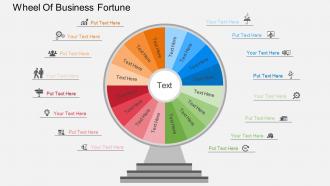 Cw wheel of business fortune flat powerpoint design
Beautifully crafted Presentation illustration. Hundred percent editable slide graphics. Opportunity to modify the content as per the industry need. Simplicity of personalization with your organization name and logo. Perfect with wide assortment of organization alternatives. PPT diagram can be downloaded easily and transform into JPG and PDF format. Choice to access similar designs comes with different nodes and stages.
-
 Rc globe with arrows business management flat powerpoint design
Presenting rc globe with arrows business management flat powerpoint design. Graphic of globe and arrows has been used to craft this power point template diagram. This PPT diagram contains the concept of business management. Use this PPT diagram for business and management related presentations.
-
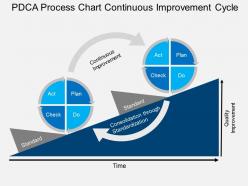 Sy pdca process chart continuous improvement cycle flat powerpoint design
High-quality PPT presentation slides that will live up to your and the viewer’s expectation. Enables easy understanding and memorising of the displayed information. Well matched framework with google slides. Easy to operate and to customize without any hurdles. Performance and result oriented PowerPoint presentation templates. Extremely versatile and adaptable backgrounds.
-
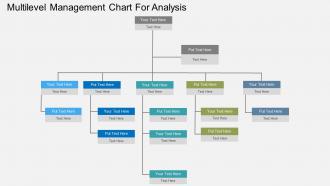 Bd multilevel management chart for analysis flat powerpoint design
Use of high-resolution images in the slide icons. Compatible with the Google Slides or MS Office PowerPoint programs. Easy to edit and download. Trouble-free replacement of your company’s logo. Access to open on a big screen display. Provided instructions to edit and modify the slide icon. Beneficial for the marketing professionals and the business managers.
-
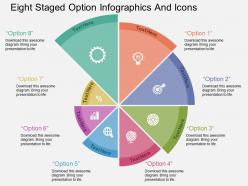 Gi eight staged option infographics and icons flat powerpoint design
Presenting gi eight staged option infographics and icons flat powerpoint design. Eight staged option info graphics and icons has been used to design this power point template diagram. This PPT diagram contains concept business information representations . Use this PPT diagram for business and management related presentations.
-
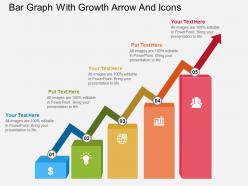 Ac bar graph with growth arrow and icons flat powerpoint design
Presenting ac bar graph with growth arrow and icons flat powerpoint design. This Power Point template diagram has been crafted with graphic of bar graph and growth arrow .This PPT diagram contains the concept of result analysis and process flow. Use this PPT diagram for business and marketing related presentations.
-
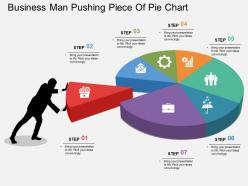 Al business man pushing piece of pie chart flat powerpoint design
Presenting al business man pushing piece of pie chart flat powerpoint design. This Power Point template diagram has been crafted with graphic of business man and pie chart diagram. This PPT diagram contains the concept of business result analysis representation. Use this PPT diagram for business and marketing related presentations.
-
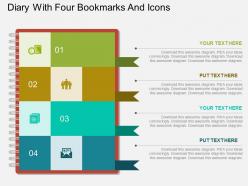 At diary with four bookmarks and icons flat powerpoint design
Presenting at diary with four bookmarks and icons flat powerpoint design. This Power Point template diagram has been crafted with graphic of diary and four book marks diagram. This PPT diagram contains the concept of data representation. Use this PPT diagram for business and finance related presentations.
-
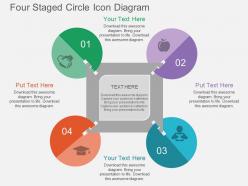 Bl four staged circle icon diagram flat powerpoint design
Presenting bl four staged circle icon diagram flat powerpoint design. Four staged icons diagram has been used to design Power Point template diagram. This PPT diagram contains the concept of process flow representation. Use this PPT diagram for business and marketing related presentations.
-
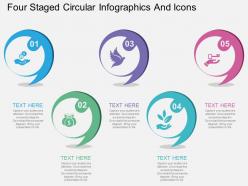 Bn four staged circular infographics and icons flat powerpoint design
Presenting bn four staged circular infographics and icons flat powerpoint design. Four staged circular info graphics diagram has been used to design Power Point template diagram. This PPT diagram contains the concept of business process flow representation. Use this PPT diagram for business and marketing related presentations.
-
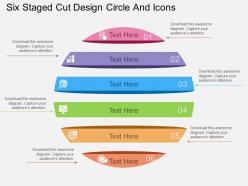 Bu six staged cut design circle and icons flat powerpoint design
Presenting bu six staged cut design circle and icons flat powerpoint design. Six staged cut design circle diagram has been used to design Power Point template diagram. This PPT diagram contains the concept of process flow representation. Use this PPT diagram for business and marketing related presentations.
-
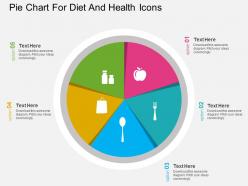 Ln pie chart for diet and health icons flat powerpoint design
Presenting ln pie chart for diet and health icons flat powerpoint design. This Power Point template diagram has been crafted with graphic of pie chart and icons diagram. This PPT diagram contains the concept of business result analysis. Use this PPT diagram for business and marketing related presentations.
-
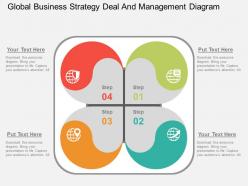 Ig global business strategy deal and management diagram flat powerpoint design
Presenting ig global business strategy deal and management diagram flat powerpoint design. This Power Point template diagram has been crafted with graphic of globe and business deal. This PPT diagram contains the concept of global business strategy and deal management .Use this PPT diagram for business and marketing related presentations.
-
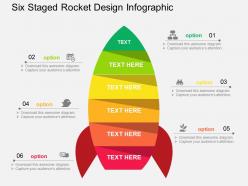 Ip six staged socket design infographcis flat powerpoint design
Presenting ip six staged socket design infographcis flat powerpoint design. Six staged socket design info graphics diagram and icons has been used to craft this power point template diagram. This PPT diagram contains the concept of business data and strategy representation. Use this PPT diagram for business and marketing related presentations.
-
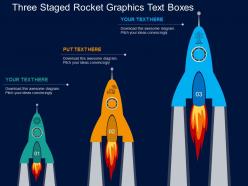 Is three staged rocket graphics text boxes flat powerpoint design
Presenting is three staged rocket graphics text boxes flat powerpoint design. Three staged rocket graphic text boxes has been used to craft this power point template diagram. This PPT diagram contains the concept of business data and process flow representation. Use this PPT diagram for business and marketing related presentations.
-
Excellent design and quick turnaround.
-
Content of slide is easy to understand and edit.
-
Informative design.
-
Editable templates with innovative design and color combination.
-
Out of the box and creative design.
-
It saves your time and decrease your efforts in half.
-
Professional and unique presentations.
-
Great product with highly impressive and engaging designs.
-
Understandable and informative presentation.
-
Easy to edit slides with easy to understand instructions.


