Charts, Graphs PowerPoint Designs, Presentation Charts Designs & PPT Graphics
- Sub Categories
-
- Arrows and Targets
- Bullet and Text Slides
- Charts and Graphs
- Circular Cycle Diagrams
- Concepts and Shapes
- Custom Flat Designs
- Dashboards and Measuring
- Flow Process
- Funnels
- Gears
- Growth
- Harvey Balls
- Idea Innovation and Light Bulbs
- Leadership
- Linear Process Diagrams
- Magnifying Glass
- Misc Other Graphics
- Opportunity and Handshake
- Organization Charts
- Puzzles
- Pyramids
- Roadmaps and Timelines
- Silhouettes
- Steps
- Strategic Planning Analysis
- SWOT Analysis
- Tables and Matrix
- Teamwork
- Technology and Communication
- Venn Diagrams
- Visuals and Illustrations
-
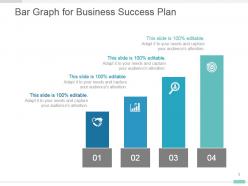 Bar graph for business success plan presentation diagram
Presenting bar graph for business success plan presentation diagram. This is a bar graph for business success plan presentation diagram. This is a four stage process. The stages in this process are icons, business, marketing, management, presentation.
-
 Multiple work locations with maps powerpoint sample design
Presenting multiple work locations with maps powerpoint sample design. This is a multiple work locations with maps powerpoint sample design. This is a four stage process. The stages in this process are technology, business, location, communication, success.
-
 Business plan management summary powerpoint guide
Presenting business plan management summary powerpoint guide. This is a business plan management summary powerpoint guide. This is a eight stage process. The stages in this process are market revenue, average price per unit industrial cameras, average price per unit frame grabbers, market size for last year of study period, base year market growth rate, compound annual growth rate, degree of technical change, market concentration.
-
 Competitive analysis report on key success factors powerpoint layout
Presenting competitive analysis report on key success factors powerpoint layout. This is a competitive analysis report on key success factors powerpoint layout. This is a six stage process. The stages in this process are key industry success factors, extensive distribution, customer focus, economies of scale, product innovation, weighting, competitor rating.
-
 Competitive analysis report powerpoint presentation
Presenting competitive analysis report powerpoint presentation. This is a competitive analysis report powerpoint presentation. This is a eight stage process. The stages in this process are business, marketing, finance, strategy, analysis.
-
 Competitor analysis tools powerpoint shapes
Presenting competitor analysis tools powerpoint shapes. This is a competitor analysis tools powerpoint shapes. This is a six stage process. The stages in this process are revenue, profit, market share, main activity, number of employee, product quality.
-
 Maps for growth opportunity for large business powerpoint slide deck template
Presenting maps for growth opportunity for large business powerpoint slide deck template. This is a maps for growth opportunity for large business powerpoint slide deck template. This is a three stage process. The stages in this process are middle east and africa, asia pacific, the united states.
-
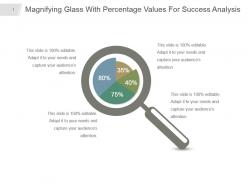 Magnifying glass with percentage values for success analysis presentation visual
Presenting magnifying glass with percentage values for success analysis presentation visual. This is a magnifying glass with percentage values for success analysis presentation visual. This is a one stage process. The stages in this process are percentage, glass, magnify, glass, finance, research.
-
 Campaign performance ppt icon
Presenting campaign performance ppt icon. Presenting campaign performance ppt icon. This is a campaign performance ppt icon. This is a two stage process. The stages in this process are leads, brand, sales, loyalty.
-
 Core strategic audience powerpoint slide clipart
Presenting core strategic audience powerpoint slide clipart. Presenting core strategic audience powerpoint slide clipart. This is a core strategic audience powerpoint slide clipart. This is a seven stage process. The stages in this process are business, finance, process, strategy, marketing.
-
 Media budget sample ppt presentation
Presenting media budget sample ppt presentation. Presenting media budget sample ppt presentation. This is a media budget sample ppt presentation. This is a five stage process. The stages in this process are business, finance, process, strategy, marketing, management.
-
 Spending direction considerations powerpoint guide
Presenting spending direction considerations powerpoint guide. Presenting spending direction considerations powerpoint guide. This is a spending direction considerations powerpoint guide. This is a four stage process. The stages in this process are digital video, mobile video, advanced tv, broadcast.
-
 Agency performance powerpoint layout
Presenting agency performance powerpoint layout. This is a agency performance powerpoint layout. This is a four stage process. The stages in this process are tra score, ad fraud, viewability, brand safety, industry snapshot.
-
 Campaign performance powerpoint graphics
Presenting campaign performance powerpoint graphics. This is a campaign performance powerpoint graphics. This is a four stage process. The stages in this process are brand, leads, sales, loyalty.
-
 Core strategic audience ppt example file
Presenting core strategic audience ppt example file. This is a core strategic audience ppt example file. This is a seven stage process. The stages in this process are finance, business, success, marketing, strategy.
-
 Media budget ppt example
Presenting media budget ppt example. This is a media budget ppt example. This is a five stage process. The stages in this process are finance, donut, business, success, marketing, strategy.
-
 Spending direction considerations powerpoint slide
Presenting spending direction considerations powerpoint slide. This is a spending direction considerations powerpoint slide. This is a four stage process. The stages in this process are digital video, mobile video, advanced tv, broadcast.
-
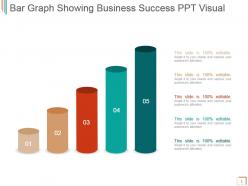 Bar graph showing business success ppt visual
Presenting bar graph showing business success ppt visual. This is a bar graph showing business success ppt visual. This is a five stage process. The stages in this process are business, success, marketing, management, strategy.
-
 Calculate market share of competitors powerpoint ideas
Presenting calculate market share of competitors powerpoint ideas. This is a calculate market share of competitors powerpoint ideas. This is a six stage process. The stages in this process are in percentage, competitor.
-
 Competitor analysis framework powerpoint presentation templates
Presenting competitor analysis framework powerpoint presentation templates. This is a competitor analysis framework powerpoint presentation templates. This is a five stage process. The stages in this process are revenue, profit, in percentage, competitor.
-
 Cost industry graph powerpoint slide background image
Presenting cost industry graph powerpoint slide background image. This is a cost industry graph powerpoint slide background image. This is a ten stage process. The stages in this process are cost item, material cost, power and fuel cost, employee cost, other manufacturing expenses, selling expenses, interest and finance costs, depreciation, tax, operating profit margins, net profit margins, percentage.
-
 Market size calculation and forecasting powerpoint slide design ideas
Presenting market size calculation and forecasting powerpoint slide design ideas. This is a market size calculation and forecasting powerpoint slide design ideas. This is a eight stage process. The stages in this process are market size rmb, growth rate, market size.
-
 Market trends analysis powerpoint slide design templates
Presenting market trends analysis powerpoint slide design templates. This is a market trends analysis powerpoint slide design templates. This is a seven stage process. The stages in this process are rest of word, us, asia pacific, europe, japan, canada, latin america.
-
 Market trends report in marketing plan powerpoint slide designs
Presenting market trends report in marketing plan powerpoint slide designs. This is a market trends report in marketing plan powerpoint slide designs. This is a seven stage process. The stages in this process are africa, middle east, latin america, eastern europe, north america, asia, western europe, in percentage.
-
 Market trends review for business plan powerpoint slide designs
Presenting market trends review for business plan powerpoint slide designs. This is a market trends review for business plan powerpoint slide designs. This is a two stage process. The stages in this process are market projected to reach us 1 1 trillion by 2020, in trillion, asia pacific the largest market.
-
 Pie chart to show total sales of a company powerpoint slide designs download
Presenting pie chart to show total sales of a company powerpoint slide designs download. This is a pie chart to show total sales of a company powerpoint slide designs download. This is a seven stage process. The stages in this process are depreciation, other, profit, marketing, wages, purchases, rent and utilities.
-
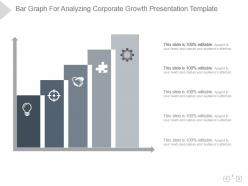 Bar graph for analyzing corporate growth presentation template
Presenting bar graph for analyzing corporate growth presentation template. Presenting bar graph for analyzing corporate growth presentation template. This is a bar graph for analyzing corporate growth presentation template. This is a five stage process. The stages in this process are bar graph, analyzing, corporate, growth, presentation, strategy.
-
 Brand engagement powerpoint presentation example slides
Presenting brand engagement powerpoint presentation example slides. This is a brand engagement powerpoint presentation example slides. This is a four stage process. The stages in this process are engagement, monthly, weekly, brand.
-
 Corporate growth over the years presentation graphic visual
Presenting corporate growth over the years presentation graphic visual. This is a corporate growth over the years presentation graphic visual. This is a five stage process. The stages in this process are graph, success, business, marketing, growth.
-
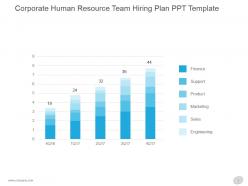 Corporate human resource team hiring plan ppt template
Presenting corporate human resource team hiring plan ppt template. This is a corporate human resource team hiring plan ppt template. This is a five stage process. The stages in this process are finance, support, product, marketing, sales, engineering.
-
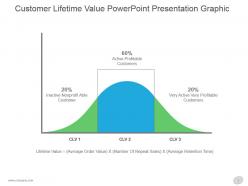 Customer lifetime value powerpoint presentation graphic
Presenting customer lifetime value powerpoint presentation graphic. This is a customer lifetime value powerpoint presentation graphic. This is a three stage process. The stages in this process are clv, lifetime value average order value number of repeat sales average retention time, inactive non profitable customer, active profitable customers, very active very profitable customers.
-
 Graphical representation for total business revenue presentation layout
Presenting graphical representation for total business revenue presentation layout. This is a graphical representation for total business revenue presentation layout. This is a nine stage process. The stages in this process are graph, success, business, marketing, growth, management.
-
 Gross margin improvement powerpoint presentation diagram
Presenting gross margin improvement powerpoint presentation diagram. This is a gross margin improvement powerpoint presentation diagram. This is a two stage process. The stages in this process are chart title, q.
-
 Pie chart data representation for operating expense presentation slide
Presenting pie chart data representation for operating expense presentation slide. This is a pie chart data representation for operating expense presentation slide. This is a seven stage process. The stages in this process are business, marketing, pie, circle, piece.
-
 Pie chart for evaluating business success powerpoint template
Presenting pie chart for evaluating business success powerpoint template. This is a pie chart for evaluating business success powerpoint template. This is a four stage process. The stages in this process are marketing, pie, circle, success, business.
-
 Pie chart for revenue generated from different sources ppt design
Presenting pie chart for revenue generated from different sources ppt design. This is a pie chart for revenue generated from different sources ppt design. This is a four stage process. The stages in this process are business, marketing, pie, circle, piece.
-
 Actual versus target revenue setting strategic goals example of ppt
Presenting actual versus target revenue setting strategic goals example of ppt. This is a actual versus target revenue setting strategic goals example of ppt. This is a two stage process. The stages in this process are actual, target, actual vs target value.
-
 Company sales and performance dashboard powerpoint layout
Presenting company sales and performance dashboard powerpoint layout. This is a company sales and performance dashboard powerpoint layout. This is a four stage process. The stages in this process are business, marketing, graph, growth, years.
-
 Recruitment plan for hr department ppt examples
Presenting recruitment plan for hr department ppt examples. This is a recruitment plan for hr department ppt examples. This is a five stage process. The stages in this process are engineering, sales, marketing, product, support, finance.
-
 Bar graph to showcase financial analysis powerpoint ideas
Presenting bar graph to showcase financial analysis powerpoint ideas. This is a bar graph to showcase financial analysis powerpoint ideas. This is a four stage process. The stages in this process are arrow, financial, analysis, marketing, strategy, business.
-
 Competitor analysis overview powerpoint slide background
Presenting competitor analysis overview powerpoint slide background. This is a competitor analysis overview powerpoint slide background. This is a nine stage process. The stages in this process are number of competitors, number of companies that exited, number companies that entered, replacement rate industrial cameras, replacement rate frame grabbers, average product development time industrial cameras, average product development time frame grabbers, r and d spend as a per cent of market revenue, marketing spend as a per cent of market revenue.
-
 Competitors analysis report powerpoint slide background picture
Presenting competitors analysis report powerpoint slide background picture. This is a competitors analysis report powerpoint slide background picture. This is a seven stage process. The stages in this process are revenue, profit, market share, main activity, number of employee, product quality, insert your own text.
-
 Management cost structure report powerpoint slide design templates
Presenting management cost structure report powerpoint slide design templates. This is a management cost structure report powerpoint slide design templates. This is a two stage process. The stages in this process are cost item, material cost, power and fuel cost, employee cost, other manufacturing expenses, selling expenses, interest and finance costs, depreciation, tax, operating profit margins, net profit margins.
-
 Market overview business plan powerpoint slide designs download
Presenting market overview business plan powerpoint slide designs download. This is a market overview business plan powerpoint slide designs download. This is a five stage process. The stages in this process are market stage, market revenue, average price per unit industrial cameras, average price per unit frame grabbers, market size for last year of study period, base year market growth rate, compound annual growth rate, customer price sensitivity, degree of technical change, market concentration, decreasing, stable, increasing.
-
 Competitor analysis chart powerpoint layout
Presenting competitor analysis chart powerpoint layout. This is a competitor analysis chart powerpoint layout. This is a five stage process. The stages in this process are revenue, profit, market share, main activity, number of employee, product quality.
-
 Competitor analysis overview powerpoint show
Presenting competitor analysis overview powerpoint show. This is a competitor analysis overview powerpoint show. This is a eight stage process. The stages in this process are market revenue, average price per unit industrial cameras, average price per unit frame grabbers, market size for last year of study period, base year market growth rate, compound annual growth rate, degree of technical change, market concentration.
-
 Competitors analysis report on key success factors powerpoint topics
Presenting competitors analysis report on key success factors powerpoint topics. This is a competitors analysis report on key success factors powerpoint topics. This is a five stage process. The stages in this process are extensive distribution, customer focus, economies of scale, product innovation.
-
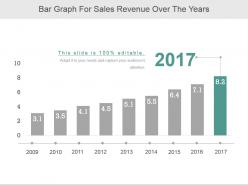 Bar graph for sales revenue over the years
Presenting bar graph for sales revenue over the years. This is a bar graph for sales revenue over the years. This is a nine stage process. The stages in this process are business, marketing, growth, bar, years.
-
 Sales growth bar graph powerpoint templates
Presenting sales growth bar graph powerpoint templates. This is a sales growth bar graph powerpoint templates. This is a five stage process. The stages in this process are growth, business, marketing, arrows, management.
-
 Bar graph to highlight financial growth good ppt example
Presenting bar graph to highlight financial growth good ppt example. This is a bar graph to highlight financial growth good ppt example. This is a five stage process. The stages in this process are business, bar graph, finance, marketing, growth, strategy, success.
-
 Company sales by product ppt slide
Presenting company sales by product ppt slide. This is a company sales by product ppt slide. This is a two stage process. The stages in this process are cycle time by month.
-
 Graphical presentation of control chart ppt sample
Presenting graphical presentation of control chart ppt sample. This is a graphical presentation of control chart ppt sample. This is a three stage process. The stages in this process are upper limit, centerline, plotted points, lower limit, plot scale.
-
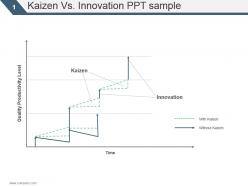 Kaizen vs innovation ppt sample
Presenting kaizen vs innovation ppt sample. This is a kaizen vs innovation ppt sample. This is a three stage process. The stages in this process are quality productivity level, kaizen, innovation, without kaizen, with kaizen.
-
 Steps in pdca cycle ppt slide
Presenting steps in pdca cycle ppt slide. This is a steps in pdca cycle ppt slide. This is a four stage process. The stages in this process are plan, do, check, act, pdca.
-
 Histograms powerpoint chart ppt slide
Presenting histograms powerpoint chart ppt slide. This is a histograms powerpoint chart ppt slide. This is a five stage process. The stages in this process are data collection histograms, histogram, profit in thousands.
-
 Data collection scatter diagram ppt example
Presenting data collection scatter diagram ppt example. This is a data collection scatter diagram ppt example. This is a one stage process. The stages in this process are dollar, profit in thousands.
-
 Analysis techniques pareto analysis ppt sample
Presenting analysis techniques pareto analysis ppt sample. This is a analysis techniques pareto analysis ppt sample. This is a five stage process. The stages in this process are analysis techniques pareto analysis.
-
 Customer demographic comparison powerpoint slide deck template
Presenting customer demographic comparison powerpoint slide deck template. Presenting customer demographic comparison powerpoint slide deck template. Presenting customer demographic comparison powerpoint slide deck template. Presenting customer demographic comparison powerpoint slide deck template. This is a customer demographic comparison powerpoint slide deck template. This is a two stage process. The stages in this process are business, success, finance, people, our team, compare.
-
 Sales tracking dashboard powerpoint slide designs download
Presenting sales tracking dashboard powerpoint slide designs download. Presenting sales tracking dashboard powerpoint slide designs download. Presenting sales tracking dashboard powerpoint slide designs download. Presenting sales tracking dashboard powerpoint slide designs download. This is a sales tracking dashboard powerpoint slide designs download. This is a three stage process. The stages in this process are business, dashboard, strategy, marketing, management, presentation.
-
 Campaign performance dashboard snapshot powerpoint layout
Presenting campaign performance dashboard snapshot powerpoint layout. This is a campaign performance dashboard powerpoint layout. This is a two stage process. The stages in this process are brand, leads, sales, loyalty.
-
Use of different colors is good. It's simple and attractive.
-
Illustrative design with editable content. Exceptional value for money. Highly pleased with the product.
-
It saves your time and decrease your efforts in half.
-
Excellent Designs.
-
Design layout is very impressive.
-
Innovative and Colorful designs.
-
Content of slide is easy to understand and edit.
-
Top Quality presentations that are easily editable.
-
Good research work and creative work done on every template.
-
Great product with highly impressive and engaging designs.


