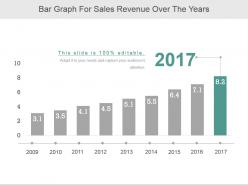
Bar graph for sales revenue over the years
Our Bar Graph For Sales Revenue Over The Years follow a customized display. Get every detail displayed as you desire.
You must be logged in to download this presentation.
 Impress your
 audience
Editable
of Time
PowerPoint presentation slides
Presenting bar graph for sales revenue over the years. This is a bar graph for sales revenue over the years. This is a nine stage process. The stages in this process are business, marketing, growth, bar, years.
People who downloaded this PowerPoint presentation also viewed the following :
Bar graph for sales revenue over the years with all 5 slides:
Our Bar Graph For Sales Revenue Over The Years are available at hand. All eager and alert to give any assistance.
-
Much better than the original! Thanks for the quick turnaround.
-
Innovative and attractive designs.


