Charts, Graphs PowerPoint Designs, Presentation Charts Designs & PPT Graphics
- Sub Categories
-
- Arrows and Targets
- Bullet and Text Slides
- Charts and Graphs
- Circular Cycle Diagrams
- Concepts and Shapes
- Custom Flat Designs
- Dashboards and Measuring
- Flow Process
- Funnels
- Gears
- Growth
- Harvey Balls
- Idea Innovation and Light Bulbs
- Leadership
- Linear Process Diagrams
- Magnifying Glass
- Misc Other Graphics
- Opportunity and Handshake
- Organization Charts
- Puzzles
- Pyramids
- Roadmaps and Timelines
- Silhouettes
- Steps
- Strategic Planning Analysis
- SWOT Analysis
- Tables and Matrix
- Teamwork
- Technology and Communication
- Venn Diagrams
- Visuals and Illustrations
-
 Product sales analysis report ppt presentation examples
Presenting product sales analysis report ppt presentation examples. This is a product sales analysis report ppt presentation examples. This is a five stage process. The stages in this process are analysis, business, marketing, strategy, success, management, growth.
-
 Quality control and quality assurance differentiation ppt slide
Presenting quality control and quality assurance differentiation ppt slide. This is a quality control and quality assurance differentiation ppt slide. This is a two stage process. The stages in this process are quality control, inspection, production process, production process, check quality, quality assurance, prevention.
-
 Quality cost analysis ppt infographic template
Presenting quality cost analysis ppt infographic template. This is a quality cost analysis ppt infographic template. This is a three stage process. The stages in this process are total cost of quality, cost of good quality, poor quality, prevention, appraisal, internal failure, external failure.
-
 Quality management ethics ppt images gallery
Presenting quality management ethics ppt images gallery. This is a quality management ethics ppt images gallery. This is a four stage process. The stages in this process are defective products, substandard service, poor designs, substandard, substandard parts and materials in the boxes.
-
 System access to management powerpoint shapes
Presenting system access to management powerpoint shapes. This is a system access to management powerpoint shapes. This is a five stage process. The stages in this process are business, management, analysis, strategy, success, process.
-
 Quality costs and productivity powerpoint slide deck template
Presenting quality costs and productivity powerpoint slide deck template. This is a quality costs and productivity powerpoint slide deck template. This is a four stage process. The stages in this process are external failure, internal failure, prevention, appraisal.
-
 Bar graph to show company sales budget example of ppt
Presenting bar graph to show company sales budget example of ppt. This is a bar graph to show company sales budget example of ppt. This is a four stage process. The stages in this process are business, arrows, growth, marketing, success.
-
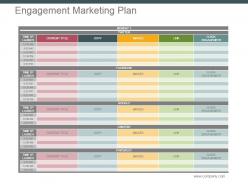 Engagement marketing plan powerpoint slide designs download
Presenting engagement marketing plan powerpoint slide designs download. This is a engagement marketing plan powerpoint slide designs download. This is a four stage process. The stages in this process are monday, twitter, time of launch, content title, copy, images, link, click engagement, facebook, google, linkedin, pinterest.
-
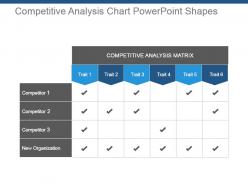 Competitive analysis chart powerpoint shapes
Presenting competitive analysis chart powerpoint shapes. This is a competitive analysis chart powerpoint shapes. This is a six stage process. The stages in this process are competitive analysis matrix, trait, new organization, competitor.
-
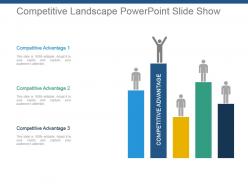 Competitive landscape powerpoint slide show
Presenting competitive landscape powerpoint slide show. This is a competitive landscape powerpoint slide show. This is a five stage process. The stages in this process are competitive advantage.
-
 Digital marketing business plan ppt background designs
Presenting digital marketing business plan ppt background designs. This is a digital marketing business plan ppt background designs. This is a four stage process. The stages in this process are campaign type, project goals, target audience, clicks response, notes, weight.
-
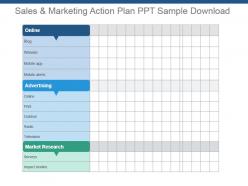 Sales and marketing action plan ppt sample download
Presenting sales and marketing action plan ppt sample download. This is a sales and marketing action plan ppt sample download. This is a three stage process. The stages in this process are online, advertising, market research.
-
 Sales and marketing activity plan ppt sample file
Presenting sales and marketing activity plan ppt sample file. This is a sales and marketing activity plan ppt sample file. This is a three stage process. The stages in this process are enter date of first monday each month, national marketing, local marketing, public relations, social media.
-
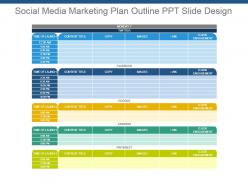 Social media marketing plan outline ppt slide design
Presenting social media marketing plan outline ppt slide design. This is a social media marketing plan outline ppt slide design. This is a five stage process. The stages in this process are twitter, facebook, google, linkedin, pinterest, time of launch, copy, images, link, click engagement.
-
 Tactical marketing action plan ppt slide show
Presenting tactical marketing action plan ppt slide show. This is a tactical marketing action plan ppt slide show. This is a six stage process. The stages in this process are task description, person dept responsible, cost per task, progress status, timeline status, comments.
-
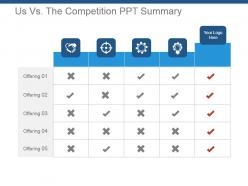 Us vs the competition ppt summary
Presenting us vs the competition ppt summary. This is a us vs the competition ppt summary. This is a five stage process. The stages in this process are your logo here, offering.
-
 Absenteeism rate in a company powerpoint graphics
Presenting absenteeism rate in a company powerpoint graphics. This is a absenteeism rate in a company powerpoint graphics. This is a two stage process. The stages in this process are absenteeism rate by days, days lost per employee per annum.
-
 Bar graph for rate of employee turnover example of ppt presentation
Presenting bar graph for rate of employee turnover example of ppt presentation. This is a bar graph for rate of employee turnover example of ppt presentation. This is a five stage process. The stages in this process are rate of turnover, voluntary, total.
-
 Competency rating of employees horizontal bar chart sample ppt presentation
Presenting competency rating of employees horizontal bar chart sample ppt presentation. This is a competency rating of employees horizontal bar chart sample ppt presentation. This is a eight stage process. The stages in this process are managerial efficiency, resource planning, develop and implements, financial accounting, financial analysis, financial planning, provides direction, directiveness.
-
 Cost per employee data driven line graph powerpoint templates
Presenting cost per employee data driven line graph powerpoint templates. This is a cost per employee data driven line graph powerpoint templates. This is a six stage process. The stages in this process are graph line, cost, employee, growth, success.
-
 Employee satisfaction survey results pie chart powerpoint presentation examples
Presenting employee satisfaction survey results pie chart powerpoint presentation examples. This is a employee satisfaction survey results pie chart powerpoint presentation examples. This is a four stage process. The stages in this process are employee satisfaction with workforce, satisfaction by income level.
-
 Employees hr metrics graph powerpoint images
Presenting employees hr metrics graph powerpoint images. This is a employees hr metrics graph powerpoint images. This is a five stage process. The stages in this process are below bachelor degree, bachelor degree, post graduate diploma, master degree, doctorate.
-
 Employees who leave within first 6 months powerpoint shapes
Presenting employees who leave within first 6 months powerpoint shapes. This is a employees who leave within first 6 months powerpoint shapes. This is a three stage process. The stages in this process are employees left job within the first 6 months, felt their boss was a jerk, work was different than they expected, changed their mind on work type.
-
 Horizontal bar chart for comparison powerpoint slide ideas
Presenting horizontal bar chart for comparison PPT slide. This presentation graph chart is fully editable in PowerPoint. You can customize the font type, font size, colors of the chart and background color as per your requirement. The slide is fully compatible with Google slides and can be saved in JPG or PDF format without any hassle. High quality graphics and icons ensure that there is no deteriorating in quality on enlarging their size. Have the tendency to boost the overall impression of your presentation.
-
 Hr dashboard editable powerpoint slide images
Stunning HR dashboard editable PPT slideshow. Loaded with incomparable benefits. Readymade PPT graphic helps in saving time and effort. Can be personalized by adding company trademark, logo, brand and symbols. Can be utilized for displaying both simple and complex information. Include or exclude slide content as per your individual need. Colors and text can be easily changed as the PPT slide is completely editable. Useful for every business leader and professional, project management team, business analysts, etc.
-
 Hr dashboard snapshot metrics powerpoint slide influencers
Presenting hr dashboard snapshot metrics powerpoint slide influencers. This is a hr dashboard metrics powerpoint slide influencers. This is a four stage process. The stages in this process are open positions by divisions, key metrics, total employees, employee churn.
-
 Managers training hours doughnut chart powerpoint slide
Presenting managers training hours doughnut chart powerpoint slide. This is a managers training hours doughnut chart powerpoint slide. This is a four stage process. The stages in this process are open positions by divisions, key metrics, total employees, employee churn.
-
 Profit per employee data driven line graph powerpoint slide background image
Presenting profit per employee data driven line graph powerpoint slide background image. This is a profit per employee data driven line graph powerpoint slide background image. This is a six stage process. The stages in this process are profit, employee, graph, line, growth.
-
 Revenue cost per employee comparison line graph powerpoint slide background picture
Presenting revenue cost per employee comparison line graph powerpoint slide background picture. This is a revenue cost per employee comparison line graph powerpoint slide background picture. This is a seven stage process. The stages in this process are company rpe, company ecpe.
-
 Revenue per employee ppt bar graph powerpoint slide background image
Presenting revenue per employee ppt bar graph powerpoint slide background image. This is a revenue per employee ppt bar graph powerpoint slide background image. This is a eight stage process. The stages in this process are annual revenue per employee, company revenue, revenue per employee, revenue, total number of employees.
-
 Speedometer dashboard for performance measurement powerpoint slide backgrounds
Presenting speedometer dashboard for performance measurement powerpoint slide backgrounds. This is a speedometer dashboard for performance measurement powerpoint slide backgrounds. This is a three stage process. The stages in this process are measure, meter, dashboard, speedometer, needle.
-
 Staff acquisition source horizontal bar chart powerpoint slide backgrounds
Presenting staff acquisition source horizontal bar chart powerpoint slide backgrounds. This is a staff acquisition source horizontal bar chart powerpoint slide backgrounds. This is a seven stage process. The stages in this process are campus interview, career fair, recruitment vendor, employee referral, web groups, job portals, print media.
-
 Training hours per employee powerpoint slide presentation tips
Presenting training hours per employee powerpoint slide presentation tips. This is a training hours per employee powerpoint slide presentation tips. This is a four stage process. The stages in this process are average training hours, sum of total training hours, total number of employees.
-
 Types of employee training provided doughnut chart powerpoint slide clipart
Presenting types of employee training provided doughnut chart powerpoint slide clipart. This is a types of employee training provided doughnut chart powerpoint slide clipart. This is a four stage process. The stages in this process are in person, hybrid, on-line, hands on.
-
 Why people leave an organization pie chart powerpoint slide deck samples
Presenting why people leave an organization pie chart powerpoint slide deck samples. This is a why people leave an organization pie chart powerpoint slide deck samples. This is a six stage process. The stages in this process are management general work environment, unsatisfied with pay and benefits, lack of fit to job, lack of job security, lack of flexibility scheduling, limited career advancement promotional opportunities.
-
 Workforce diversity by age group clustered bar chart powerpoint slide deck template
Presenting workforce diversity by age group clustered bar chart powerpoint slide deck template. This is a workforce diversity by age group clustered bar chart powerpoint slide deck template. This is a three stage process. The stages in this process are total workforce, male, female.
-
 Workforce diversity by gender powerpoint slide design ideas
Presenting workforce diversity by gender powerpoint slide design ideas. This is a workforce diversity by gender powerpoint slide design ideas. This is a two stage process. The stages in this process are male employees, female employees, new hires, left employment.
-
 Workforce diversity by region clustered bar graph powerpoint slide design templates
Presenting workforce diversity by region clustered bar graph powerpoint slide design templates. This is a workforce diversity by region clustered bar graph powerpoint slide design templates. This is a four stage process. The stages in this process are employees headcount, new employees hire, employees left job.
-
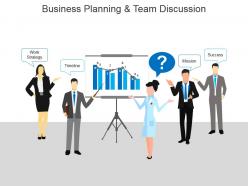 Business planning and team discussion powerpoint images
Presenting business planning and team discussion powerpoint images. This is a business planning and team discussion powerpoint images. This is a five stage process. The stages in this process are work strategy, timeline, mission, success.
-
 Market analysis dashboard powerpoint slide designs
Presenting market analysis dashboard powerpoint slide designs. This is a market analysis dashboard powerpoint slide designs. This is a two stage process. The stages in this process are stakeholders and market, business leverage, global contracts contract coverage, centralized resources, agility to execute, standard process to work globally, manage contract demand.
-
 Sales dashboard powerpoint slide show
Presenting sales dashboard powerpoint slide show. This is a sales dashboard powerpoint slide show. This is a two stage process. The stages in this process are customer retention, sales chart, yield from new and existing customers, business sales report.
-
 Value proposition in marketing powerpoint slides design
Presenting value proposition in marketing powerpoint slides design. This is a value proposition in marketing powerpoint slides design. This is a three stage process. The stages in this process are business relationships, competitors analysis, media marketing, category, series.
-
 Bar graph for showing continuous success example of ppt
Presenting bar graph for showing continuous success example of ppt. This is a bar graph for showing continuous success example of ppt. This is a five stage process. The stages in this process are growth, business, arrow, marketing, success.
-
 Bar graph with arrow for career planning ppt summary
Presenting bar graph with arrow for career planning ppt summary. This is a bar graph with arrow for career planning ppt summary. This is a six stage process. The stages in this process are business, finance, marketing, strategy, planning, success, arrow.
-
 Portfolio diversification with percentage and pie chart ppt design
Presenting portfolio diversification with percentage and pie chart ppt design. This is a portfolio diversification with percentage and pie chart ppt design. This is a four stage process. The stages in this process are pie, percentage, divide, chart, portfolio.
-
 4 metric dashboard of performance indicators example of ppt
Presenting 4 metric dashboard of performance indicators example of ppt. This is a 4 metric dashboard of performance indicators example of ppt. This is a four stage process. The stages in this process are dashboard, finance, percentage, business, marketing.
-
 Improving team dynamics skills pie chart ppt background
Presenting improving team dynamics skills pie chart ppt background. This is a improving team dynamics skills pie chart ppt background. This is a four stage process. The stages in this process are noticing when the group avoid a topic, sensing individuals feelings, recognizing and understanding the stages of team development, managing dysfunctional behaviors, sufficient do more, do less.
-
 Leaders performance comparison ppt design
Presenting leaders performance comparison ppt design. This is a leaders performance comparison ppt design. This is a two stage process. The stages in this process are marry smith ceo, miller bails marketing, customer focus, accountability, service excellence, problem solving, continuous improvement, collaborative conflict resolution.
-
 Male vs female employment statistics ppt design
Presenting male vs female employment statistics ppt design. This is a male vs female employment statistics ppt design. This is a two stage process. The stages in this process are women, men, executive, finance, human resource, marketing, operation, sales, people, part time staff, full time equivalent staff, median salary for, hours.
-
 Market growth and development bar graph ppt images
Presenting market growth and development bar graph ppt images. This is a market growth and development bar graph ppt images. This is a four stage process. The stages in this process are category, series.
-
 Pie chart showing sales team performance ppt examples slides
Presenting pie chart showing sales team performance ppt examples slides. This is a pie chart showing sales team performance ppt examples slides. This is a five stage process. The stages in this process are pie, percentage, communication, business, marketing.
-
 Team target and achievements bar graphs ppt slides
Presenting team target and achievements bar graphs ppt slides. This is a team target and achievements bar graphs ppt slides. This is a six stage process. The stages in this process are jan, feb, mar, apr, may, june, target, achievement.
-
 Absenteeism rate by days data driven bar graph powerpoint show
Presenting absenteeism rate by days data driven bar graph powerpoint show. This is a absenteeism rate by days data driven bar graph powerpoint show. This is a two stage process. The stages in this process are absenteeism rate by days, days lost per employee per annum, monday, tuesday, wednesday, thursday, friday, saturday.
-
 Age group diversity clustered bar graph
Presenting age group diversity clustered bar graph. This is a age group diversity clustered bar graph. This is a three stage process. The stages in this process are by age group, 1500 23 percent of total workforce male 33 percent female 62 percent, 2524 54 percent of total workforce male 40 percent female 60 percent, 2524 54 percent of total workforce male 40 percent female 60 percent, 955 30 percent of total workforce male 55 percent female 45 percent, male employee headcount total and percent, female employee headcount total and percent, new employee hires total and rate, employee who left employment total and rate.
-
 Average cost per employee ppt graph ppt background
Presenting average cost per employee ppt graph ppt background. This is a average cost per employee ppt graph ppt background. This is a six stage process. The stages in this process are average cost per employee, fy.
-
 Average profit per employee line graph ppt diagrams
Presenting average profit per employee line graph ppt diagrams. This is a average profit per employee line graph ppt diagrams. This is a six stage process. The stages in this process are average profit per employee.
-
 Average training hours per employee bar graph ppt design
Presenting average training hours per employee bar graph ppt design. This is a average training hours per employee bar graph ppt design. This is a four stage process. The stages in this process are training hours, average training hours, sum of total training hours, total of employees.
-
 Competency skills required and rating by hr ppt example 2017
Presenting competency skills required and rating by hr ppt example 2017. This is a competency skills required and rating by hr ppt example 2017. This is a eight stage process. The stages in this process are job related competencies, managerial efficiency, resourcing planning, develop and implement, financial accounting, financial analysis, financial planning, provides direction, directiveness.
-
 Cost per hire formula and bar chart ppt design templates
Presenting cost per hire formula and bar chart ppt design templates. This is a cost per hire formula and bar chart ppt design templates. This is a seven stage process. The stages in this process are cost per hire, campus interview, career fair, requirement vendor, employee referral, web groups, job portals, print media, cost per hire, recruitment cost, compensation cost benefits cost.
-
 Editable bar chart voluntary total employee turnover ppt icon
Presenting editable bar chart voluntary total employee turnover ppt icon. This is a editable bar chart voluntary total employee turnover ppt icon. This is a five stage process. The stages in this process are employee turnover, rate of turn over, voluntary, total.
-
Best Representation of topics, really appreciable.
-
Editable templates with innovative design and color combination.
-
Awesomely designed templates, Easy to understand.
-
Content of slide is easy to understand and edit.
-
Very well designed and informative templates.
-
Designs have enough space to add content.
-
Excellent template with unique design.
-
Unique design & color.
-
Innovative and attractive designs.
-
Great quality slides in rapid time.


