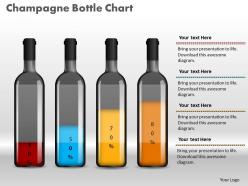
0414 percentage increase champagne bottle column chart powerpoint graph
To discover or track how well you performing and keep a track of future activities it is important to establish some sort of calculator to better judge the decisions, thus a professionally designed PPT design works wonders. Four bottles tracking the sales and marketing report or future growth prospects of the in a presentation slide show is in itself a wonderful idea in itself that brings the best work on the meeting table and helps you get all the appreciation and applause. Business of all sizes can connect with the target group by using presentation slide as it features the use of best graphic designs thus is a more tech savvy mode of communication. The wonderful art graphic used in PowerPoint presentation helps to build relationship, publicize the idea properly so that influential data is not left out. The colored percentage increase champagne bottle column chart in PowerPoint graph helps to arrange and segregate the information in a meaningful manner. Say cheerio to doubts with our 0414 Percentage Increase Champagne Bottle Column Chart Powerpoint Graph. Treat your audience to your decisive thoughts.
You must be logged in to download this presentation.
 Impress your
 audience
Editable
of Time
PowerPoint presentation slides
Proofing and editing can be done with ease in PPT design. Smooth functioning is ensured by the presentation slide show on all software’s. Color, style and position can be standardized, supports font size which can be read from a distance. When projected on the wide screen the PPT layout does not sacrifice on pixels or color resolution.
People who downloaded this PowerPoint presentation also viewed the following :
0414 percentage increase champagne bottle column chart powerpoint graph with all 3 slides:
Unearth the positives with our 0414 Percentage Increase Champagne Bottle Column Chart Powerpoint Graph. Your thoughts will find the silver lining.
-
Unique design & color.
-
Amazing product with appealing content and design.


