Complete Guide To Business Analytics For Improving Company Operations Complete Deck Data Analytics CD
Business analytics is a process of assessing and understanding data to develop data-driven business insights. Introducing our professionally designed PowerPoint Presentation on Complete Guide to Business Analytics for Improving Company Operations. This PPT Bundle presents an overview of how companies employ data analytics to enhance business operational efficiency and expand revenue. It includes understanding the fundamentals of business analytics, its benefits, and its roles in enhancing company performance and productivity with key focus areas for implementation. Moreover, the Business analytics strategy PPT templates provide information regarding the market overview of business analytics solutions with trend analysis. They also discuss various techniques used in business analytics, such as descriptive, predictive, and prescriptive analytics, and their applications in business. Furthermore, the Data Analytics Fundamentals PPT templates showcase steps for implementing data analytics in the business environment, including data collection, analysis, and improvement strategies. Key focus areas discussed are HR, sales, and finance. Lastly, it showcases the impact of successful implementation of data analytics on company operations with business performance dashboards and case studies. Download this 100 percent editable and customizable PowerPoint Bundle today.
You must be logged in to download this presentation.
 Impress your
 audience
Editable
of Time
PowerPoint presentation slides
Step up your game with our enchanting Complete Guide To Business Analytics For Improving Company Operations Complete Deck Data Analytics CD deck, guaranteed to leave a lasting impression on your audience. Crafted with a perfect balance of simplicity, and innovation, our deck empowers you to alter it to your specific needs. You can also change the color theme of the slide to mold it to your company specific needs. Save time with our ready-made design, compatible with Microsoft versions and Google Slides. Additionally, its available for download in various formats including JPG, JPEG, and PNG. Outshine your competitors with our fully editable and customized deck.
People who downloaded this PowerPoint presentation also viewed the following :
Content of this Powerpoint Presentation
Slide 1: This slide introduces Complete guide to Business Analytics for improving company operations. State your company name and begin.
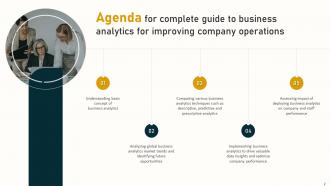
Slide 2: This is an Agenda slide. State your agendas here.
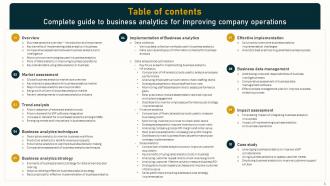
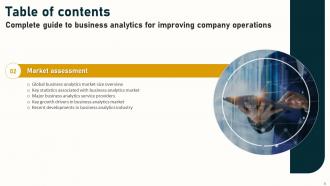
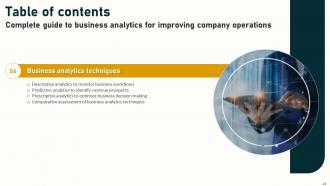
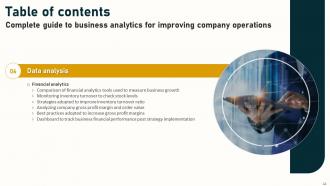
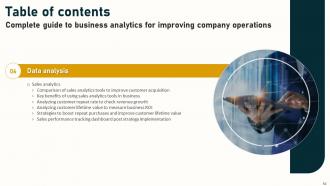
Slide 3: This slide shows Table of Content for the presentation.
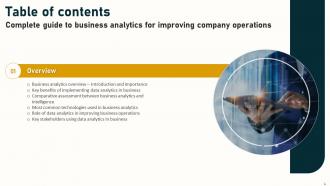
Slide 4: This slide shows title for topics that are to be covered next in the template.
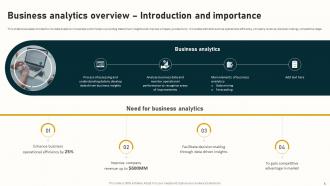
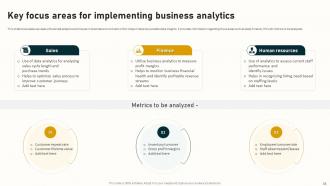
Slide 5: This slide showcases introduction to data analytics in business which helps in providing data driven insights and improve company productivity.
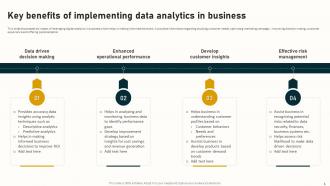
Slide 6: This slide presents key impact of leveraging digital analytics in business which helps in making informed decisions.
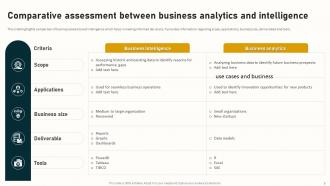
Slide 7: This slide highlights comparison of business analytics and intelligence which helps in making informed decisions. It provides information regarding scope, applications etc.
Slide 8: This slide showcase various technologies which are used in effective implementation of data analytics in business. It provides information regarding natural process learning etc.
Slide 9: This slide presents role of data analytics in enhancing business process efficiency and improving overall productivity. It provides information regarding risk management etc.
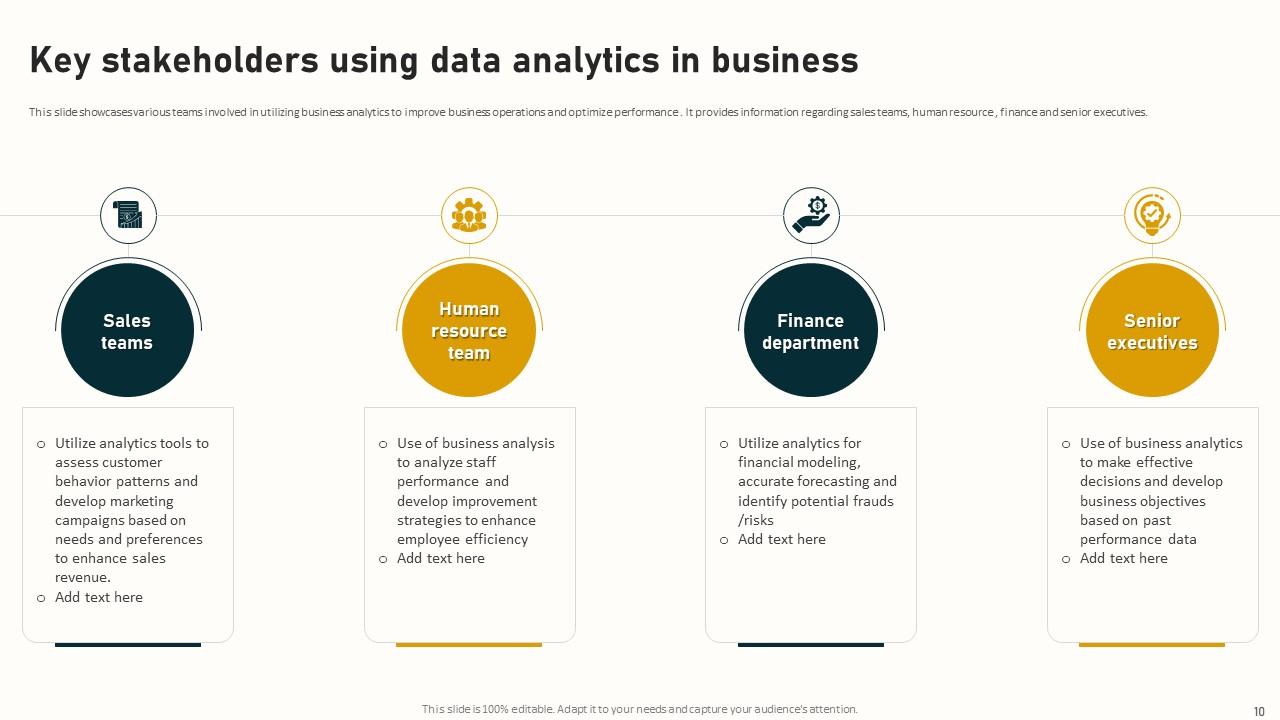
Slide 10: This slide showcases various teams involved in utilizing business analytics to improve business operations and optimize performance.
Slide 11: This slide shows title for topics that are to be covered next in the template.
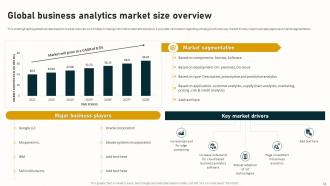
Slide 12: This slide highlights global business analytics market overview which helps in making informed investment decisions.
Slide 13: This slide showcases various stats related to business analytics which helps in identifying growth prospects for investment.
Slide 14: This slide presents major software providers for workforce analytics based on year of year growth rate. It provides information regarding companies regarding IBM corporation, SAP SE etc.
Slide 15: This slide showcases various growth drivers in business analytics market which helps in identifying opportunities and enhance business operations.
Slide 16: This slide displays most recent technological development seen in business analytics market which are contributing in transforming company operations.
Slide 17: This slide shows title for topics that are to be covered next in the template.
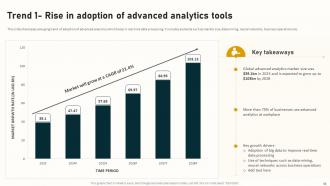
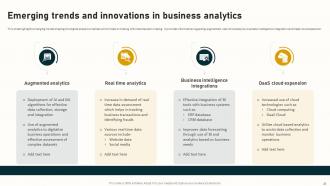
Slide 18: This slide showcases emerging trend of adoption of advanced analytics which helps in real time data processing. It includes elements such as market size, data mining, neural networks etc.
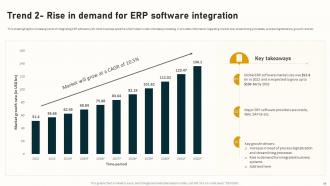
Slide 19: This slide highlights increasing trend of integrating ERP software with other business systems which helps in real time data processing.
Slide 20: This slide showcases rise in usage of cloud based analytics in business which helps in effective data migration and workload management.
Slide 21: This slide highlights emerging trends shaping the digital analytics markets which helps in making informed decision making.
Slide 22: This slide shows title for topics that are to be covered next in the template.
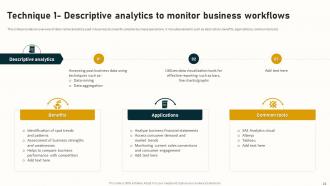
Slide 23: This slide provides an overview of descriptive analytics used in business to simplify complex business operations. It includes elements such as description, benefits, applications etc.
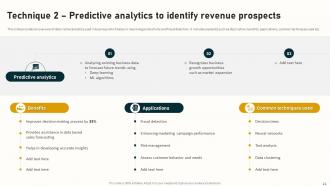
Slide 24: This slide presents an overview of descriptive analytics used in business which helps in improving productivity and fraud detection.
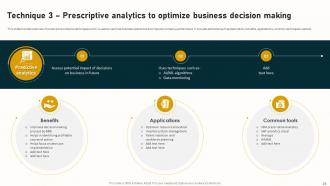
Slide 25: This slide provides overview of prescriptive analytics techniques which is used to optimize business operations and improve company performance.
Slide 26: This slide highlights comparison of descriptive predictive and prescriptive analytics techniques which helps in recognizing suitable method of analyzing business performance.
Slide 27: This slide shows title for topics that are to be covered next in the template.
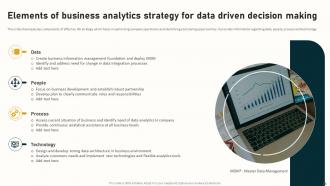
Slide 28: This slide showcases key components of effective BA strategy which helps in optimizing company operations and identifying cost saving opportunities.
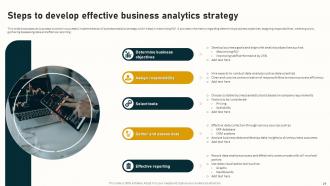
Slide 29: This slide presents various steps involved in successful implementation of business analytics strategy which helps in maximizing ROI.
Slide 30: This slide showcases various tips for successfully implementing business analytics which helps in analyzing and optimizing company operations.
Slide 31: This slide shows title for topics that are to be covered next in the template.
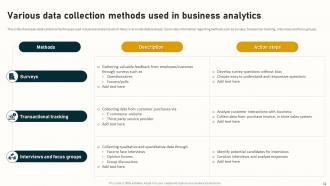
Slide 32: This slide showcases data collection techniques used in business analytics which helps in accurate data analysis. It provides information regarding methods such as surveys etc.
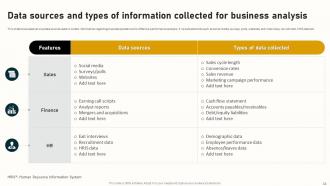
Slide 33: This slide presents various data sources used to collect information regarding business operations for effective performance analysis.
Slide 34: This slide shows title for topics that are to be covered next in the template.
Slide 35: This slide showcases use cases of business analytics techniques in business environment which helps in develop valuable data insights.
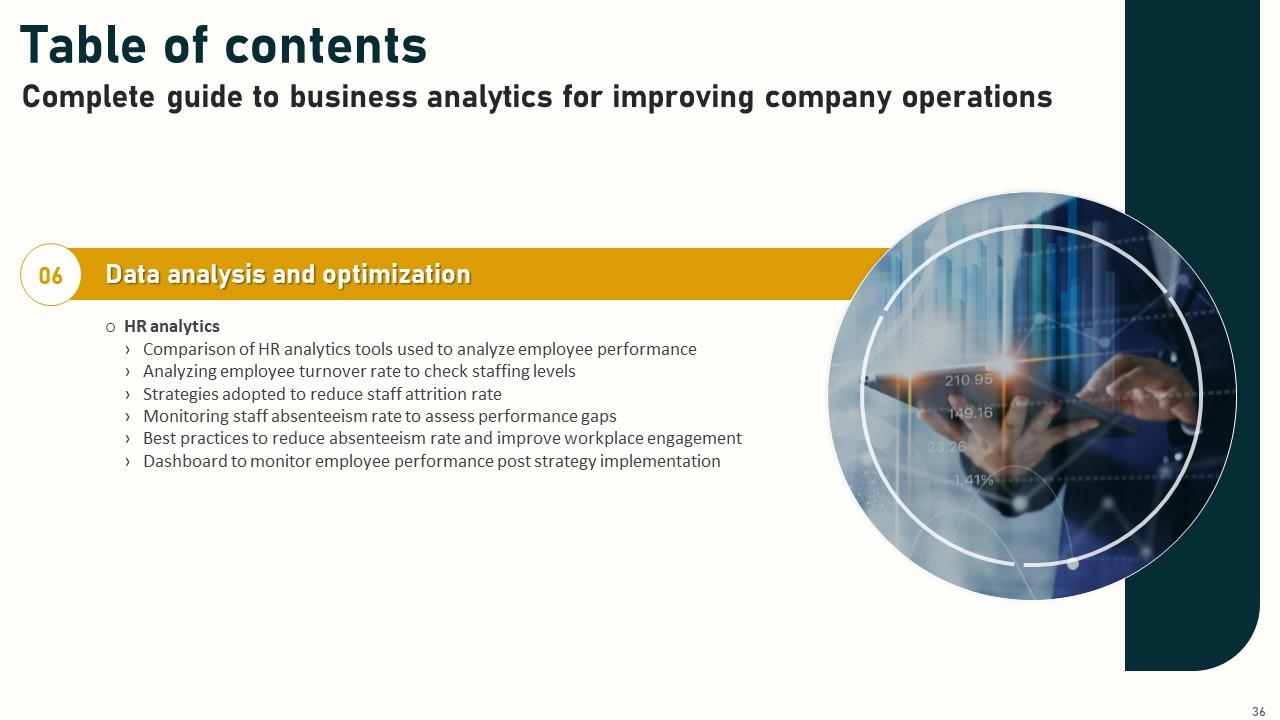
Slide 36: This slide shows title for topics that are to be covered next in the template.
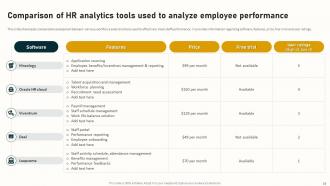
Slide 37: This slide presents comparative assessment between various workforce analytics tools used to effectively track staff performance.
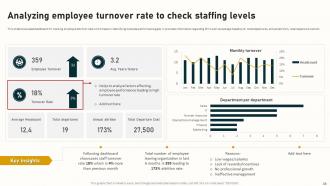
Slide 38: This slide showcases dashboard for tracking employee attrition rate which helps in identifying business performance gaps.
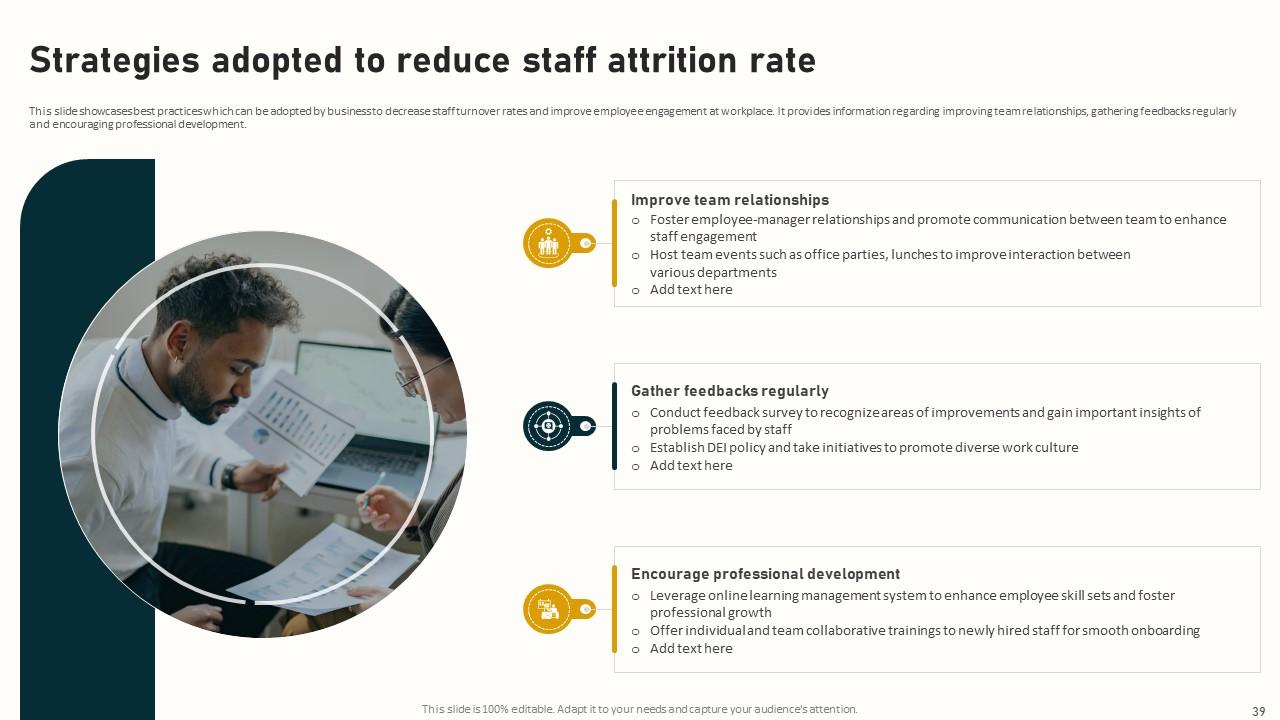
Slide 39: This slide displays best practices which can be adopted by business to decrease staff turnover rates and improve employee engagement at workplace.
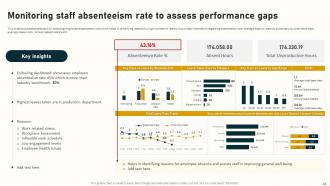
Slide 40: This slide showcases dashboard for analyzing employee absenteeism rate which helps in identifying reasons for high number of leaves.
Slide 41: This slide highlights strategies to improvement employee engagement at workplace to decrease absenteeism rates. It provides information regarding developing attendance policy etc.
Slide 42: This slide showcases dashboard for tracking employee performance at workplace which helps in improving business revenue.
Slide 43: This slide shows title for topics that are to be covered next in the template.
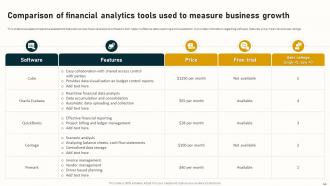
Slide 44: This slide showcases comparative assessment between various financial analytics software which helps in effective data reporting and visualization.
Slide 45: This slide provides dashboard for tracking inventory/levels which helps in analyzing product demand based on customer needs.
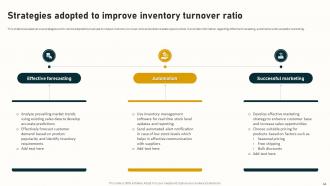
Slide 46: This slide showcases various strategies which can be adopted by business to reduce inventory turnover ratio and enhance sales opportunities.
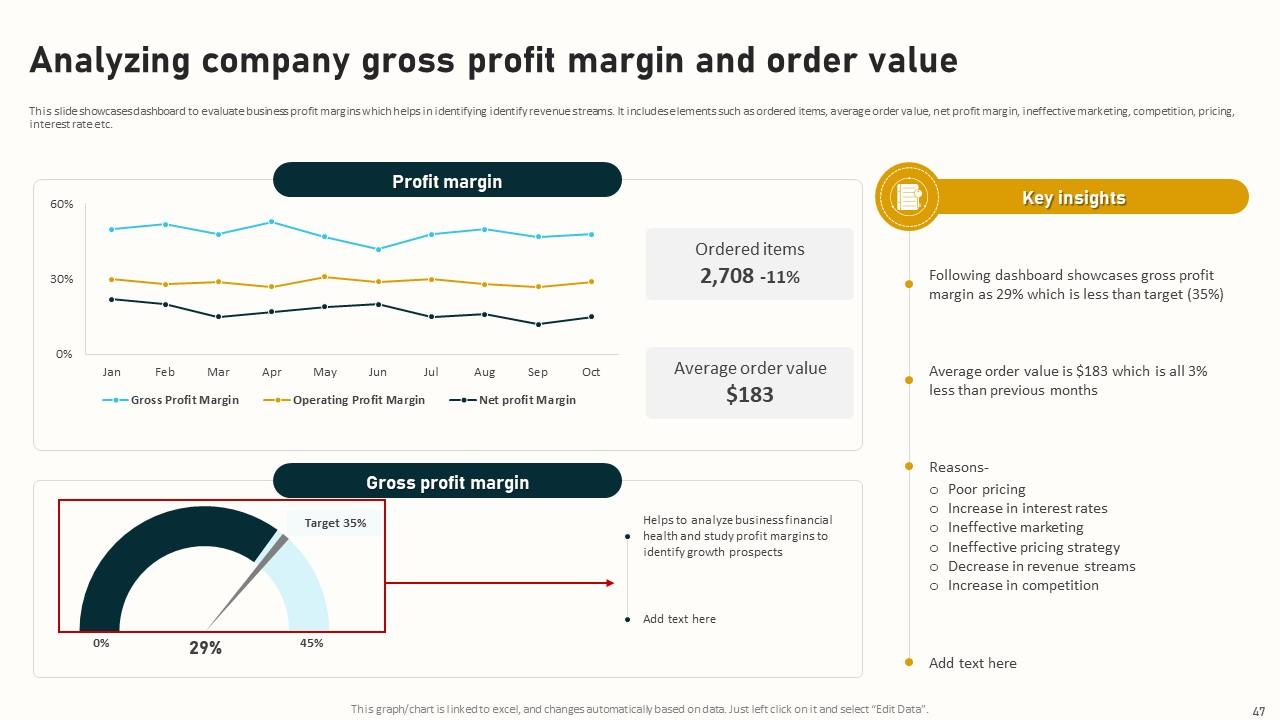
Slide 47: This slide displays dashboard to evaluate business profit margins which helps in identifying identify revenue streams. It includes elements such as ordered items, average order value etc.
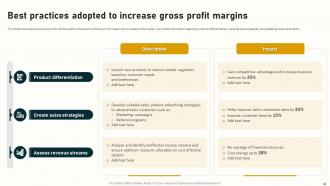
Slide 48: This slide showcases various tips which can be used by business to enhance profit margin and increase product sales.
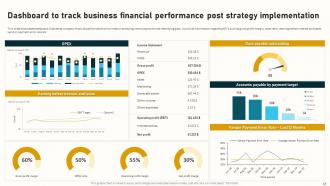
Slide 49: This slide presents dashboard illustrating company financial performance which helps in analyzing revenue growth and identifying gaps.
Slide 50: This slide shows title for topics that are to be covered next in the template.
Slide 51: This slide showcases comparative assessment between various sales analytics software which helps in informed decision making.
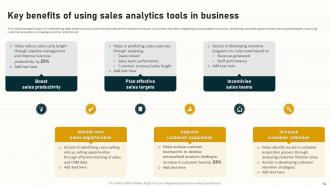
Slide 52: This side displays impact of implementing sales analytics tools to optimize business performance and revenues. It provides information regarding boosting sales productivity etc.
Slide 53: This slide showcases dashboard for monitoring customer repeat rate which helps in analyzing sales conversion and revenue generation.
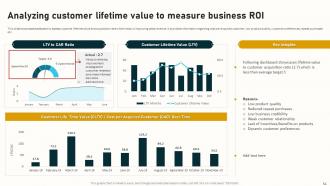
Slide 54: This slide displays dashboard to assess customer lifetime value and acquisition rate which helps in improving sales revenue.
Slide 55: This slide showcases best practices which can be adopted by business to increase repeat customers and improve customer acquisition rate.
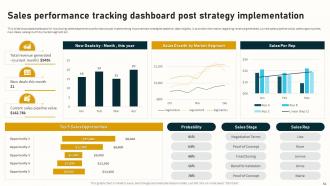
Slide 56: This slide displays dashboard for monitoring sales department performance post implementing improvement strategies based on data insights.
Slide 57: This slide shows title for topics that are to be covered next in the template.
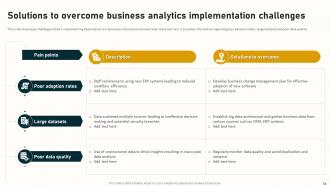
Slide 58: This slide showcases challenges faced in implementing data analytics in business with solutions to overcome these barriers.
Slide 59: This slide presents various tips which can be used by business for effective implementation of data analytics techniques.
Slide 60: This slide shows title for topics that are to be covered next in the template.
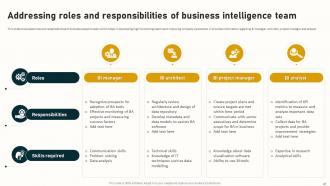
Slide 61: This slide showcases roles and responsibilities of business analytics team which helps in developing high functioning teams and improving company operations.
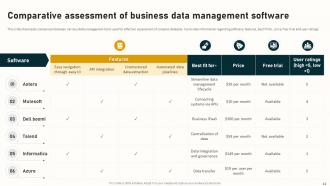
Slide 62: This slide displays comparison between various data management tools used for effective assessment of complex datasets. It provides information regarding software, features etc.
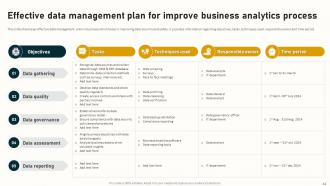
Slide 63: This slide showcases effective data management plan in business which helps in improving data security and safety. It provides information regarding objectives, tasks etc.
Slide 64: This slide shows title for topics that are to be covered next in the template.
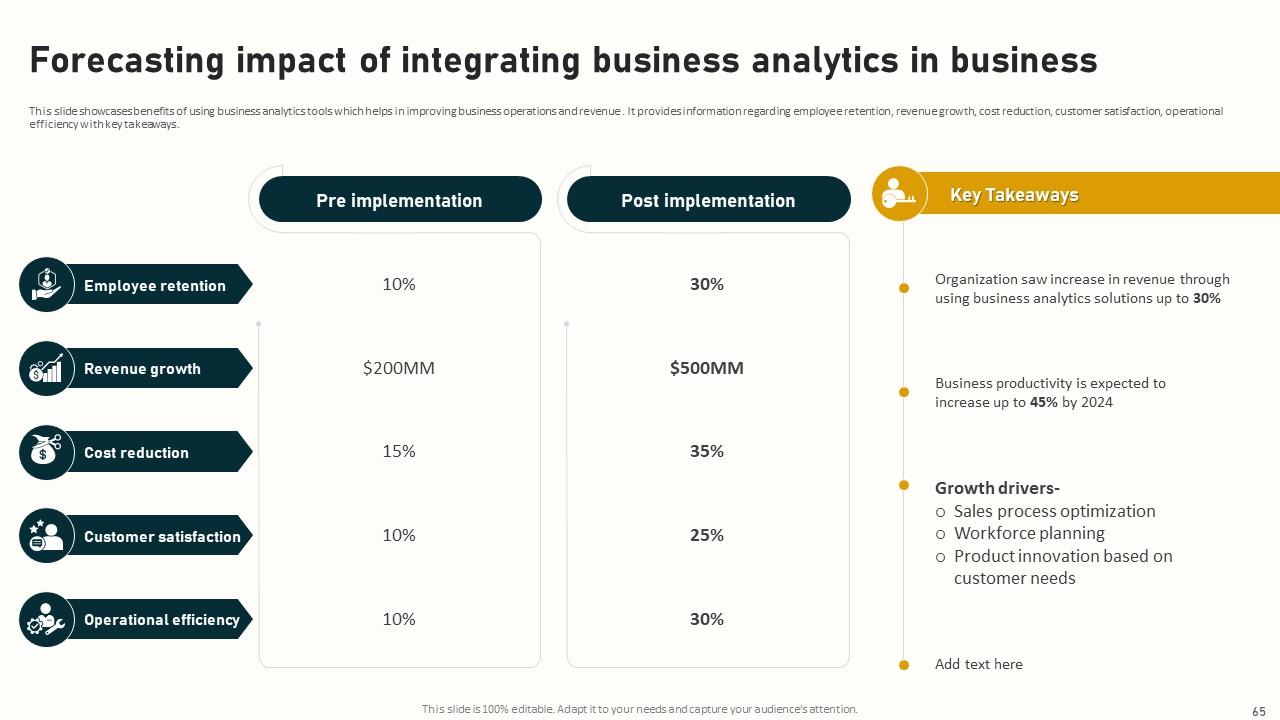
Slide 65: This slide showcases benefits of using business analytics tools which helps in improving business operations and revenue.
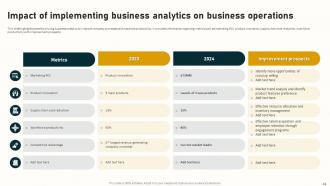
Slide 66: This slide highlights benefits of using business analytics to improve company processes and maximize productivity. It provides information regarding metrics such ad marketing ROI etc.
Slide 67: This slide shows title for topics that are to be covered next in the template.
Slide 68: This slide showcases case study for implementing data analytics in business to enhance employee interactions an optimize performance.
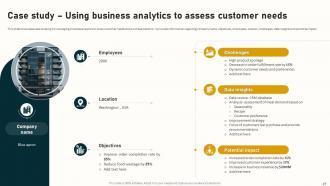
Slide 69: This slide displays case studying for leveraging business analytics to study customer needs and purchase patterns. It provides information regarding company name, objectives, employees etc.
Slide 70: This slide showcases case study for implementing business analytics in uber to enhance customer experience and easy resolution of queries.
Slide 71: This slide shows all the icons included in the presentation.
Slide 72: This slide is titled as Additional Slides for moving forward.
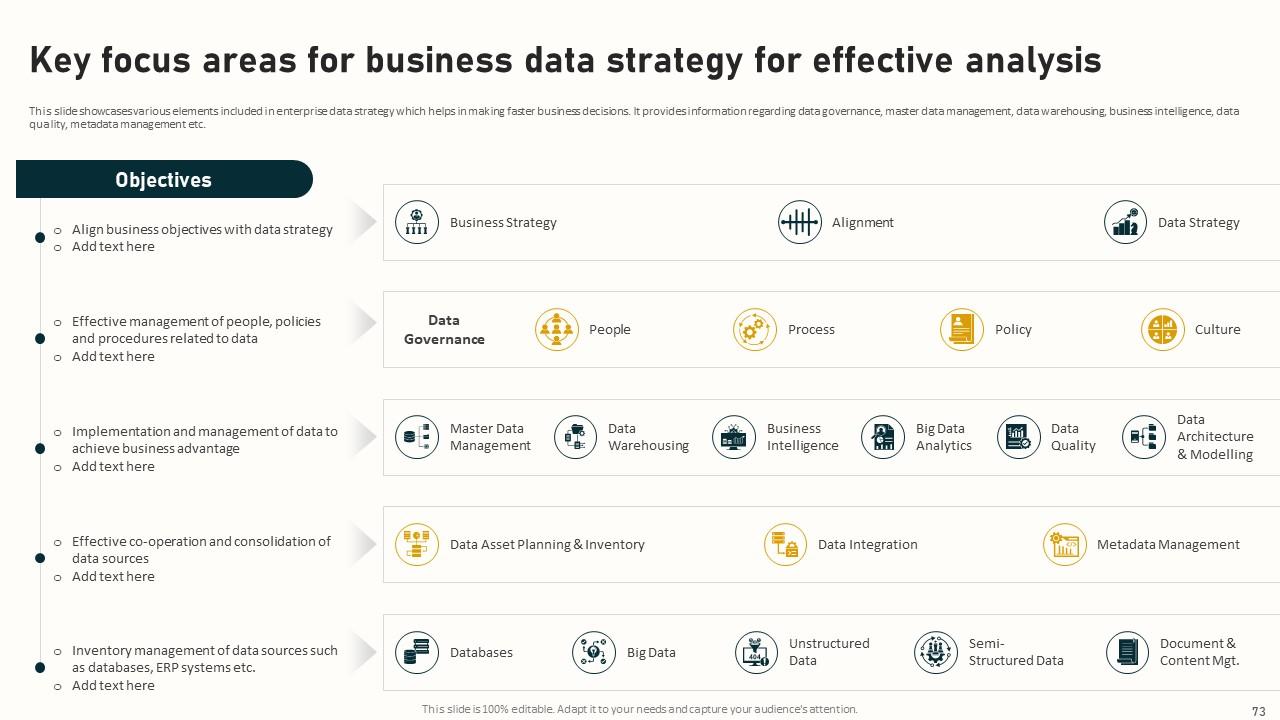
Slide 73: This slide showcases various elements included in enterprise data strategy which helps in making faster business decisions.
Slide 74: This is Our Team slide with names and designation.
Slide 75: This is About Us slide to show company specifications etc.
Slide 76: This slide presents Bar Chart with two products comparison.
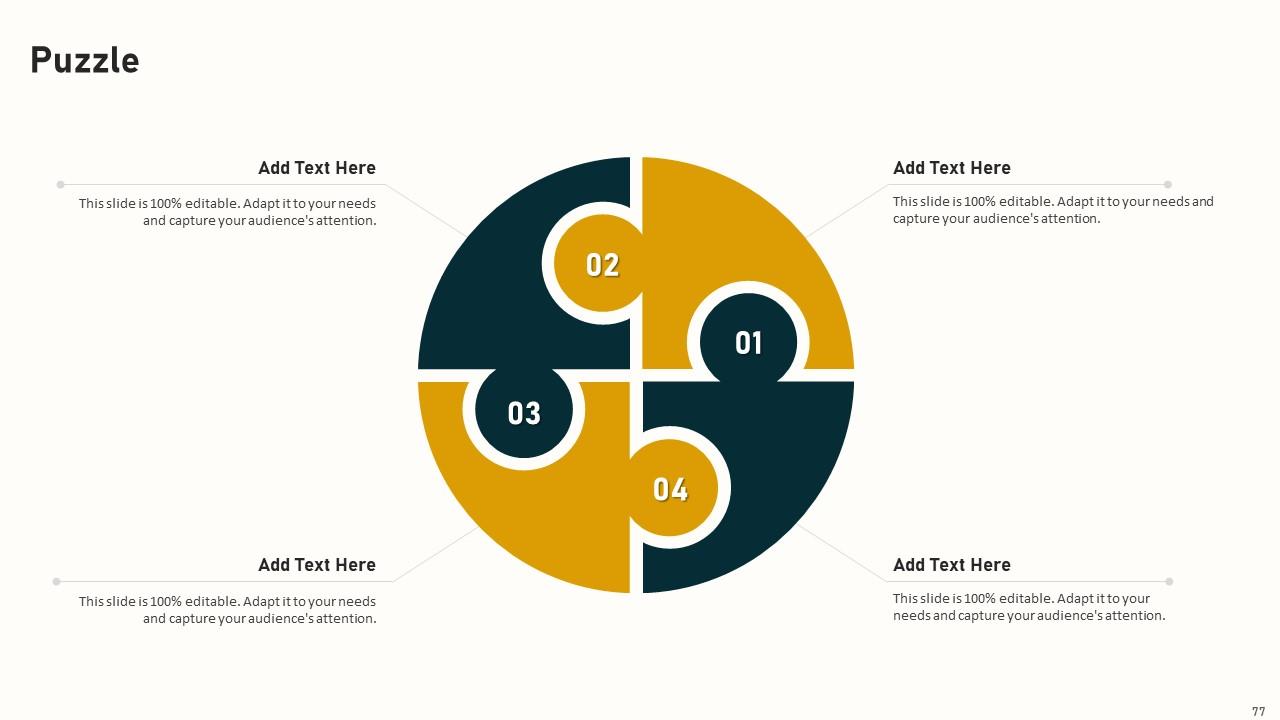
Slide 77: This slide contains Puzzle with related icons and text.
Slide 78: This slide shows SWOT analysis describing- Strength, Weakness, Opportunity, and Threat.
Slide 79: This is a Timeline slide. Show data related to time intervals here.
Slide 80: This slide shows Post It Notes for reminders and deadlines. Post your important notes here.
Slide 81: This is an Idea Generation slide to state a new idea or highlight information, specifications etc.
Slide 82: This is Our Mission slide with related imagery and text.
Slide 83: This is a Thank You slide with address, contact numbers and email address.
Complete Guide To Business Analytics For Improving Company Operations Complete Deck Data Analytics CD with all 92 slides:
Use our Complete Guide To Business Analytics For Improving Company Operations Complete Deck Data Analytics CD to effectively help you save your valuable time. They are readymade to fit into any presentation structure.
-
Eye-catching PPT designs, outstanding team, and best customer service. I’m a super satisfied customer here!
-
Love the template collection they have! I have prepared for my meetings much faster without worrying about designing a whole presentation from scratch.


