Mastering Data Analytics A Comprehensive Guide Data Analytics CD
Here is a competently designed Mastering Data Analytics A Comprehensive Guide PPT. This Google Data Analytics PowerPoint helps you understand the benefits, applications, trends, market size, and phases of implementing data analytics. Moreover, this Business Analytics deck may help organizations understand techniques introduced to streamline data-driven decision-making. Furthermore, these Big Data Analytics PPT slides provide insights into the usability and benefits of software tools such as Tableau, Microsoft PowerBI, etc. Also, these PPT slides highlight budget allocation and impact analysis of implementing data analytics tools and techniques on KPIs. Finally, this complete deck presents case studies and future trends underscoring the growth of data analytics on a global level. Get access now.
You must be logged in to download this presentation.
 Impress your
 audience
Editable
of Time
PowerPoint presentation slides
Step up your game with our enchanting Mastering Data Analytics A Comprehensive Guide Data Analytics CD deck, guaranteed to leave a lasting impression on your audience. Crafted with a perfect balance of simplicity, and innovation, our deck empowers you to alter it to your specific needs. You can also change the color theme of the slide to mold it to your companys specific needs. Save time with our ready-made design, compatible with Microsoft versions and Google Slides. Additionally, it is available for download in various formats including JPG, JPEG, and PNG. Outshine your competitors with our fully editable and customized deck.
People who downloaded this PowerPoint presentation also viewed the following :
Content of this Powerpoint Presentation
Slide 1: The slide introduces Mastering Data Analytics: A Comprehensive Guide. State your Company name and begin.
Slide 2: This is an Agenda slide. State your agendas here.
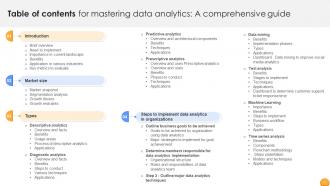
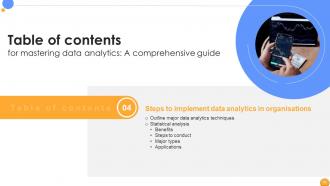
Slide 3: The slide displays Table of contents for the presentation.
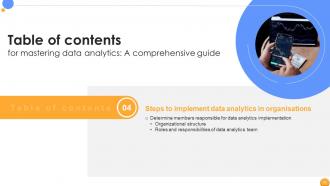
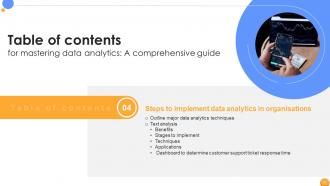
Slide 4: The slide renders Table of contents further.
Slide 5: The slide again Table of contents.
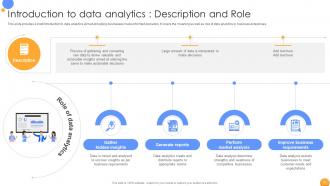
Slide 6: This slide provides a brief introduction to data analytics aimed at helping businesses make informed decisions.
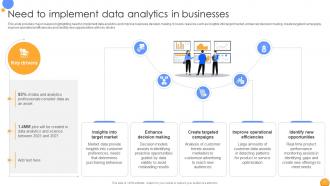
Slide 7: This slide renders major reasons highlighting need to implement data analytics and improve business decision making.
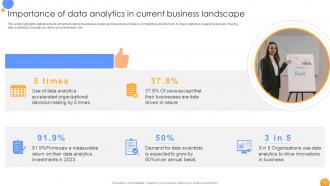
Slide 8: This slide highlights statistical facts aimed ta helping businesses make rapid decisions in today’s competitive environment.
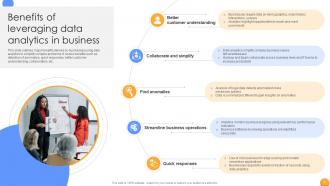
Slide 9: This slide outlines major benefits derived by businesses using data analytics to simplify complex problems.
Slide 10: This slide renders application areas of data analytics aimed at helping various industries maximize efficiency and reduce wastage.
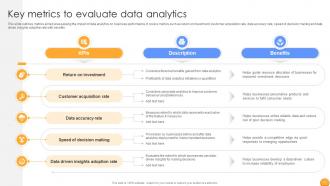
Slide 11: This slide highlights metrics aimed at assessing the impact of data analytics on business performance.
Slide 12: The slide again shows Title of contents.
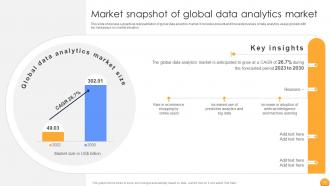
Slide 13: This slide showcase a graphical representation of global data analytics market.
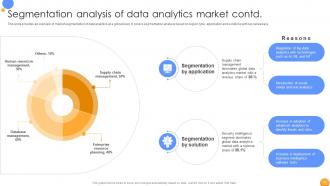
Slide 14: This slide briefs an overview of market segmentation of data analytics at a global level.
Slide 15: This slide continues an overview of market segmentation of data analytics at a global level.
Slide 16: This slide shows major growth drivers promoting increased use of data analytics at a global level to boost business reach.
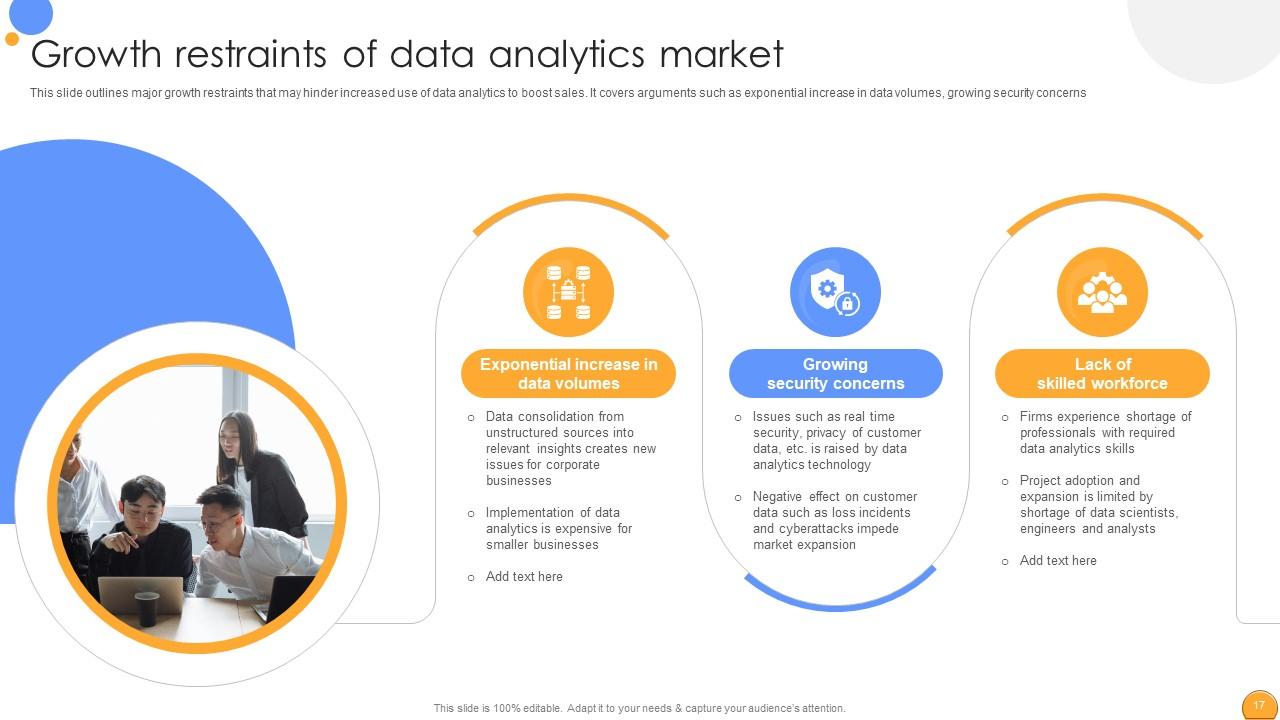
Slide 17: This slide depicts major growth restraints that may hinder increased use of data analytics to boost sales.
Slide 18: The slide displays Title of contents which is to be discussed further.
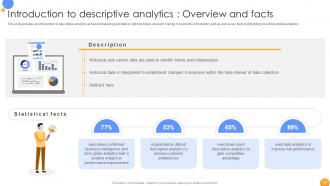
Slide 19: This slide provides an introduction to descriptive analytics aimed at analysing past data to optimize future decision making.
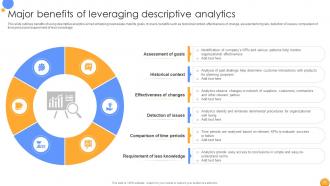
Slide 20: This slide highlights benefits of using descriptive analytics aimed at helping businesses meet its goals.
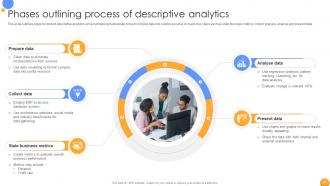
Slide 21: This slide shows steps to conduct descriptive analytics aimed at helping businesses convert complex data into useful resource.
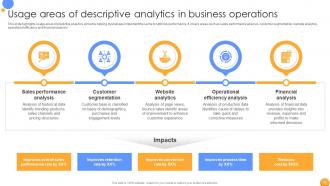
Slide 22: This slide highlights usage areas of predictive analytics aimed ta helping businesses implement the same to optimize performance.
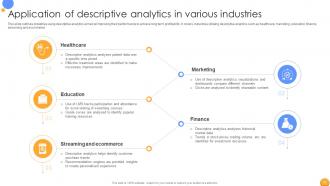
Slide 23: This slide outlines industries using descriptive analytics aimed at improving their performance to achieve long term profitability.
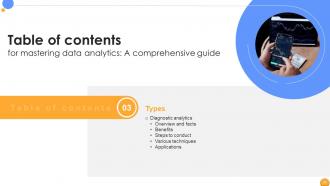
Slide 24: The slide again displays Title of contents.
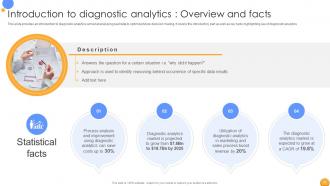
Slide 25: This slide provides an introduction to diagnostic analytics aimed at analysing past data to optimize future decision making.
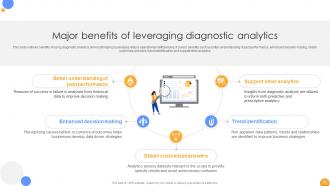
Slide 26: This slide outlines benefits of using diagnostic analytics aimed at helping businesses reduce operational inefficiencies.
Slide 27: This slide demonstrates steps to conduct diagnostic analytics aimed at helping businesses convert complex data into useful resources.
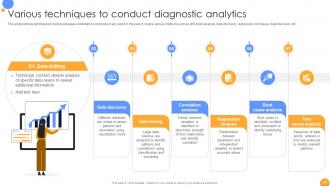
Slide 28: This slide highlights techniques to help businesses understand occurrence of any event in the past.
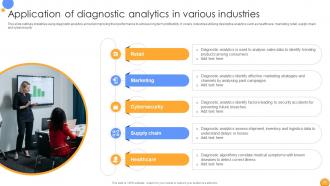
Slide 29: This slide outlines industries using diagnostic analytics aimed at improving their performance to achieve long term profitability.
Slide 30: The slide renders another Title of contents.
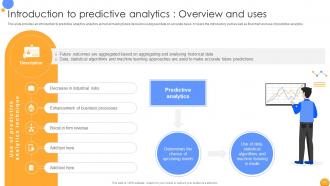
Slide 31: This slide provides an introduction to predictive analytics analytics aimed at making future decisions using past data on accurate basis.
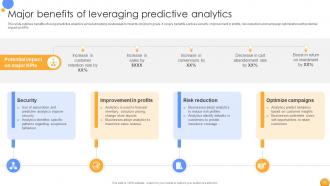
Slide 32: This slide outlines benefits of using predictive analytics aimed at helping businesses to meet its long term goals.
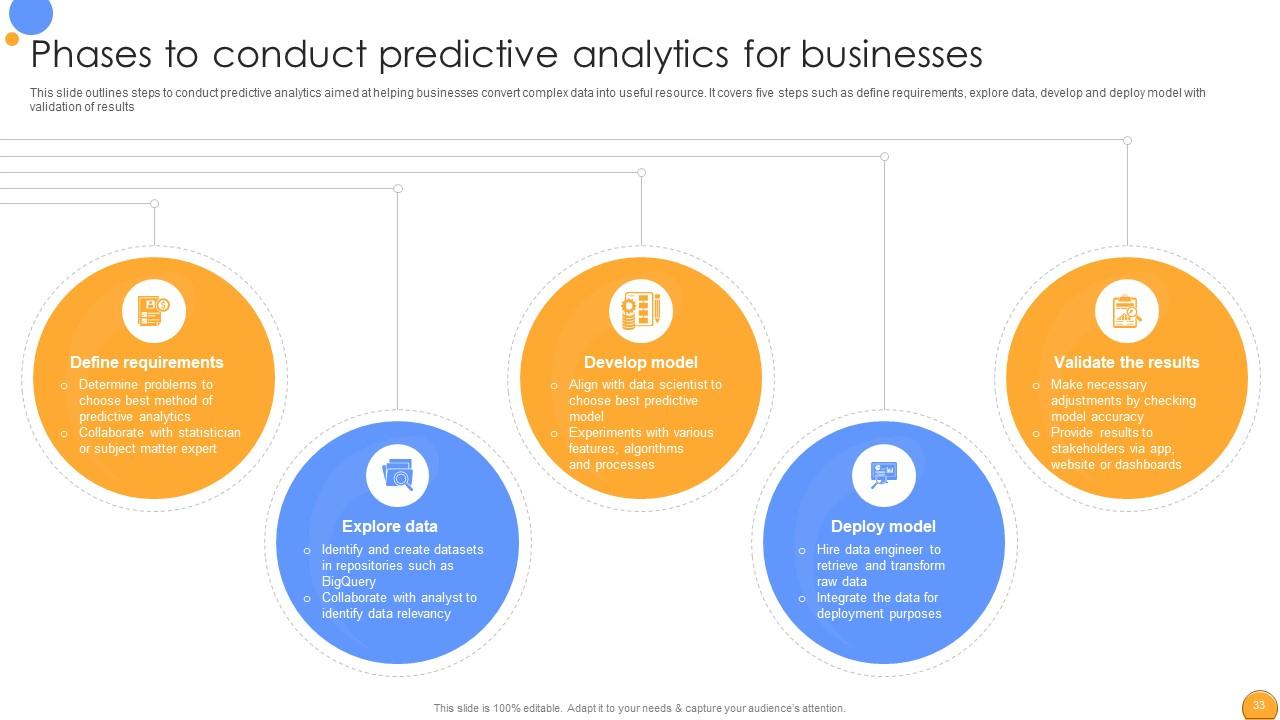
Slide 33: This slide renders steps to conduct predictive analytics aimed at helping businesses convert complex data into useful resource.
Slide 34: This slide shows major techniques used by businesses aimed at employing predictive analytics in their operations.
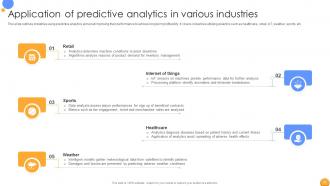
Slide 35: This slide outlines industries using predictive analytics aimed at improving their performance to achieve long term profitability.
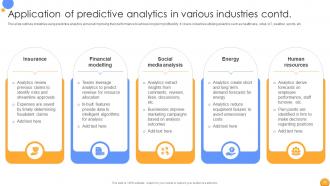
Slide 36: This slide continues industries using predictive analytics aimed at improving their performance to achieve long term profitability.
Slide 37: The slide displays Title of contents which is to be discussed further.
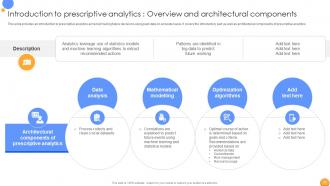
Slide 38: This slide provides an introduction to prescriptive analytics aimed at making future decisions using past data on accurate basis.
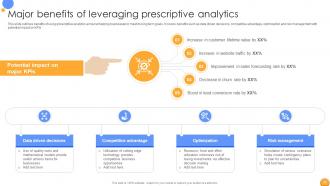
Slide 39: This slide outlines benefits of using prescriptive analytics aimed at helping businesses to meet its long term goals.
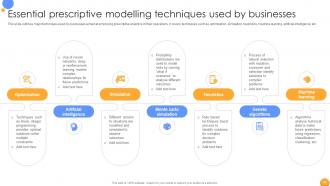
Slide 40: This slide displays major techniques used by businesses aimed at employing prescriptive analytics in their operations.
Slide 41: This slide outlines industries using prescriptive analytics aimed at improving their performance to achieve long term profitability.
Slide 42: The slide again depicts Title of contents.
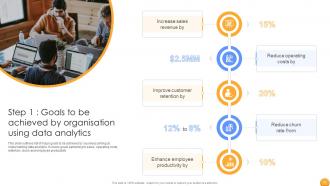
Slide 43: This slide provides list of major goals to be achieved by business aiming at implementing data analytics.
Slide 44: This slide outlines a table highlighting various data analytics initiates to be undertaken by business for achieving business goals.
Slide 45: The slide again displays Title of contents.
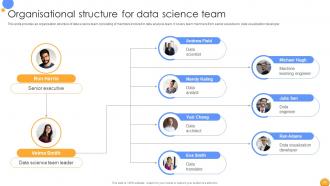
Slide 46: This slide provides an organisation structure of data science team consisting of members involved in data analysis team.
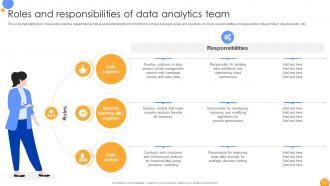
Slide 47: This slide highlights team roles under analytics department aimed at understanding their functioning to achieve business goals and objectives.
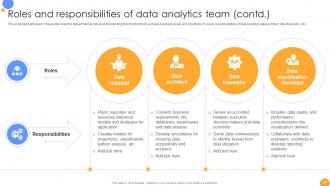
Slide 48: This slide shows team roles under analytics department aimed at understanding their functioning to achieve business goals and objectives.
Slide 49: The slide displays Title of contents further.
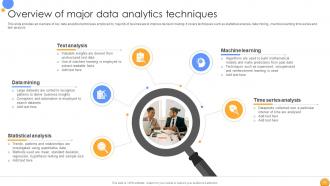
Slide 50: This slide provides an overview of key data analytics techniques employed by majority of businesses to improve decision making.
Slide 51: The slide displays Title of contents which is to be discussed further.
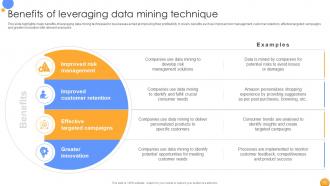
Slide 52: This slide highlights major benefits of leveraging data mining techniques for businesses aimed at improving their profitability.
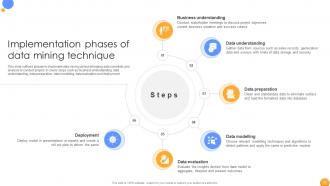
Slide 53: This slide presents phases to implement data mining aimed at helping data scientists and analysis to conduct project.
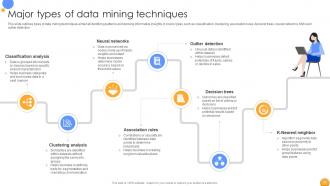
Slide 54: This slide outlines types of data mining techniques aimed at identifying patterns and deriving informative insights.
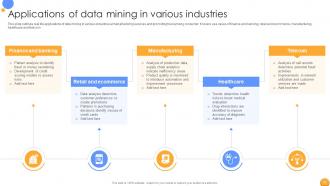
Slide 55: This slide displays real life applications of data mining in various industries aimed at tailoring services and promoting trust among consumer.
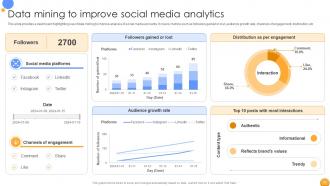
Slide 56: This slide provides a dashboard highlighting use of data mining to improve analysis of social media accounts.
Slide 57: The slide renders Title of contents further.
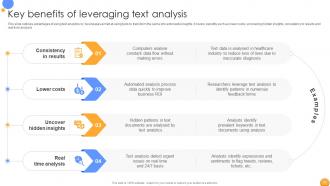
Slide 58: This slide highlights advantages of using text analytics by businesses aimed at using texts to transform the same into actionable insights.
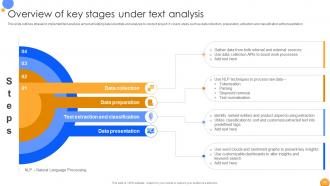
Slide 59: This slide shows phases to implement text analysis aimed at helping data scientists and analysis to conduct project.
Slide 60: This slide presents types of text analysis techniques aimed at identifying patterns and deriving informative insights.
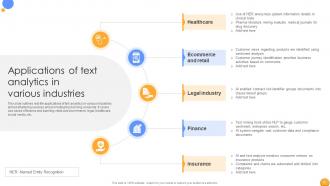
Slide 61: This slide outlines real life applications of text analytics in various industries aimed at tailoring services and promoting trust among consumer.
Slide 62: This slide continues real life applications of text analytics in various industries aimed at tailoring services and promoting trust among consumer.
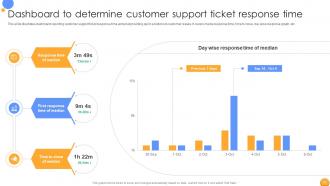
Slide 63: This slide illustrates dashboard reporting customer support ticket response time aimed at providing quick solutions to customer issues.
Slide 64: The slide again depicts Title of contents.
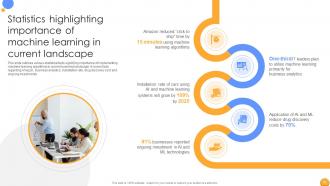
Slide 65: This slide outlines various statistical facts signifying importance of implementing machine learning algorithms in current business landscape.
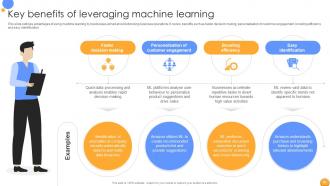
Slide 66: This slide highlights advantages of using machine learning by businesses aimed at revolutionizing business operations.
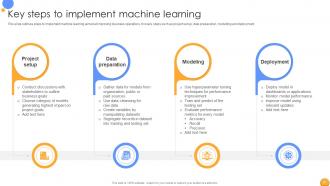
Slide 67: This slide renders steps to implement machine learning aimed at improving business operations.
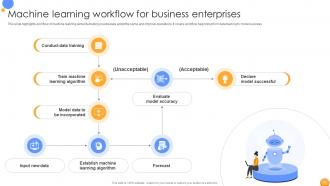
Slide 68: This slide highlights workflow of machine learning aimed ta helping businesses adopt the same and improve operations.
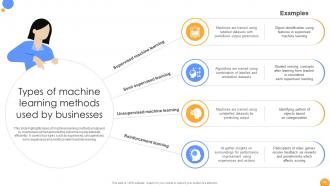
Slide 69: This slide highlights types of machine learning methods employed by businesses aimed at predicting outcomes using datasets efficiently.
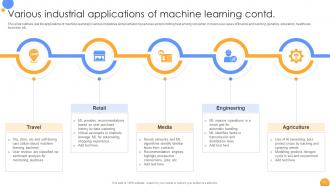
Slide 70: This slide outlines real life applications of machine learning in various industries aimed at tailoring services and promoting trust among consumer.
Slide 71: This slide continues real life applications of machine learning in various industries aimed at tailoring services and promoting trust among consumer.
Slide 72: The slide again shows Title of contents.
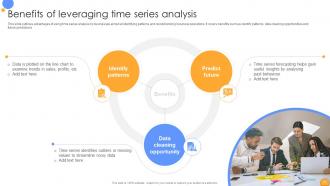
Slide 73: This slide outlines advantages of using time series analysis by businesses aimed at identifying patterns and revolutionizing business operations.
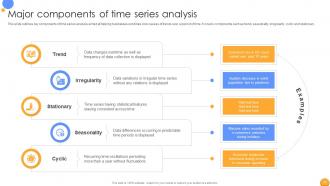
Slide 74: This slide renders key components of time series analysis aimed at helping businesses scrutinize core causes of trends over a period of time.
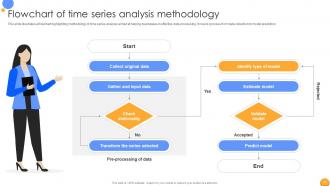
Slide 75: This slide illustrates a flowchart highlighting methodology of time series analysis aimed at helping businesses in effective data processing.
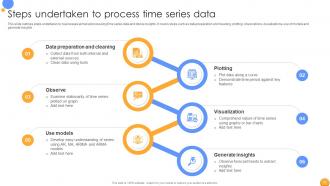
Slide 76: This slide outlines steps undertaken by businesses aimed at processing time series data and derive insights.
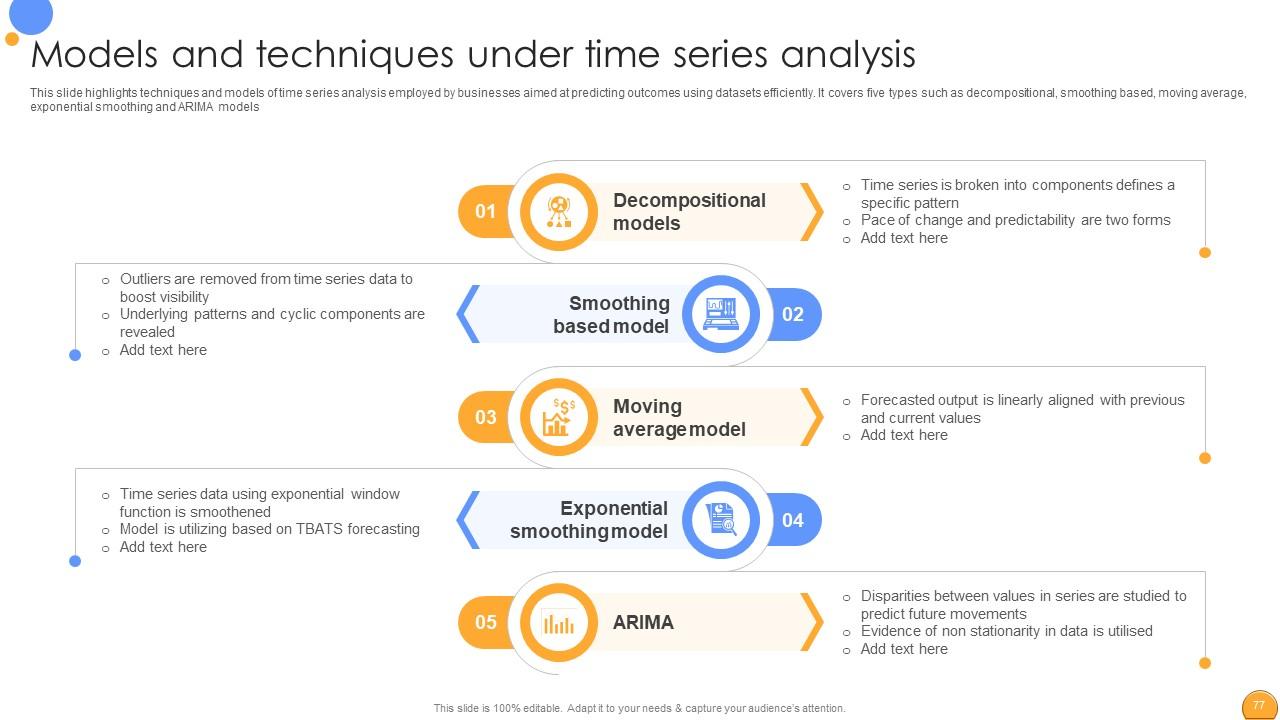
Slide 77: This slide highlights techniques and models of time series analysis employed by businesses aimed at predicting outcomes using datasets efficiently.
Slide 78: This slide outlines real life applications of time series analysis in various industries aimed at tailoring services and promoting data driven operations.
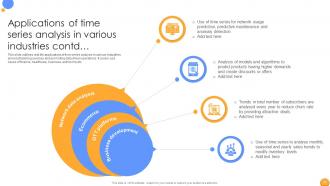
Slide 79: This slide continues real life applications of time series analysis in various industries aimed at tailoring services and promoting data driven operations.
Slide 80: The slide displays Title of contents further.
Slide 81: This slide highlights advantages of using statistical analysis by businesses aimed at identifying patterns and revolutionizing business operations.
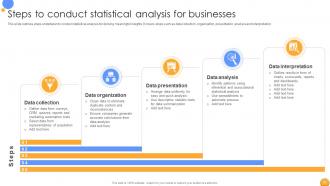
Slide 82: This slide outlines steps undertaken to conduct statistical analysis for deriving meaningful insights.
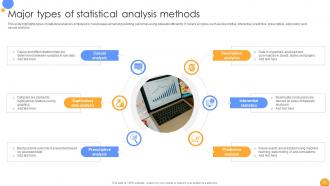
Slide 83: This slide highlights types of statistical analysis employed by businesses aimed at predicting outcomes using datasets efficiently.
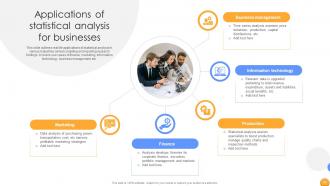
Slide 84: This slide outlines real life applications of statistical analysis in various industries aimed compiling and reporting research findings.
Slide 85: The slide renders Title of contents further.
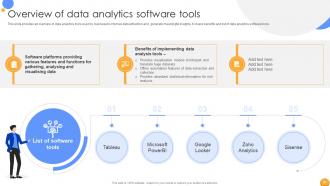
Slide 86: This slide provides an overview of data analytics tools used by business to improve data extraction and generate meaningful insights.
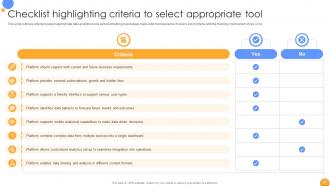
Slide 87: This slide outlines criteria to select appropriate data analytics tools aimed at helping businesses make informed decisions.
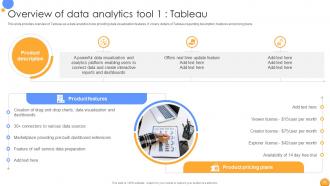
Slide 88: This slide provides overview of Tableau as a data analytics tools providing data visualization features.
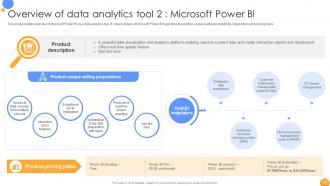
Slide 89: This slide provides overview of Microsoft Power BI as a data analytics tool.
Slide 90: This slide briefs overview of Google Looker as a data analytics tool.
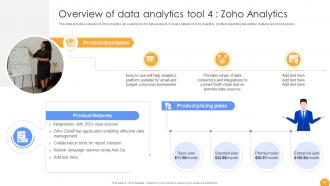
Slide 91: This slide gives overview of Zoho Analytics as a viable tool for data analysis.
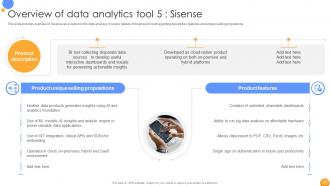
Slide 92: This slide presents overview of Sisense as a viable tool for data analysis.
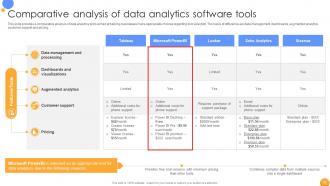
Slide 93: This slide provides a comparative analysis of data analytics tools aimed at helping businesses make appropriate choices regarding tool selection.
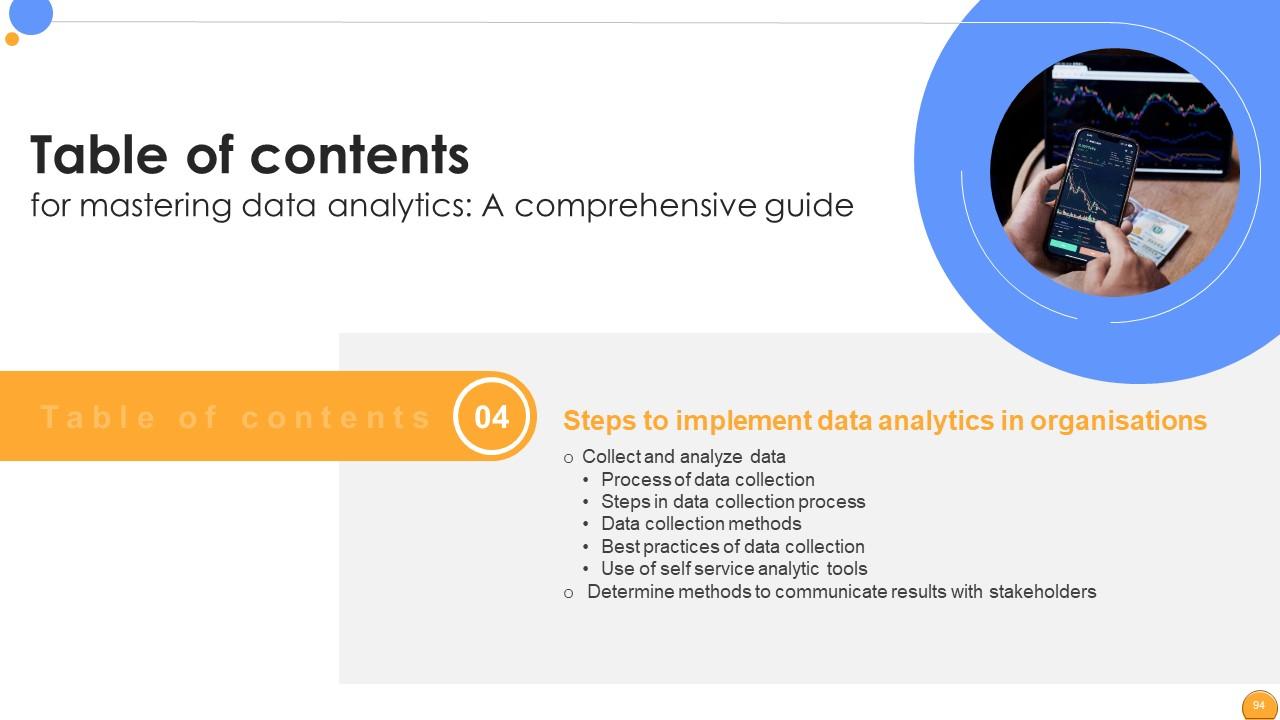
Slide 94: The slide displays Title of contents further.
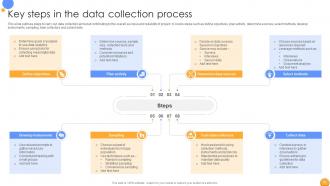
Slide 95: This slide outlines steps to carry out data collection aimed at contributing to the overall success and reliability of project.
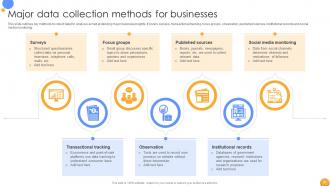
Slide 96: This slide displays key methods to collect data for analysis aimed at deriving major business insights.
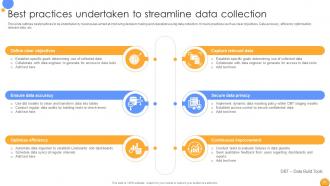
Slide 97: This slide outlines best practices to be undertaken by businesses aimed at improving decision making and operations using data collection.
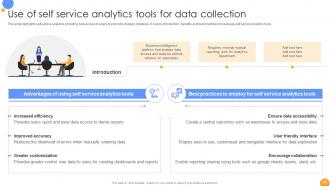
Slide 98: This slide highlights self service analytics providing data access to users to promote strategic initiatives.
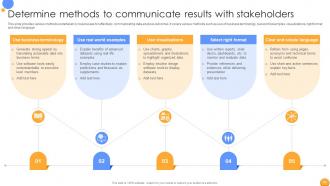
Slide 99: This slide provides various methods undertaken by businesses for effectively communicating data analysis outcomes.
Slide 100: The slide shows Title of contents which is to be discussed further.
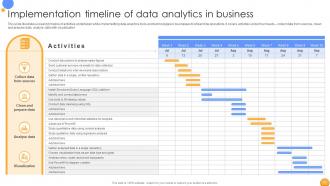
Slide 101: This slide illustrates a weekly timeline of activities undertaken while implementing data analytics tools and technologies in businesses.
Slide 102: The slide depicts another Title of contents.
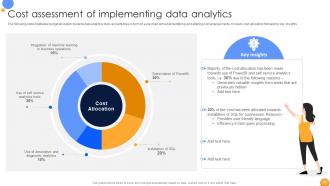
Slide 103: The slide illustrates budget allocation towards data analytics tools and activities in form of a pie chart aimed at identifying.
Slide 104: The slide again renders Title of contents.
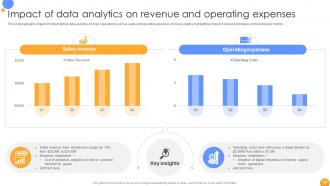
Slide 105: This slide highlights impact of implementing data analytics on major operations such as sales and operating expenses.
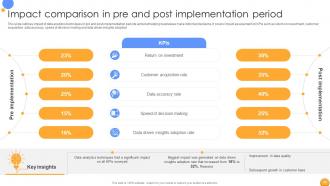
Slide 106: This slide outlines impact of data analytics techniques in pre and post implementation periods aimed at helping businesses make informed decisions.
Slide 107: The slide again shows Title of contents.
Slide 108: This slide outlines major barriers faced by businesses regarding data to make informed decisions and gain competitive advantage.
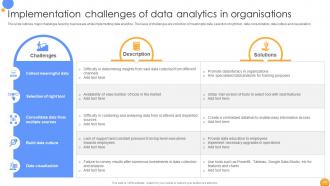
Slide 109: This slide renders major challenges faced by businesses while implementing data analytics.
Slide 110: The slide again depicts Title of contents.
Slide 111: This slide highlights future trends aimed at boosting data analytics market at a global level.
Slide 112: The slide again displays Title of contents.
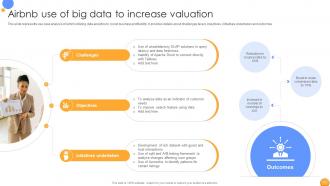
Slide 113: This slide represents use case analysis of Airbnb utilizing data analytics to boost business profitability.
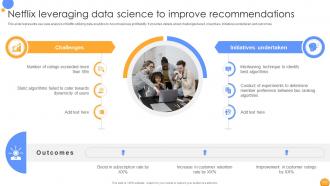
Slide 114: This slide shows use case analysis of Netflix utilizing data analytics to boost business profitability.
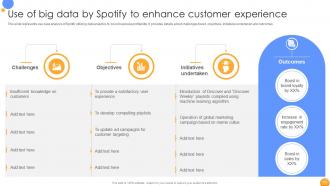
Slide 115: This slide presents use case analysis of Spotify utilizing data analytics to boost business profitability.
Slide 116: This slide shows all the icons included in the presentation.
Slide 117: This is a Thank You slide with address, contact numbers and email address.
Mastering Data Analytics A Comprehensive Guide Data Analytics CD with all 126 slides:
Use our Mastering Data Analytics A Comprehensive Guide Data Analytics CD to effectively help you save your valuable time. They are readymade to fit into any presentation structure.
-
I am glad to have come across Slideteam. I was searching for some unique presentations and templates for my business. There are a lot of alternatives available here.
-
Nice and innovative design.


