Enhancing Business Insights Implementing Product Analytics In Organizations Data Analytics CD
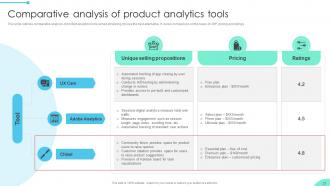
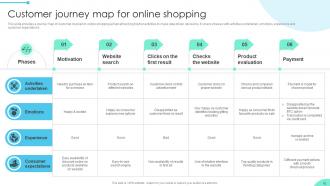
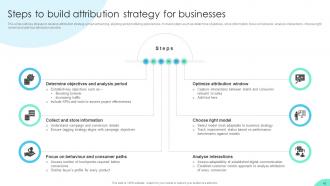
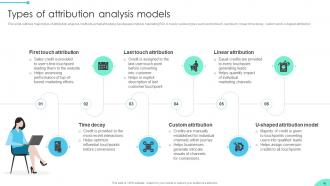
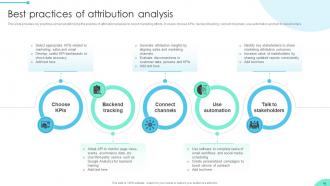
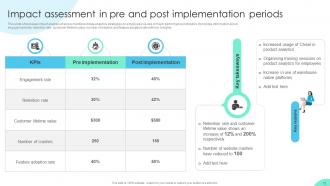
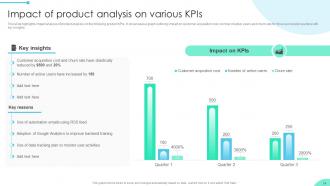
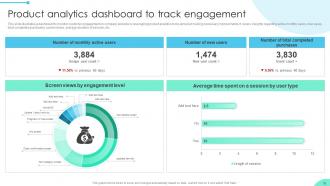
Product Analytics outlines the process of analyzing methods to assist user engagement with the product or service. Grab our professionally created Enhancing Business Insights Implementing Product Analytics in Organizations PowerPoint presentation. The main purpose of Product Analytics is to assist teams in improving or optimizing a product or service. This PPT creates an understanding of the benefits, applications, trends, market size, and phases of implementing product analytics to optimize business performance. Moreover, the Data Analytics Tools and Techniques PPT templates help organizations get an overview of techniques introduced to streamline decision-making. These include trends analysis, customer journey mapping, attribution analysis, cohort, and retention analysis. Furthermore, the Data Analytics Software PPT slides provide insights into the usability and benefits of software tools such as UX Cam, Adobe Analytics, and Chisel. Additionally, it highlights budget allocation and impact analysis of implementing product analytics tools and techniques on KPIs. Including engagement, retention, customer lifetime value, number of crashes, customer acquisition cost, churn rate, active users, and feature adoption rate. Finally, this PPT complete deck presents dashboards highlighting the use of product analytics in real-life business situations. Download it now.
You must be logged in to download this presentation.
 Impress your
 audience
Editable
of Time
PowerPoint presentation slides
Deliver an informational PPT on various topics by using this Enhancing Business Insights Implementing Product Analytics In Organizations Data Analytics CD. This deck focuses and implements best industry practices, thus providing a birds-eye view of the topic. Encompassed with eighty four slides, designed using high-quality visuals and graphics, this deck is a complete package to use and download. All the slides offered in this deck are subjective to innumerable alterations, thus making you a pro at delivering and educating. You can modify the color of the graphics, background, or anything else as per your needs and requirements. It suits every business vertical because of its adaptable layout.
People who downloaded this PowerPoint presentation also viewed the following :
Content of this Powerpoint Presentation
Slide 1: This slide introduces Unlocking the Power of Prescriptive Analytics: A Definitive Guide. State your company name and begin.
Slide 2: This is an Agenda slide. State your agendas here.
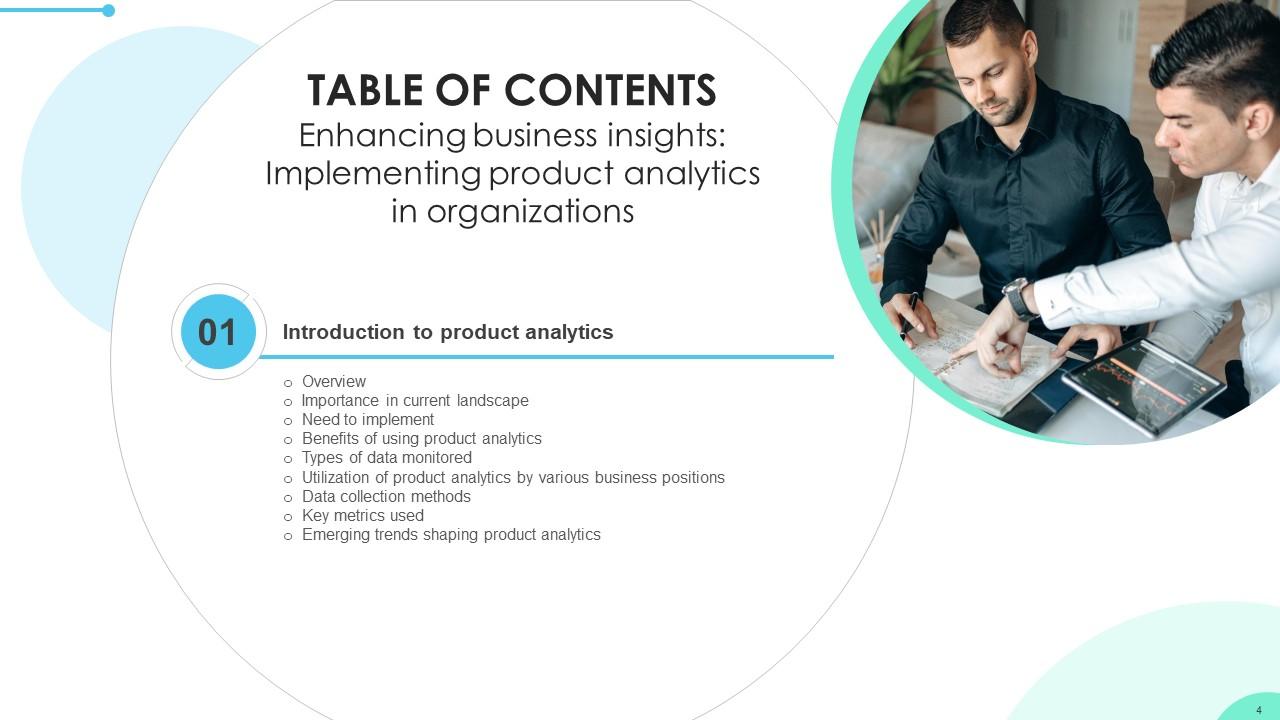
Slide 3: This slide shows Table of Content for the presentation.
Slide 4: This slide continues showing Table of Content for the presentation.
Slide 5: This slide shows title for topics that are to be covered next in the template.
Slide 6: This slide provides an introduction to prescriptive analytics aimed at making future decisions using past data on accurate basis.
Slide 7: This slide displays a table comparing four types of analytics such as descriptive diagnostic, predictive and prescriptive analytics.
Slide 8: This slide outlines major arguments explaining requirements of business enterprises to leverage prescriptive analytics aimed at helping the same boost processes.
Slide 9: This slide displays benefits of using prescriptive analytics aimed at helping businesses to meet its long term goals.
Slide 10: This slide outlines business applications of prescriptive analytics aimed at helping them gain competitive advantage using better decision making.
Slide 11: This slide presents industries using prescriptive analytics aimed at improving their performance to achieve long term profitability.
Slide 12: This slide shows title for topics that are to be covered next in the template.
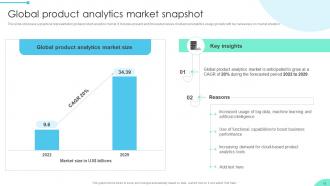
Slide 13: This slide showcase a graphical representation of global prescriptive analytics market. It includes present and forecasted values of prescriptive analytics usage globally.
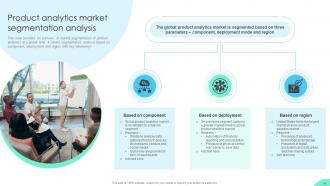
Slide 14: This slide provides an overview of market segmentation of prescriptive analytics at a global level.
Slide 15: This slide displays major growth drivers expected to fuel the growth of global prescriptive analytics market.
Slide 16: This slide outlines major growth restraints that may hinder increased use of prescriptive analytics to boost sales.
Slide 17: This slide shows title for topics that are to be covered next in the template.
Slide 18: This slide displays a flowchart that illustrates working of prescriptive analytics aimed at helping businesses reach recommended actions via what if scenarios.
Slide 19: This slide outlines list of business goals to be achieved by business using prescriptive analytics tools and techniques.
Slide 20: This slide shows title for topics that are to be covered next in the template.
Slide 21: This slide outlines various data collection methods aimed at helping businesses optimize data driven decision making.
Slide 22: This slide provides an introduction to data integration aimed at helping businesses gather and consolidate data for effective decision making.
Slide 23: This slide presents key steps to conduct data integration aimed at helping businesses combine and collaborate data together.
Slide 24: This slide explains extract, transform, load pipeline aimed at helping businesses collect data and store it into warehouse.
Slide 25: This slide also explains extract, load, transform pipeline aimed at helping businesses collect data and store it into warehouse.
Slide 26: This slide presents data streaming approach for executing data integration aimed at delivering data from source to target destination.
Slide 27: This slide explains data application integration aimed at helping businesses support operational needs.
Slide 28: This slide explains data virtualization aimed at providing businesses with unified data view by combing the same from various platforms.
Slide 29: This slide shows title for topics that are to be covered next in the template.
Slide 30: This slide provides a table comparing major AutoML tools aimed at helping businesses choose the appropriate one to develop prescriptive model.
Slide 31: This slide shows title for topics that are to be covered next in the template.
Slide 32: This slide provides an introduction to heuristics analysis aimed ta helping businesses derive practical solutions to data problems.
Slide 33: This slide outlines key advantages of leveraging heuristic analysis aimed at helping businesses improve decision making.
Slide 34: This slide presents major steps to conduct heuristics analysis aimed at helping businesses conduct evaluation and generate meaningful changes.
Slide 35: This slide shows title for topics that are to be covered next in the template.
Slide 36: This slide provides an introduction to simulation analysis aimed ta helping businesses derive best course of action using real world situations.
Slide 37: This slide outlines key advantages of leveraging simulation analysis aimed at helping businesses objectively predict results of the actions before implementation.
Slide 38: This slide displays phases to simulate data aimed at helping businesses understand and solve complex problems.
Slide 39: This slide explains applications of simulation in the realms of business analytics and decision making by testing various scenarios.
Slide 40: This slide shows title for topics that are to be covered next in the template.
Slide 41: This slide provides an introduction to machine learning aimed ta helping businesses derive patterns and connections in the data.
Slide 42: This slide outlines various statistical facts signifying importance of implementing machine learning algorithms in current business landscape.
Slide 43: This slide displays steps to implement machine learning aimed at improving business operations.
Slide 44: This slide highlights workflow of machine learning aimed ta helping businesses adopt the same and improve operations.
Slide 45: This slide outlines real life applications of machine learning in various industries aimed at tailoring services and promoting trust among consumer.
Slide 46: This slide shows title for topics that are to be covered next in the template.
Slide 47: This slide provides an introduction to artificial intelligence in analytics aimed ta helping businesses derive patterns and connections in the data.
Slide 48: This slide outlines key advantages of leveraging artificial intelligence in analytics aimed at helping businesses objectively predict results.
Slide 49: This slide presents applications of AI in data analysis aimed at helping businesses save time and effort.
Slide 50: This slide shows title for topics that are to be covered next in the template.
Slide 51: This slide provides an introduction to decision tree analysis aimed ta helping businesses improve decision making.
Slide 52: This slide outlines key advantages of leveraging decision tree analysis aimed at identifying correct solutions to any problem.
Slide 53: This slide displays applications of decision tree aimed at helping businesses evaluate prospective growth opportunities.
Slide 54: This slide outlines key steps to develop decision tree aimed at helping businesses derive data insights via effective analysis.
Slide 55: This slide shows title for topics that are to be covered next in the template.
Slide 56: This slide provides an introduction to monte carlo simulation aimed ta helping businesses improve decision making by forecasting outcomes.
Slide 57: This slide outlines key advantages of implementing Monte Carlo simulations aimed at analyzing probable events and assess their likelihood.
Slide 58: This slide provides an illustration highlighting working of monte carlo simulation aimed at analyzing complex processes using random samples.
Slide 59: This slide outlines major applications of Monte Carlo simulations aimed at exploring and optimizing decision making strategies.
Slide 60: This slide shows title for topics that are to be covered next in the template.
Slide 61: This slide provides an introduction to genetic algorithms aimed at stimulating natural selection to find optimal solutions.
Slide 62: This slide outlines key advantages of implementing genetic algorithms aimed at processing large amounts of data effectively.
Slide 63: This slide displays major applications of genetic algorithms aimed at exploring and optimizing decision making strategies.
Slide 64: This slide highlights real life examples of genetic algorithms aimed at understanding its extensive use at a global level.
Slide 65: This slide also highlights real life examples of genetic algorithms aimed at understanding its extensive use at a global level.
Slide 66: This slide shows title for topics that are to be covered next in the template.
Slide 67: This slide provides an overview of software tools used in prescriptive analytics to derive best course of action.
Slide 68: This slide presents an overview of advanced analytic tool Alteryx. It covers details regarding unique selling propositions, customer reviews etc.
Slide 69: This slide displays an overview of advanced analytic tool Alteryx. It covers details regarding unique selling propositions, customer reviews etc.
Slide 70: This slide provides overview of Tableau as a data analytics tools providing data visualization features.
Slide 71: This slide displays overview of Google Looker as a data analytics tool. It covers details of Google Looker regarding description, unique selling proposition etc.
Slide 72: This slide provides overview of KNIME as a prescriptive analytics tool to help businesses evaluate its usability.
Slide 73: This slide presents overview of RapidMiner as a prescriptive analytics tool to help businesses evaluate its usability.
Slide 74: This slide provides overview of Azure Machine Learning as a prescriptive analytics tool to help businesses evaluate its usability.
Slide 75: This slide displays a comparison of software tools used by businesses to conduct prescriptive analytics for various operations.
Slide 76: This slide shows title for topics that are to be covered next in the template.
Slide 77: This slide illustrates a flowchart outlining process of deploying machine learning model of prescriptive analytics in business enterprise.
Slide 78: This slide provides a deployment table of prescriptive model aimed at highlighting movement of models through various phases.
Slide 79: This slide outlines major practices which can be undertaken by businesses for effective model deployment.
Slide 80: This slide shows title for topics that are to be covered next in the template.
Slide 81: This slide provides inventory data collected aimed to help businesses evaluate the current scenario.
Slide 82: This slide displays a gap analysis highlighting current scenario of KPIs related to inventory management of ecommerce business.
Slide 83: This slide provides trends in product demand and supply highlighting errors in inventory management.
Slide 84: This slide displays an illustration highlighting application of predictive analytics aimed at helping businesses forecast sales projections.
Slide 85: This slide explains use of inventory software aimed at helping businesses optimize inventory levels using effective analysis.
Slide 86: This slide outlines analytics strategies aimed at helping businesses optimize inventory ad streamline operations.
Slide 87: This slide provides a dashboard highlighting inventory performance aimed at helping businesses streamline operations.
Slide 88: This slide shows title for topics that are to be covered next in the template.
Slide 89: This slide highlights team roles under analytics department aimed at understanding their functioning to achieve business goals and objectives.
Slide 90: This slide also highlights team roles under analytics department aimed at understanding their functioning to achieve business goals and objectives.
Slide 91: This slide outlines training plan aimed at helping employees learn the basics of prescriptive analytics to streamline its usage in the business enterprises.
Slide 92: This slide shows title for topics that are to be covered next in the template.
Slide 93: This slide provides a table highlighting assessment of various cost heads aimed at effectively implementing prescriptive analytics in a business.
Slide 94: This slide illustrates budget allocation towards prescriptive analytics tools and activities in form of a pie chart aimed at identifying and altering cost arrangements.
Slide 95: This slide shows title for topics that are to be covered next in the template.
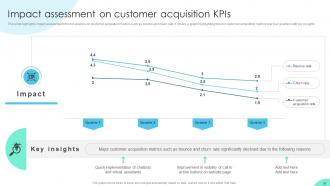
Slide 96: This slide showcases graph highlighting impact analysis of prescriptive analytics on businesses via use of major performance indicators.
Slide 97: This slide shows title for topics that are to be covered next in the template.
Slide 98: This slide illustrates a KPI dashboard highlighting application of prescriptive analytics to analyze emergency room visits of a hospital.
Slide 99: This slide also illustrates a KPI dashboard highlighting application of prescriptive analytics to analyze website visits and sales.
Slide 100: This slide shows title for topics that are to be covered next in the template.
Slide 101: This slide outlines various areas where prescriptive analytics may be implemented to improve the working of healthcare sector.
Slide 102: This slide displays various areas where prescriptive analytics may be implemented to improve the working of sales and marketing sector.
Slide 103: This slide outlines various areas where prescriptive analytics may be implemented to improve the working of supply chain.
Slide 104: This slide displays various areas where prescriptive analytics may be implemented to improve the working of manufacturing sector.
Slide 105: This slide outlines various areas where prescriptive analytics may be implemented to improve the working of finance sector.
Slide 106: This slide displays various areas where prescriptive analytics may be implemented to improve the working of ecommerce sector.
Slide 107: This slide shows all the icons included in the presentation.
Slide 108: This is a Thank You slide with address, contact numbers and email address.
Enhancing Business Insights Implementing Product Analytics In Organizations Data Analytics CD with all 93 slides:
Use our Enhancing Business Insights Implementing Product Analytics In Organizations Data Analytics CD to effectively help you save your valuable time. They are readymade to fit into any presentation structure.
-
The PPT layout is great and it has an effective design that helps in presenting corporate presentations. It's easy to edit and the stunning visuals make it an absolute steal!
-
I am extremely pleased with these PPT slides that we used for our event. They were easy to modify and came out great in all aspects!


