Data analytic powerpoint presentation slides
Discover useful information, inform the conclusion, and support the process of decision making with our Data Analytics ppt. Perform an intelligent market overview of your business focusing on the statistics, trends, market size, key drivers, and market evolution using our inspecting PPT layout. Our business intelligence PowerPoint presentation shows various uses of intelligent data like the development of new products and services, driving process and cost efficiency, finding new customers, analyzing existing customer needs, value, profitability, and the likelihood of a customer to defect, managing risks, driving strategy etc. These integrating PPT slides showcase the business intelligence trends for tools being used in the industry. Focus on the factors like ROI of your marketing strategy, correct data from the ocean of knowledge, determination of revenue for the business, sales strategy, and anticipation of objectives with the smart data PowerPoint slideshow. Besides this, you can also use the KPI metrics PPT presentation to showcase the use of intelligent data, architectural framework, data design, data integration process, business intelligence design, and analytical techniques in your presentation.
You must be logged in to download this presentation.
 Impress your
 audience
Editable
of Time
PowerPoint presentation slides
Grab our Data Analytic PowerPoint Presentation Slides PowerPoint Presentation Slides that are sure to impress executives, inspire team members, and other audience. This PPT is the most comprehensive presentation of intelligent data use you could have asked for your business. We have used beautiful PowerPoint graphics, templates, icons, and diagrams. The content has been well researched by our excellent team of researchers. You can change the colour, fonts, texts, images without any hassle to suit your business needs. Download the presentation, enter your content in the placeholders, and present it with confidence!
People who downloaded this PowerPoint presentation also viewed the following :
Content of this Powerpoint Presentation
Slide 1: This title slide introduces Data Analytic. Add the name of your company here.
Slide 2: This slide contains the Content. It includes - Architectural Framework, Data Design, Advanced Final Output Results, etc.
Slide 3: This is a table of content slide showing the Business Intelligence Market Overview. It includes - BI Market Size, BI Statistics, Key Drivers, etc.
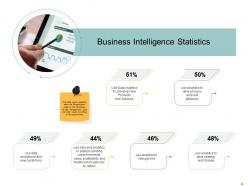
Slide 4: This slide presents the Business Intelligence Statistics. It covers statistics about the BI application usage by the companies for data management.
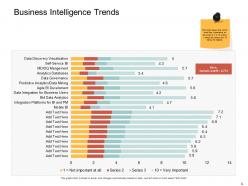
Slide 5: This slide presents the Business Intelligence Trends. It shows which trend has importance on the scale of 1 to 10 was, 1 being the lowest and 10 being the highest.
Slide 6: This slide presents the Business Intelligence Trends for tools being used in Industry. It covers the number and percentage of the users that include BI software’s in their suite of business applications.
Slide 7: This slide presents the Top Five Industries Using Business Intelligence. It shows the leading sector using business intelligence.
Slide 8: This slide presents the Key Drivers. We have listed some of the growth drivers of Business Intelligence and users can change the driving trends as per their knowledge.
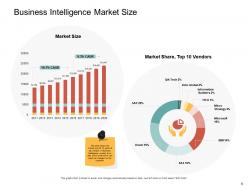
Slide 9: This slide presents the Business Intelligence Market Size. It shows the market size for 10 years & top vendors in the Business Intelligence market.
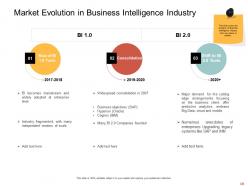
Slide 10: This slide presents the Market Evolution in Business Intelligence Industry. It covers the evolution of the Business Intelligence Industry from one phase to another.
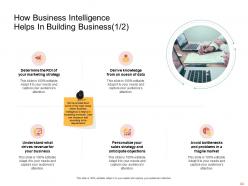
Slide 11: This slide presents How Business Intelligence Helps in Building Business (1/2). We have listed down some of the major areas where Business Intelligence is helpful in increasing revenues.
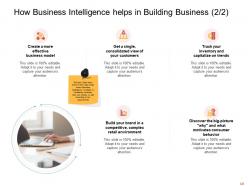
Slide 12: This slide presents How Business Intelligence helps in Building Business (2/2). We have listed down some of the major areas where Business Intelligence is helpful in increasing revenues.
Slide 13: This is a table of content slide showing the Architectural Framework. It includes - Architecture Introduction, Information Architecture, Technology, and Product Architectures, and Data Architecture.
Slide 14: This slide presents the Architecture Introduction. It shows the architecture of the BI application. Users can enter according to their requirements.
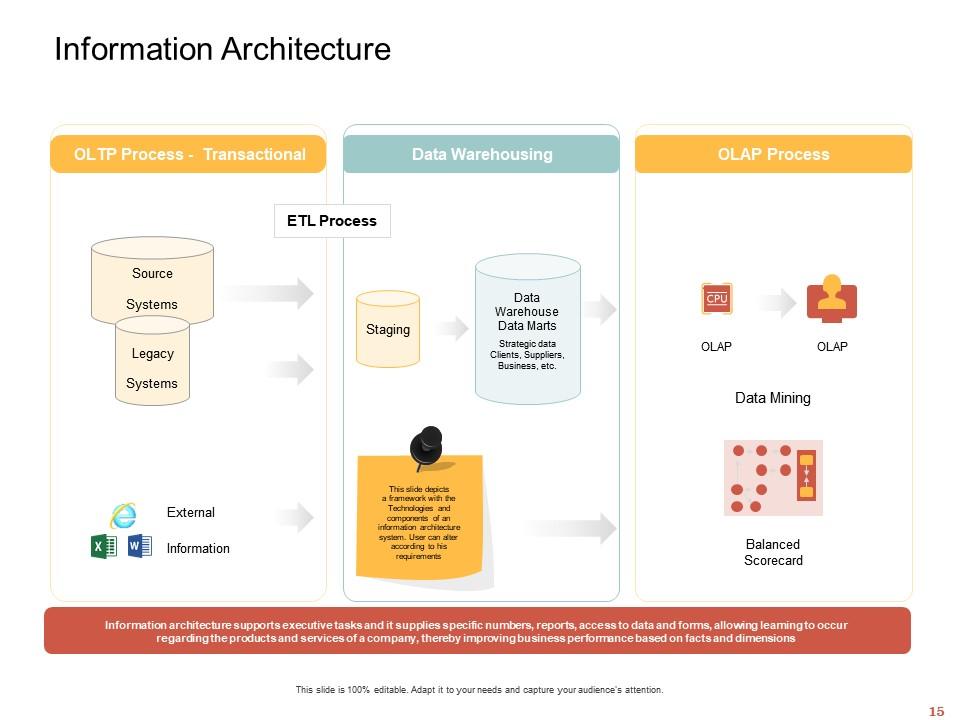
Slide 15: This slide presents the Information Architecture. It depicts a framework with the Technologies and components of an information architecture system.
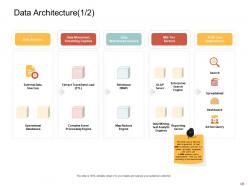
Slide 16: This slide presents the Data Architecture (1/2). It covers that how data is governed i.e., how data is collected, and how it is stored, arranged, integrated, and put to use in data systems and in organizations.
Slide 17: This slide presents the Data Architecture (2/2). It depicts a framework with the Technologies and components of an information architecture system.
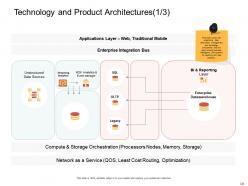
Slide 18: This slide presents the Technology and Product Architectures (1/3). It covers the organizing data, information management, and technology components that are used to build business intelligence (BI) systems for reporting and data analytics.
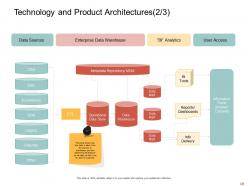
Slide 19: This slide presents the Technology and Product Architectures (2/3). It shows that how data is taken from the sources to the warehouse and then performing BI analytics on the data so that it can be used by customers.
Slide 20: This slide presents the Technology and Product Architectures (3/3). shows that the data is extracted from the source systems with ETL layer and transfer into databases system and on that stored data several BI analytics tools are performed so that we can get presentable data
Slide 21: This is a table of content slide showing the Data Design. It includes - Dimensional Modelling and Foundational Data Modelling.
Slide 22: This slide presents the Foundational Data Modelling (1/2). It shows the logical inter-relationships and data flow between different data elements and documents.
Slide 23: This slide presents the Foundational Data Modelling (2/2).
Slide 24: This slide presents the Data Architecture (1/2). It covers that how data is governed i.e., how data is collected, and how it is stored, arranged, integrated, and put to use in data systems and in organizations.
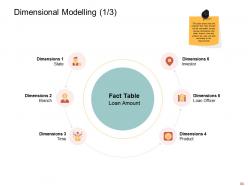
Slide 25: This slide presents the Dimensional Modelling (1/3). It shows that the required fact “loan amount’ can be calculated across various dimensions like state, branch, time and product, etc.
Slide 26: This slide presents the Dimensional Modelling (2/3). It shows that the required fact “sales order’ can be calculated across various dimensions like a store, product, sales order, etc.
Slide 27: This slide presents the Dimensional Modelling (3/3). It shows the dimensional modeling of the tables where PK is the primary key of the specific table and FK is the foreign key in the fact table.
Slide 28: This is a table of content slide showing the Data Integration Design. It includes - Data Integration Model and Data Integration Processes.
Slide 29: This slide presents the Data Integration Processes (1/2). It covers an effective Data Integration process, with extensive planning and design that results in better and more flexible business intelligence and a framework that is future-proofed for additional requirements.
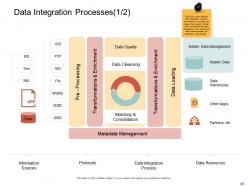
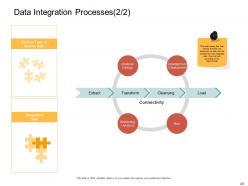
Slide 30: This slide presents the Data Integration Processes (2/2). It shows that how various activities are performed on data and transformed into integrated data.
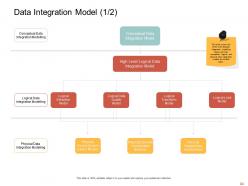
Slide 31: This slide presents the Data Integration Model (1/2). It covers the three main data integration modeling layers and how conceptual, logical, and physical data integration models are broken down.
Slide 32: This slide presents the Data Integration Model (2/2). It shows that the data quality & data integration model contains the ability to produce a clean file, reject file, and reject report that would be instantiated in a selected data integration technology.
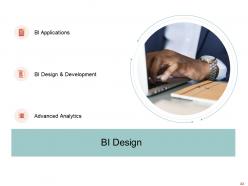
Slide 33: This is a table of content slide showing the BI Design. It includes - BI Applications, Advanced Analytics, and BI Design & Development.
Slide 34: This slide presents the BI Applications (1/2). We have listed some of the data management applications.
Slide 35: This slide presents the BI Applications (2/2). We have listed some of the data management applications.
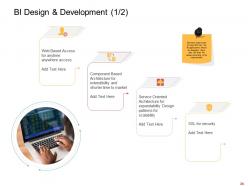
Slide 36: This slide presents the BI Design & Development (1/2). We have listed some of the ways that how the BI applications should be designed.
Slide 37: This slide presents the BI Design & Development (2/2). We have listed down some of the major areas where Business Intelligence is helpful in increasing revenues.
Slide 38: This slide presents the Advanced Analytics Techniques. We have listed the three most commonly used analytics techniques with their description.
Slide 39: This slide presents the Advanced Analytics Methods. We have listed some of the methods of advanced analytics with their description application and reliability rate from 0 to 5.
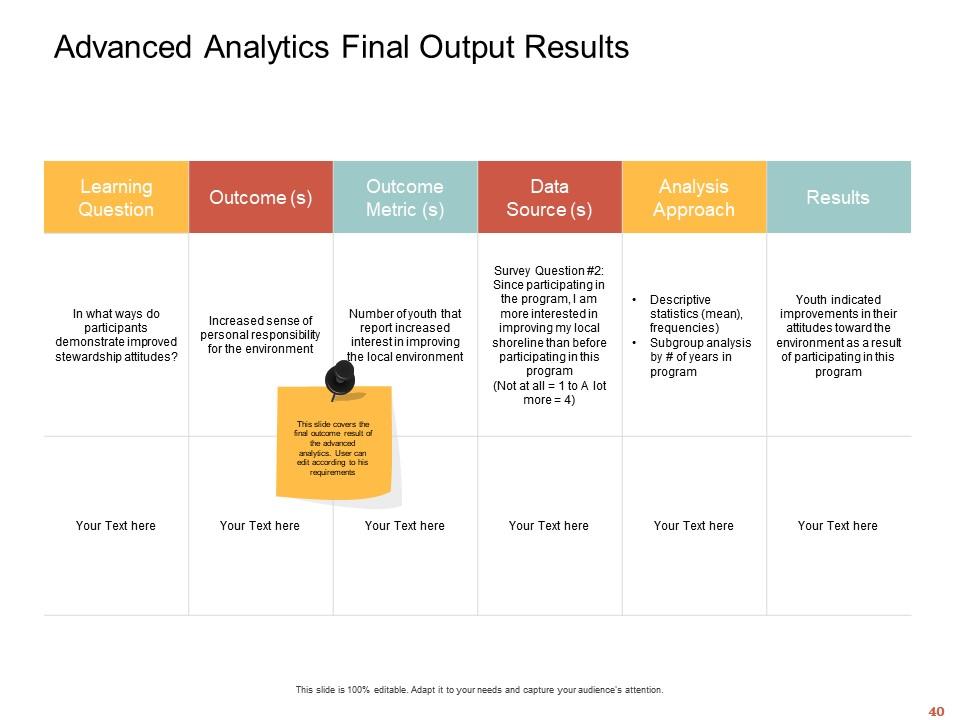
Slide 40: This slide presents the Advanced Analytics Final Output Results. It covers the final outcome result of the advanced analytics.
Slide 41: This is a table of content slide showing the Business Intelligence KPIs & Dashboard. It includes - KPI Dashboards and KPI Metrics.
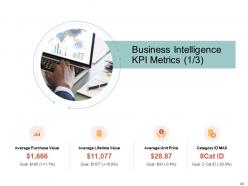
Slide 42: This slide presents the Business intelligence KPI metrics (1/3).
Slide 43: This slide presents the Business intelligence KPI metrics (2/3).
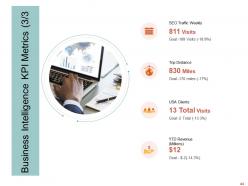
Slide 44: This slide presents the Business intelligence KPI metrics (3/3).
Slide 45: This slide presents the Business Intelligence KPI Dashboard (1/3).
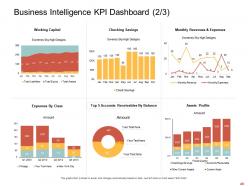
Slide 46: This slide presents the Business Intelligence KPI Dashboard (2/3).
Slide 47: Business Intelligence KPI Dashboard (3/3).
Slide 48: This is the Data Analytic Icons Slide.
Slide 49: This slide introduces the Additional Slides.
Slide 50: This is the Agenda slide.
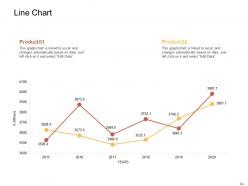
Slide 51: This slide shows a Line Chart that compares 2 products’ data over a timeline of years.
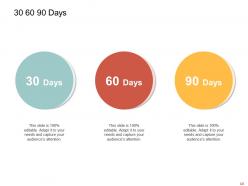
Slide 52: This is a slide with a 30 60 90 Days Plan to set goals for these important intervals.
Slide 53: This slide provides the Mission for the entire company. This includes the vision, the mission, and the goal.
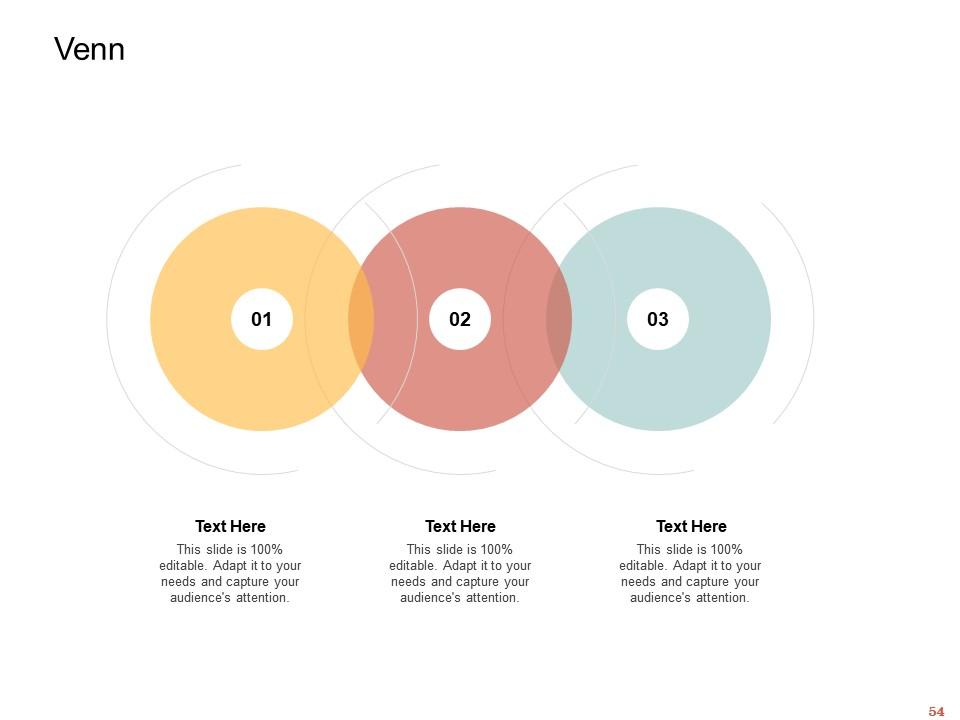
Slide 54: This slide provides a Venn diagram that can be used to show interconnectedness and overlap between various departments, projects, etc.
Slide 55: This is the Circular Diagram slide.
Slide 56: This slide is a Timeline template to showcase the progress of the steps of a project with time.
Slide 57: This is a Thank You slide where details such as the address, contact number, email address are added.
Data analytic powerpoint presentation slides with all 57 slides:
Use our Data Analytic Powerpoint Presentation Slides to effectively help you save your valuable time. They are readymade to fit into any presentation structure.
-
Illustrative design with editable content. Exceptional value for money. Highly pleased with the product.
-
Graphics are very appealing to eyes.
-
Presentation Design is very nice, good work with the content as well.


