Powerpoint Templates and Google slides for Visualizing
Save Your Time and attract your audience with our fully editable PPT Templates and Slides.
-
 IOT Data Visualization Powerpoint Ppt Template Bundles
Engage buyer personas and boost brand awareness by pitching yourself using this prefabricated set. This IOT Data Visualization Powerpoint Ppt Template Bundles is a great tool to connect with your audience as it contains high-quality content and graphics. This helps in conveying your thoughts in a well-structured manner. It also helps you attain a competitive advantage because of its unique design and aesthetics. In addition to this, you can use this PPT design to portray information and educate your audience on various topics. With Twelve slides, this is a great design to use for your upcoming presentations. Not only is it cost-effective but also easily pliable depending on your needs and requirements. As such color, font, or any other design component can be altered. It is also available for immediate download in different formats such as PNG, JPG, etc. So, without any further ado, download it now.
-
 Visual Factory A Kaizen Tool Training Ppt
Presenting Visual Factory A Kaizen Tool. This PPT presentation is meticulously researched and each slide consists of relevant content. Designed by SlideTeams PowerPoint experts, this PPT is fully customizable alter the colors, text, icons, and font size to meet your requirements. Compatible with Google Slides and backed by excellent customer support. Download to present with poise and assurance.
-
 Multiple Types Of Visual Tools Training Ppt
Presenting Multiple Types of Visual Tools. This PPT presentation is thoroughly researched by the experts, and every slide consists of appropriate content. It is well crafted and designed by our PowerPoint specialists. Suitable for use by managers, employees, and organizations. You can edit the color, text, icon, and font size to suit your requirements. The PPT also supports Google Slides. Even Premium Customer Support is also available. Download now and present with confidence.
-
 Major Advantages Of Visual Tools Training Ppt
Presenting Major Advantages of Visual Tools. This PPT presentation is thoroughly researched and each slide consists of appropriate content. Designed by PowerPoint specialists, this PPT is fully customizable alter the colors, text, icons, and font size to meet your needs. Compatible with Google Slides and backed by superior customer support. Download today to deliver your presentation confidently.
-
 Extensive Time Visual Deck PowerPoint Presentation PPT Image ECP
Introducing a Visual PPT on Extensive Time. Every slide in this PowerPoint is meticulously designed by our Presentation Experts. Modify the content as you see fit. Moreover, the PowerPoint Template is suitable for screens and monitors of all dimensions, and even works seamlessly with Google Slides. Download the PPT, make necessary changes, and present with confidence.
-
 Statistics Business Applications Visual Deck PowerPoint Presentation PPT Image ECP
Introducing a Visual PPT on Statistics Business Applications. Every slide in this PowerPoint is meticulously designed by our Presentation Experts. Modify the content as you see fit. Moreover, the PowerPoint Template is suitable for screens and monitors of all dimensions, and even works seamlessly with Google Slides. Download the PPT, make necessary changes, and present with confidence.
-
 Visualization Security Powerpoint Ppt Template Bundles
Introduce your topic and host expert discussion sessions with this Visualization Security Powerpoint Ppt Template Bundles. This template is designed using high-quality visuals, images, graphics, etc, that can be used to showcase your expertise. Different topics can be tackled using the twelve slides included in this template. You can present each topic on a different slide to help your audience interpret the information more effectively. Apart from this, this PPT slideshow is available in two screen sizes, standard and widescreen making its delivery more impactful. This will not only help in presenting a birds-eye view of the topic but also keep your audience engaged. Since this PPT slideshow utilizes well-researched content, it induces strategic thinking and helps you convey your message in the best possible manner. The biggest feature of this design is that it comes with a host of editable features like color, font, background, etc. So, grab it now to deliver a unique presentation every time.
-
 Food Delivery Chart Visual Deck PowerPoint Presentation PPT Image ECP
Presenting Illustrative Presentation on Food Delivery Chart. Each visually striking PPT Slide is designed by our PowerPoint experts. You can add or delete the content as per your need. Compatible with all screen types and monitors. Even Supports Google Slides. Download this professionally designed business presentation, add your content, and present it with confidence.
-
 Industrial Equipment Market Visual Deck PowerPoint Presentation PPT Image ECP
Presenting Illustrative Presentation on Industrial Equipment Market. Crafted by our adept PowerPoint team, every slide demands attention. Tailor the content to align with your agenda, knowing it's suited for all screens, including compatibility with Google Slides. Harness this expertly designed business narrative, incorporate your insights, and stand ready to impress.
-
 Interior Cost Visual Deck PowerPoint Presentation PPT Image ECP
Presenting Illustrative Presentation on Interior Cost. Every eye-catching slide has been crafted by our PowerPoint professionals. Tailor the content to your liking, adding or removing as necessary. Suitable for all screens and monitors, and even compatible with Google Slides. Download this expertly created business presentation, insert your content, and showcase with assurance.
-
 Marketing Practices Visual Deck PowerPoint Presentation PPT Image ECP
Presenting Illustrative Presentation on Marketing Practices. Each impactful PPT slide has been meticulously designed by our team of PowerPoint specialists. Modify the content as you see fit, and it is adaptable to all screen sizes, including Google Slides. Download and integrate your material, then confidently present it.
-
 Robotic Process Automation Human Resources Visual Deck PowerPoint Presentation PPT Image ECP
Presenting Illustrative Presentation on Robotic Process Automation Human Resources. With each compelling slide designed by PowerPoint experts, you can customize the content as required. It seamlessly fits all screens, and yes, it is Google Slides ready. Just download, embed your content, and step forward with confidence to present.
-
 Visual Aids Powerpoint Ppt Template Bundles
Deliver a lucid presentation by utilizing this Visual Aids Powerpoint Ppt Template Bundles. Use it to present an overview of the topic with the right visuals, themes, shapes, and graphics. This is an expertly designed complete deck that reinforces positive thoughts and actions. Use it to provide visual cues to your audience and help them make informed decisions. A wide variety of discussion topics can be covered with this creative bundle such as 4 Purposes, 5 Tips, 5 Types Of Application, 5 Types For Business, Characteristics, Business Presentations. All the tweleve slides are available for immediate download and use. They can be edited and modified to add a personal touch to the presentation. This helps in creating a unique presentation every time. Not only that, with a host of editable features, this presentation can be used by any industry or business vertical depending on their needs and requirements. The compatibility with Google Slides is another feature to look out for in the PPT slideshow.
-
 Visual Marketing Plan Powerpoint Ppt Template Bundles
Deliver a lucid presentation by utilizing this Visual Marketing Plan Powerpoint Ppt Template Bundles. Use it to present an overview of the topic with the right visuals, themes, shapes, and graphics. This is an expertly designed complete deck that reinforces positive thoughts and actions. Use it to provide visual cues to your audience and help them make informed decisions. A wide variety of discussion topics can be covered with this creative bundle such as Social Media Marketing, Visual Marketing Strategies, Visual Content Strategic Approaches, Content Marketing Plan, Digital Marketing Plan. All the twelve slides are available for immediate download and use. They can be edited and modified to add a personal touch to the presentation. This helps in creating a unique presentation every time. Not only that, with a host of editable features, this presentation can be used by any industry or business vertical depending on their needs and requirements. The compatibility with Google Slides is another feature to look out for in the PPT slideshow.
-
 AI Recruiting Software Visual Deck PowerPoint Presentation PPT Image ECP
Presenting Illustrative Presentation on AI Recruiting Software. Each visually striking PPT Slide is designed by our PowerPoint experts. You can add or delete the content as per your need. Compatible with all screen types and monitors. Even Supports Google Slides. Download this professionally designed business presentation, add your content, and present it with confidence.
-
 Type Of Sexual Harassment Visual Training Ppt
Presenting Visual Harassment as a type of Sexual Harassment. These slides are 100 percent made in PowerPoint and are compatible with all screen types and monitors. They also support Google Slides. Premium Customer Support is available. Suitable for use by managers, employees, and organizations. These slides are easily customizable. You can edit the color, text, icon, and font size to suit your requirements.
-
 Visual Strategic Planning Powerpoint Ppt Template Bundles
Engage buyer personas and boost brand awareness by pitching yourself using this prefabricated set. This Visual Strategic Planning Powerpoint Ppt Template Bundles is a great tool to connect with your audience as it contains high-quality content and graphics. This helps in conveying your thoughts in a well-structured manner. It also helps you attain a competitive advantage because of its unique design and aesthetics. In addition to this, you can use this PPT design to portray information and educate your audience on various topics. With twelve slides, this is a great design to use for your upcoming presentations. Not only is it cost-effective but also easily pliable depending on your needs and requirements. As such color, font, or any other design component can be altered. It is also available for immediate download in different formats such as PNG, JPG, etc. So, without any further ado, download it now.
-
 Change management consulting 5 stages visual representations of inflows and outflows powerpoint slides
We are proud to present our change management consulting 5 stages visual representations of inflows and outflows powerpoint slides. Our marketing Powerpoint Templates are created with admirable insight. Use them and give your group a sense of your logical mind. Use our business Powerpoint Templates to bullet point your ideas. See them fall into place one by one.
-
 5 Step Approaches Ppt Visual Aids Infographic Template Perform Gap Analysis
This PPT deck displays fourteen slides with in depth research. Our topic oriented 5 Step Approaches Ppt Visual Aids Infographic Template Perform Gap Analysis presentation deck is a helpful tool to plan, prepare, document and analyse the topic with a clear approach. We provide a ready to use deck with all sorts of relevant topics subtopics templates, charts and graphs, overviews, analysis templates. Outline all the important aspects without any hassle. It showcases of all kind of editable templates infographs for an inclusive and comprehensive 5 Step Approaches Ppt Visual Aids Infographic Template Perform Gap Analysis presentation. Professionals, managers, individual and team involved in any company organization from any field can use them as per requirement.
-
 Comparing two products secure protection visual drive space infographic antivirus
If you require a professional template with great design,then this Comparing Two Products Secure Protection Visual Drive Space Infographic Antivirus is an ideal fit for you. Deploy it to enthrall your audience and increase your presentation threshold with the right graphics,images,and structure. Portray your ideas and vision using fourteen slides included in this complete deck. This template is suitable for expert discussion meetings presenting your views on the topic. With a variety of slides having the same thematic representation,this template can be regarded as a complete package. It employs some of the best design practices,so everything is well-structured. Not only this,it responds to all your needs and requirements by quickly adapting itself to the changes you make. This PPT slideshow is available for immediate download in PNG,JPG,and PDF formats,further enhancing its usability. Grab it by clicking the download button.
-
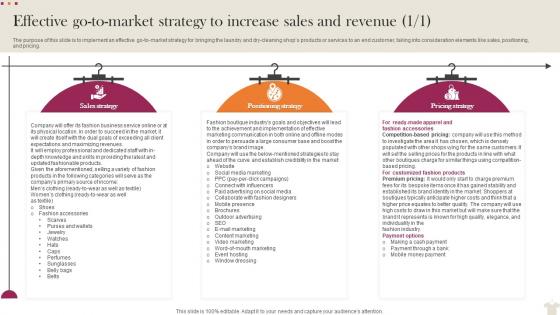 Effective Go To Market Strategy To Increase Sales Visual Merchandising Business Plan BP SS
The purpose of this slide is to implement an effective go to market strategy for bringing the laundry and dry cleaning shops products or services to an end customer, taking into consideration elements like sales, positioning, and pricing.Increase audience engagement and knowledge by dispensing information using Effective Go To Market Strategy To Increase Sales Visual Merchandising Business Plan BP SS. This template helps you present information on three stages. You can also present information on Maximizing Revenues, Given Aforementioned, Content Marketing using this PPT design. This layout is completely editable so personaize it now to meet your audiences expectations.
-
 1013 business ppt diagram 8 stages of process visualization powerpoint template
We are proud to present our 1013 business ppt diagram 8 stages of process visualization powerpoint template. Dig In To Our Vast Array Of Arrows Power Point Templates. Be Sure To Come With Many That Fit Your Need Perfectly. Unleash The Value Of Your Experience With Our Process Power Point Templates. Educate Your Team With The Knowledge You Have Gained.
-
 1013 busines ppt diagram 8 stages of process visualization powerpoint template
We are proud to present our 1013 busines ppt diagram 8 stages of process visualization powerpoint template. Dig In To Our Vast Array Of Arrows Power Point Templates. Be Sure To Come With Many That Fit Your Need Perfectly. Unleash The Value Of Your Experience With Our Process Power Point Templates. Educate Your Team With The Knowledge You Have Gained.
-
 Key Statistics Associated With Fashion Industry Visual Merchandising Business Plan BP SS
This slide highlights the thorough assessment of a market within the fashion industry. It will help get valuable insights and project the success that the company expects while introducing its brand and products to consumers within the market. It will also reflect statistics related to the online fashion retail market, fashion accessories, and footwear market.Present the topic in a bit more detail with this Key Statistics Associated With Fashion Industry Visual Merchandising Business Plan BP SS. Use it as a tool for discussion and navigation on Ecommerce Sales, Fashion Retail Sales, Compounded Annual. This template is free to edit as deemed fit for your organization. Therefore download it now.
-
 1013 busines ppt diagram 7 stages visual illustration powerpoint template
We are proud to present our 1013 busines ppt diagram 7 stages visual illustration powerpoint template. Whatever The Nuance You Want To Project. We Have A Arrows Power Point Templates That Will Get It Across. Create A Connection With Your Audience Using Our Advertising Power Point Templates. Transfer Your Depth Of Knowledge Clearly Across To Them.
-
 Bigdata analytics visualization techniques technologies sources monitoring data
It has PPT slides covering wide range of topics showcasing all the core areas of your business needs. This complete deck focuses on Bigdata Analytics Visualization Techniques Technologies Sources Monitoring Data and consists of professionally designed templates with suitable graphics and appropriate content. This deck has total of twelve slides. Our designers have created customizable templates for your convenience. You can make the required changes in the templates like colour, text and font size. Other than this, content can be added or deleted from the slide as per the requirement. Get access to this professionally designed complete deck PPT presentation by clicking the download button below.
-
 Data Analysis Business Evaluation Process Visualization Presentation
Deliver a credible and compelling presentation by deploying this Data Analysis Business Evaluation Process Visualization Presentation. Intensify your message with the right graphics, images, icons, etc. presented in this complete deck. This PPT template is a great starting point to convey your messages and build a good collaboration. The twelve slides added to this PowerPoint slideshow helps you present a thorough explanation of the topic. You can use it to study and present various kinds of information in the form of stats, figures, data charts, and many more. This Data Analysis Business Evaluation Process Visualization Presentation PPT slideshow is available for use in standard and widescreen aspects ratios. So, you can use it as per your convenience. Apart from this, it can be downloaded in PNG, JPG, and PDF formats, all completely editable and modifiable. The most profound feature of this PPT design is that it is fully compatible with Google Slides making it suitable for every industry and business domain.
-
 Visual Icon Representation Performance Presentation Optical
Deliver a lucid presentation by utilizing this Visual Icon Representation Performance Presentation Optical. Use it to present an overview of the topic with the right visuals, themes, shapes, and graphics. This is an expertly designed complete deck that reinforces positive thoughts and actions. Use it to provide visual cues to your audience and help them make informed decisions. A wide variety of discussion topics can be covered with this creative bundle such as Visual Icon, Representation, Performance, Presentation, Optical. All the twelve slides are available for immediate download and use. They can be edited and modified to add a personal touch to the presentation. This helps in creating a unique presentation every time. Not only that, with a host of editable features, this presentation can be used by any industry or business vertical depending on their needs and requirements. The compatibility with Google Slides is another feature to look out for in the PPT slideshow.
-
 Five workstreams center visual business device sales effective infographic
Engage buyer personas and boost brand awareness by pitching yourself using this prefabricated set. This Five Workstreams Center Visual Business Device Sales Effective Infographic is a great tool to connect with your audience as it contains high-quality content and graphics. This helps in conveying your thoughts in a well-structured manner. It also helps you attain a competitive advantage because of its unique design and aesthetics. In addition to this, you can use this PPT design to portray information and educate your audience on various topics. With twelve slides, this is a great design to use for your upcoming presentations. Not only is it cost-effective but also easily pliable depending on your needs and requirements. As such color, font, or any other design component can be altered. It is also available for immediate download in different formats such as PNG, JPG, etc. So, without any further ado, download it now.
-
 Visual merchandising traffic building profit generating grid layout
Engage buyer personas and boost brand awareness by pitching yourself using this prefabricated set. This Visual Merchandising Traffic Building Profit Generating Grid Layout is a great tool to connect with your audience as it contains high-quality content and graphics. This helps in conveying your thoughts in a well-structured manner. It also helps you attain a competitive advantage because of its unique design and aesthetics. In addition to this, you can use this PPT design to portray information and educate your audience on various topics. With twelve slides, this is a great design to use for your upcoming presentations. Not only is it cost-effective but also easily pliable depending on your needs and requirements. As such color, font, or any other design component can be altered. It is also available for immediate download in different formats such as PNG, JPG, etc. So, without any further ado, download it now.
-
 Job Roles And Responsibilities Of Boutique Visual Merchandising Business Plan BP SS
This slide highlights the job roles and responsibilities of fashion boutique key management people to determine what kind of job has to be done and what kind of person is ideal for getting the job done. It includes the organizational hierarchy and reporting system to the candidate.Deliver an outstanding presentation on the topic using this Job Roles And Responsibilities Of Boutique Visual Merchandising Business Plan BP SS. Dispense information and present a thorough explanation of General Manager, Administration Manager, Market Researcher using the slides given. This template can be altered and personalized to fit your needs. It is also available for immediate download. So grab it now.
-
 Business process flow chart example visualization of data analysis 6 stages powerpoint slides
We are proud to present our business process flow chart example visualization of data analysis 6 stages powerpoint slides. The above PowerPoint diagram demonstrates distribution of data. Use this diagram for business activity results, financial report, and demographic analysis. Our PPTs offer you the needful to organize your thoughts. Use them to list out your views in a logical sequence.
-
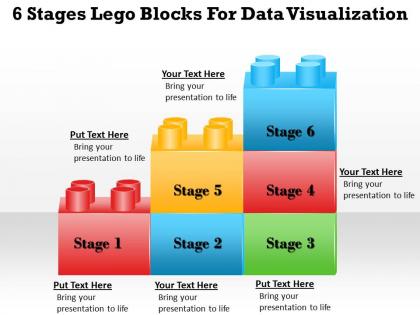 1013 business ppt diagram 6 stages lego blocks for data visualization powerpoint template
We are proud to present our 1013 business ppt diagram 6 stages lego blocks for data visualization powerpoint template. You Have All The Ingredients To Create The Taste Of Success. Garnish Your Recipe With Our Concepts Power Point Templates And Enhance Its Flavor. Our Shapes Power Point Templates Are Created By Innovative Young Minds. Guaranteed To Fit Presentations Of All Kinds.
-
 Percentage circle visual for corporate financial planning infographic template
This is a single slide titled Percentage Circle Visual For Corporate Financial Planning Infographic Template. It is crafted using high quality vector based visuals that are 100 percent editable and available for immediate download in standard and widescreen aspect ratios.
-
 Percentage circle visual for financial data analysis infographic template
This is our Percentage Circle Visual For Financial Data Analysis Infographic Template designed in PowerPoint, however, you can also access it in Google Slides. It comes in two aspect ratios standard and widescreen, with fully editable visual content.
-
 Circular progress bar visual for forecasting expected results infographic template
This is a single slide titled Circular Progress Bar Visual For Forecasting Expected Results Infographic Template. It is crafted using high quality vector based visuals that are 100 percent editable and available for immediate download in standard and widescreen aspect ratios.
-
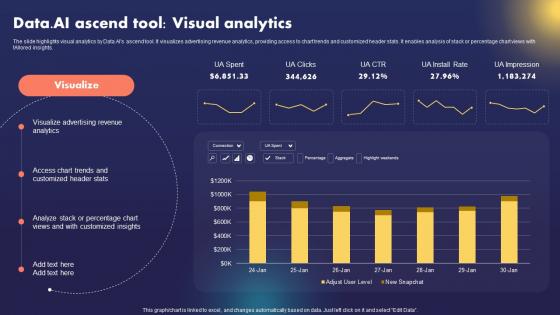 Data AI Artificial Intelligence Business Platform Data AI Ascend Tool Visual Analytics AI SS
The slide highlights visual analytics by Data.AIs ascend tool. It visualizes advertising revenue analytics, providing access to chart trends and customized header stats. It enables analysis of stack or percentage chart views with tAIlored insights. Deliver an outstanding presentation on the topic using this Data AI Artificial Intelligence Business Platform Data AI Ascend Tool Visual Analytics AI SS. Dispense information and present a thorough explanation of Visual Analytics By Data AI, Visualizes Advertising, Revenue Analytics, Customized Header Stats using the slides given. This template can be altered and personalized to fit your needs. It is also available for immediate download. So grab it now.
-
 Key Indicator Dashboard For IOT Data Visualization
This slide represents IOT data visualization key indicator dashboard. This slide includes traffic loops, speed of cars average, patterns as per weekly and hourly and date wise traffic density low or high. Introducing our Key Indicator Dashboard For IOT Data Visualization set of slides. The topics discussed in these slides are Key Benefits With Data Visualization In IOT. This is an immediately available PowerPoint presentation that can be conveniently customized. Download it and convince your audience.
-
 Comparative Balance Sheet Statement For Visual Merchandising Business Plan BP SS
The slides cover the snapshot of the companys financial position at a specific time by showing the details of the companys assets along with its liabilities and owners capital from the historical year 2023 till the forecasted the year 2027.Present the topic in a bit more detail with this Comparative Balance Sheet Statement For Visual Merchandising Business Plan BP SS. Use it as a tool for discussion and navigation on Accounts Receivables, Purchase Computer, Retained Earnings. This template is free to edit as deemed fit for your organization. Therefore download it now.
-
 Consolidated Statements Of Cash Flows Visual Merchandising Business Plan BP SS
The slides highlight the companys cash flow statement to provide a detailed picture of what happened to a businesss cash during a specified period. It represents net cash flow from operating, investing, and financing activities from the historical year 2023 till the forecasted year 2027.Deliver an outstanding presentation on the topic using this Consolidated Statements Of Cash Flows Visual Merchandising Business Plan BP SS. Dispense information and present a thorough explanation of Investment Computer, Financing Activities, Computer Equipment using the slides given. This template can be altered and personalized to fit your needs. It is also available for immediate download. So grab it now.
-
 Projected Profit And Loss Account Statement Visual Merchandising Business Plan BP SS
The slides provide a glimpse of the projected profit and loss statement to visualize the fashion boutiques financial performance for the next five years. The key components are total revenue from operations, gross profit, EBITDA, etcPresent the topic in a bit more detail with this Projected Profit And Loss Account Statement Visual Merchandising Business Plan BP SS. Use it as a tool for discussion and navigation on Administrative Expenses, Maintenance Expenses, Development Expenses. This template is free to edit as deemed fit for your organization. Therefore download it now.
-
 Scenario Analysis With Optimistic Pessimistic Visual Merchandising Business Plan BP SS
The purpose of this slide is to examine the effects of potential future events on the companys performance by considering different outcomes, including optimistic, pessimistic, and realistic case scenarios.Present the topic in a bit more detail with this Scenario Analysis With Optimistic Pessimistic Visual Merchandising Business Plan BP SS. Use it as a tool for discussion and navigation on Estimated Annual, Annual Revenue, Annual Profit. This template is free to edit as deemed fit for your organization. Therefore download it now.
-
 Target Customer Profile For Fashion Boutique Visual Merchandising Business Plan BP SS
This slide covers an assessment of how the companys products and services will fit into a particular market and where they will acquire the most traction with customers. It includes customers such as men and women of age 18 and above that need customized and latest fashion styles.Present the topic in a bit more detail with this Target Customer Profile For Fashion Boutique Visual Merchandising Business Plan BP SS. Use it as a tool for discussion and navigation on Expansion Fashion, Natural Materials, Regularly Releasing. This template is free to edit as deemed fit for your organization. Therefore download it now.
-
 Digital Transformation Dashboard To Visualize Challenges How Digital Transformation DT SS
This slide presents a digital transformation dashboard that help visualize and track digital and iteration challenges. It monitors KPIs such as iterate, deliver, platform adoption , innovation index, challenges conversion rate, challenges success and average time spent. Present the topic in a bit more detail with this Digital Transformation Dashboard To Visualize Challenges How Digital Transformation DT SS. Use it as a tool for discussion and navigation on Challenge Conversion Rate, Platform Adoption Index, Challenge Count. This template is free to edit as deemed fit for your organization. Therefore download it now.
-
 Visual Analytics Dashboard To Boost Marketer Roi
This slide outlines the visual analytics dashboard for marketers. It includes actionable insights and comprehensive view of marketing performance. Presenting our well structured Visual Analytics Dashboard To Boost Marketer Roi. The topics discussed in this slide are Analytics, Dashboard, Performance. This is an instantly available PowerPoint presentation that can be edited conveniently. Download it right away and captivate your audience.
-
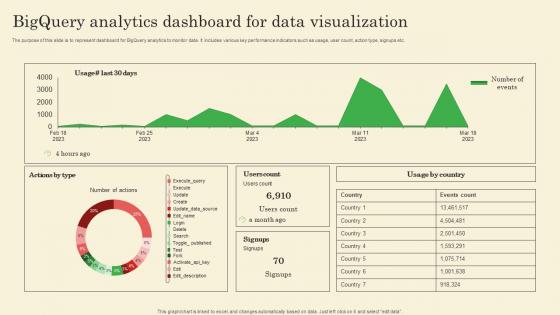 Bigquery Analytics Dashboard For Data Visualization
The purpose of this slide is to represent dashboard for BigQuery analytics to monitor data. It includes various key performance indicators such as usage, user count, action type, signups etc. Introducing our Bigquery Analytics Dashboard For Data Visualization set of slides. The topics discussed in these slides are Users Count, Usage By Country. This is an immediately available PowerPoint presentation that can be conveniently customized. Download it and convince your audience.
-
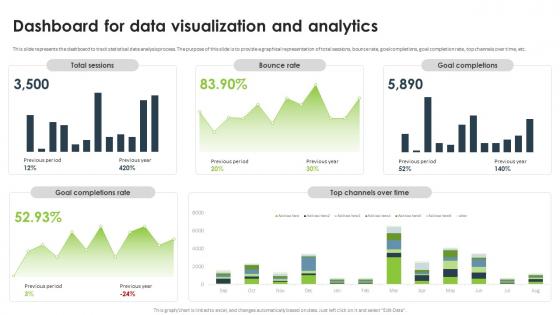 Statistical Analysis For Data Driven Dashboard For Data Visualization And Analytics
This slide represents the dashboard to track statistical data analysis process. The purpose of this slide is to provide a graphical representation of total sessions, bounce rate, goal completions, goal completion rate, top channels over time, etc. Present the topic in a bit more detail with this Statistical Analysis For Data Driven Dashboard For Data Visualization And Analytics. Use it as a tool for discussion and navigation on Data Visualization And Analytics, Bounce Rate, Goal Completions, Goal Completion Rate. This template is free to edit as deemed fit for your organization. Therefore download it now.
-
 Revenue Model IBM Business Model Ppt Visual Aids BMC SS
This slide showcases how the company earns revenue from the business. It includes revenue streams such as individual, business and international transaction fees, merchant transaction fees, PayPal credit and foreign currency exchange. Present the topic in a bit more detail with this Revenue Model IBM Business Model Ppt Visual Aids BMC SS. Use it as a tool for discussion and navigation on Growth Contributors, Software Licensing Subscription, Consulting Services Infrastructure. This template is free to edit as deemed fit for your organization. Therefore download it now.
-
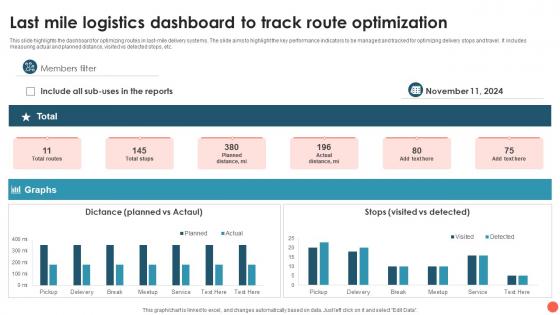 Last Mile Logistics Dashboard To Track Route Optimization Infographic Template Visual Aids
This slide highlights the dashboard for optimizing routes in last mile delivery systems. The slide aims to highlight the key performance indicators to be managed and tracked for optimizing delivery stops and travel. It includes measuring actual and planned distance, visited vs detected stops, etc. Presenting our well structured Last Mile Logistics Dashboard To Track Route Optimization Infographic Template Visual Aids. The topics discussed in this slide are Include Logistics Dashboard, Distance, Stops. This is an instantly available PowerPoint presentation that can be edited conveniently. Download it right away and captivate your audience.
-
 Digital Marketing Data Visualization Dashboard
This slide depicts data visualization KPI dashboard on digital marketing to help big data understand patterns, trends, and correlations that might be undetected in text-based data. It includes elements such as conversions, cost per conversion, etc. Introducing our Digital Marketing Data Visualization Dashboard set of slides. The topics discussed in these slides are Digital Marketing, Data Visualization Dashboard.This is an immediately available PowerPoint presentation that can be conveniently customized. Download it and convince your audience.
-
 Global Market Size Graph Of Data Visualization Tools
This slide depicts data visualization market size tools to provide details about interpreting information in visual format. It includes bases such as key drivers, key players, and restraining factors. Presenting our well structured Global Market Size Graph Of Data Visualization Tools. The topics discussed in this slide are Global Data Visualization Tools, Market Size, Key Drivers, Key Players, Restraining Factors. This is an instantly available PowerPoint presentation that can be edited conveniently. Download it right away and captivate your audience.
-
 Cash Flow Nestle Company Profile Ppt Visual Aids Example 2015 CP SS
The following slide outlines cash flow of Nestle company for six consecutive years i.e. from 2017 to 2022. It showcases cash flows from operating activities, investing activities and financing activities. Deliver an outstanding presentation on the topic using this Cash Flow Nestle Company Profile Ppt Visual Aids Example 2015 CP SS Dispense information and present a thorough explanation of Cash Flow using the slides given. This template can be altered and personalized to fit your needs. It is also available for immediate download. So grab it now.
-
 Commercial Vehicles Tata Motors Company Profile Ppt Icon Visual Aids CP SS
This slide showcases the commercial vehicles segments. It shows brief introduction to commercial vehicle segment, its percentage share of consolidated revenues, financial targets, 21 new CVs unveiled and powertrain mix of 2022. Present the topic in a bit more detail with this Commercial Vehicles Tata Motors Company Profile Ppt Icon Visual Aids CP SS Use it as a tool for discussion and navigation on Financial Targets, Powertrain Mix, Percentage This template is free to edit as deemed fit for your organization. Therefore download it now.
-
 Store Split By Regions Retail Store Company Profile Ppt Layouts Visual Aids CP SS V
Mentioned slide displays company stores split by geographic regions. It includes regions such as Japan, greater China, South Korea, South Asia, South East Asia, Oceania, North America, and Europe. Deliver an outstanding presentation on the topic using this Store Split By Regions Retail Store Company Profile Ppt Layouts Visual Aids CP SS V Dispense information and present a thorough explanation of Store Split, Regions using the slides given. This template can be altered and personalized to fit your needs. It is also available for immediate download. So grab it now.
-
 Net Sales Split By Regional Distribution Amazon Company Profile Ppt File Visual Aids CP SS
This slide outlines overview of net sales of Amazon company based on regional distribution. It consists of regions such as United States, Germany, United Kingdom, Japan and Rest of the world. Deliver an outstanding presentation on the topic using this Net Sales Split By Regional Distribution Amazon Company Profile Ppt File Visual Aids CP SS Dispense information and present a thorough explanation of Net Sales Split, Regional Distribution using the slides given. This template can be altered and personalized to fit your needs. It is also available for immediate download. So grab it now.
-
 Dashboard For Tracking Visualization Security In Softwares
This slides showcases KPI tracking dashboard for visualization security. The main purpose of this template is to showcase various threats and detection. This includes detection threat, threat per day, files, blocked, risk, etc. Introducing our Dashboard For Tracking Visualization Security In Softwares set of slides. The topics discussed in these slides are Detection Threat, Threat Per Day, Service Running. This is an immediately available PowerPoint presentation that can be conveniently customized. Download it and convince your audience.
-
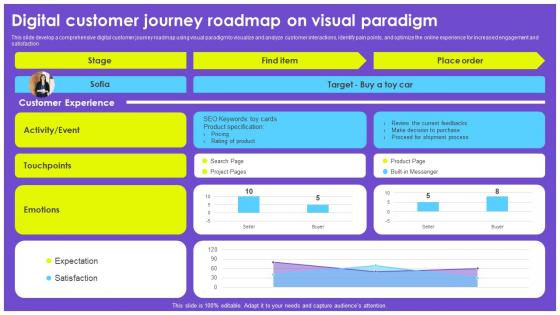 Digital Customer Journey Roadmap On Visual Paradigm
This slide develop a comprehensive digital customer journey roadmap using visual paradigm to visualize and analyze customer interactions, identify pain points, and optimize the online experience for increased engagement and satisfaction. Introducing our Digital Customer Journey Roadmap On Visual Paradigm set of slides. The topics discussed in these slides are Find Item, Place Order, Stage, Target. This is an immediately available PowerPoint presentation that can be conveniently customized. Download it and convince your audience.
-
 Visualising Sensor Data In Robotics Dashboard Sensory Revolution Exploring The Role RB SS
This slide showcases dashboard for working of visual sensor in an organisation. It covers aspects related to temperature, humidity, touch, etc. Deliver an outstanding presentation on the topic using this Visualising Sensor Data In Robotics Dashboard Sensory Revolution Exploring The Role RB SS. Dispense information and present a thorough explanation of Light Strength, Humidity, Distance using the slides given. This template can be altered and personalized to fit your needs. It is also available for immediate download. So grab it now.
-
 Use Of Visual Collaborative Whiteboards For Communication Mastery Fostering Strategic CM SS
This slide presents how to use visual collaborative whiteboards for impactful meetings on change management, helpful in communicating with teams remotely. It includes some best practices such as visualizing ideas through charts, creating real time reports, etc. Present the topic in a bit more detail with this Use Of Visual Collaborative Whiteboards For Communication Mastery Fostering Strategic CM SS. Use it as a tool for discussion and navigation on Digital Whiteboard For Virtual Meetings, Revenue, Change Management. This template is free to edit as deemed fit for your organization. Therefore download it now.
-
 Statistics Showcasing Benefits Of Data Visualization
This slide showcases the statistics representing benefits of data visualization which helps an organization to provide deeper insights of conditions occurring within different information sets. It include details such as provides actionable items, etc. Introducing our Statistics Showcasing Benefits Of Data Visualization set of slides. The topics discussed in these slides are Data Visualization, Statistics Showcasing, Actionable ItemsThis is an immediately available PowerPoint presentation that can be conveniently customized. Download it and convince your audience.


