Powerpoint Templates and Google slides for Tracking And Analytics
Save Your Time and attract your audience with our fully editable PPT Templates and Slides.
-
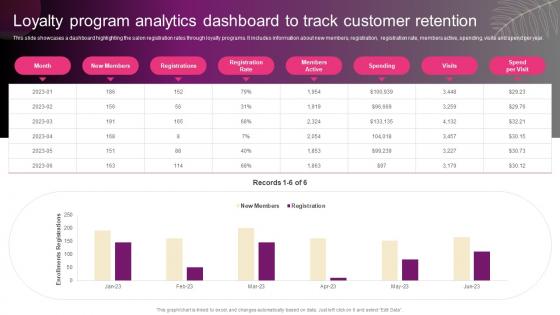
 Loyalty Program Analytics Dashboard To Track New Hair And Beauty Salon Marketing Strategy SS
This slide showcases a dashboard highlighting the salon registration rates through loyalty programs. It includes information about new members, registration, registration rate, members active, spending, visits and spend per year. Present the topic in a bit more detail with this Loyalty Program Analytics Dashboard To Track New Hair And Beauty Salon Marketing Strategy SS. Use it as a tool for discussion and navigation on Loyalty Program, Analytics Dashboard, Customer Retention. This template is free to edit as deemed fit for your organization. Therefore download it now.
-
 Social Media Analytics With Tools Dashboards For Social Media Analytics Tracking And Monitoring
This slide depicts the dashboard for Social Media Analytics insights. The purpose of this slide is to highlight insights such as brand awareness, audience growth, post-engagement rate, provider analytics, etc. Present the topic in a bit more detail with this Social Media Analytics With Tools Dashboards For Social Media Analytics Tracking And Monitoring. Use it as a tool for discussion and navigation on Dashboards For Social Media, Analytics Tracking And Monitoring, Brand Awareness, Audience Growth, Post Engagement Rate. This template is free to edit as deemed fit for your organization. Therefore download it now.
-
 Analytics Dashboard Tracking Effective Energy Monitoring And Enabling Growth Centric DT SS
This slide presents how power companies can utilize analytics-driven insights for monitoring equipment health and performance. It includes predictive analytics, anomaly detection, trend analysis, and prescriptive analytics. Deliver an outstanding presentation on the topic using this Analytics Dashboard Tracking Effective Energy Monitoring And Enabling Growth Centric DT SS Dispense information and present a thorough explanation of Solar Energy, Carbon Savings, Financial Savings using the slides given. This template can be altered and personalized to fit your needs. It is also available for immediate download. So grab it now.
-
 Analytics Tracking Successful Blogging In Powerpoint And Google Slides Cpb
Presenting Analytics Tracking Successful Blogging In Powerpoint And Google Slides Cpb slide which is completely adaptable. The graphics in this PowerPoint slide showcase three stages that will help you succinctly convey the information. In addition, you can alternate the color, font size, font type, and shapes of this PPT layout according to your content. This PPT presentation can be accessed with Google Slides and is available in both standard screen and widescreen aspect ratios. It is also a useful set to elucidate topics like Analytics Tracking Successful Blogging. This well-structured design can be downloaded in different formats like PDF, JPG, and PNG. So, without any delay, click on the download button now.
-
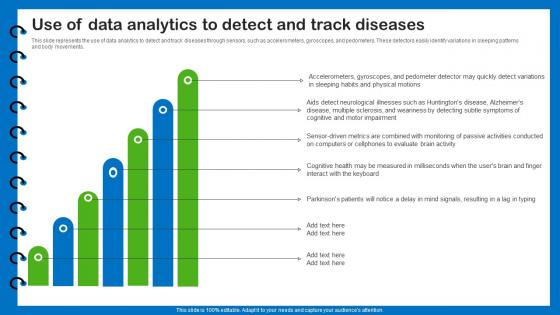
 Wearable Sensors Use Of Data Analytics To Detect And Track Diseases
This slide represents the use of data analytics to detect and track diseases through sensors, such as accelerometers, gyroscopes, and pedometers. These detectors easily identify variations in sleeping patterns and body movements. Increase audience engagement and knowledge by dispensing information using Wearable Sensors Use Of Data Analytics To Detect And Track Diseases. This template helps you present information on six stages. You can also present information on Analytics, Accelerometers, Measured using this PPT design. This layout is completely editable so personaize it now to meet your audiences expectations.
-
 Tools For Inside Sales Team Call Tracking And Analytics Fostering Growth Through Inside SA SS
This slide showcases a comparison of sales call tracking tools to enhance outreach efforts, including key elements such as tools, features, pricing, and pros. Introducing Tools For Inside Sales Team Call Tracking And Analytics Fostering Growth Through Inside SA SS to increase your presentation threshold. Encompassed with Three stages, this template is a great option to educate and entice your audience. Dispence information on Features, Pricing, Pros using this template. Grab it now to reap its full benefits.
-
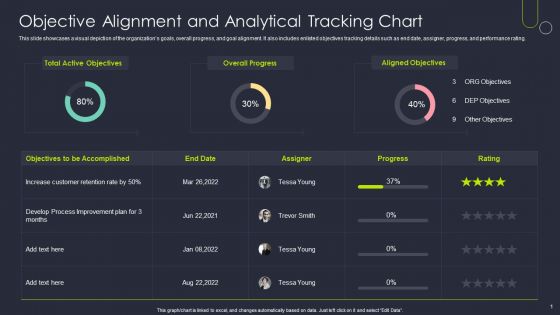
 Objective Alignment And Analytical Tracking Chart
This slide showcases a visual depiction of the organizations goals, overall progress, and goal alignment. It also includes enlisted objectives tracking details such as end date, assigner, progress, and performance rating. Presenting our well-structured Objective Alignment And Analytical Tracking Chart. The topics discussed in this slide are Overall Progress, Aligned Objectives, Total Active Objectives. This is an instantly available PowerPoint presentation that can be edited conveniently. Download it right away and captivate your audience.
-
 BI And Web Analytics Dashboard To Track Marketing KPIS
In this business intelligence dashboard is displayed to help company in real time monitoring and reporting of relevant details. It includes KPIs such as visits, average session duration, bounce rate, page views, traffic sources, etc. Introducing our BI And Web Analytics Dashboard To Track Marketing KPIS set of slides. The topics discussed in these slides are User Type, Channels By Conversion, Campaigns By Conversion. This is an immediately available PowerPoint presentation that can be conveniently customized. Download it and convince your audience.
-
 Business analytics dashboard snapshot with online sales tracking and product profit per unit
This is a two stage process. The stages in this process are Business Analytics, BA, Organizations Data.
-
 Asset Tracking Analytics In Powerpoint And Google Slides Cpb
Presenting Asset Tracking Analytics In Powerpoint And Google Slides Cpb slide which is completely adaptable. The graphics in this PowerPoint slide showcase three stages that will help you succinctly convey the information. In addition, you can alternate the color, font size, font type, and shapes of this PPT layout according to your content. This PPT presentation can be accessed with Google Slides and is available in both standard screen and widescreen aspect ratios. It is also a useful set to elucidate topics like Asset Tracking Analytics. This well structured design can be downloaded in different formats like PDF, JPG, and PNG. So, without any delay, click on the download button now.
-
 Digital Biomarkers It Use Of Data Analytics To Detect And Track Diseases
This slide represents the use of data analytics to detect and track diseases through sensors, such as accelerometers, gyroscopes, and pedometers. These detectors easily identify variations in sleeping patterns and body movements. Introducing our premium set of slides with Digital Biomarkers It Use Of Data Analytics To Detect And Track Diseases. Ellicudate the seven stages and present information using this PPT slide. This is a completely adaptable PowerPoint template design that can be used to interpret topics like Physical Motions, Brain Activity, Motor Impairment. So download instantly and tailor it with your information.
-
 Analytics Event Tracking In Powerpoint And Google Slides Cpb
Presenting Analytics Event Tracking In Powerpoint And Google Slides Cpb slide which is completely adaptable. The graphics in this PowerPoint slide showcase four stages that will help you succinctly convey the information. In addition, you can alternate the color, font size, font type, and shapes of this PPT layout according to your content. This PPT presentation can be accessed with Google Slides and is available in both standard screen and widescreen aspect ratios. It is also a useful set to elucidate topics like Analytics Event Tracking. This well structured design can be downloaded in different formats like PDF, JPG, and PNG. So, without any delay, click on the download button now.
-
 Conversion Tracking Analytics In Powerpoint And Google Slides Cpb
Presenting our Conversion Tracking Analytics In Powerpoint And Google Slides Cpb PowerPoint template design. This PowerPoint slide showcases six stages. It is useful to share insightful information on Conversion Tracking Analytics This PPT slide can be easily accessed in standard screen and widescreen aspect ratios. It is also available in various formats like PDF, PNG, and JPG. Not only this, the PowerPoint slideshow is completely editable and you can effortlessly modify the font size, font type, and shapes according to your wish. Our PPT layout is compatible with Google Slides as well, so download and edit it as per your knowledge.
-
 E Commerce Analytics And Tracking Tools For Marketers
The slide showcases KPIs help track, measure and report user behavior, performance trends and return on investment. The elements include average order value, conversion rate, shopping cart abandonment rate, return on ad spends etc. Introducing our E Commerce Analytics And Tracking Tools For Marketers set of slides. The topics discussed in these slides are Average Order Value, Conversion Rate, Return On Ad Spends. This is an immediately available PowerPoint presentation that can be conveniently customized. Download it and convince your audience.
-
 Tracking Analytics Ecommerce In Powerpoint And Google Slides Cpb
Presenting our Tracking Analytics Ecommerce In Powerpoint And Google Slides Cpb PowerPoint template design. This PowerPoint slide showcases four stages. It is useful to share insightful information on Tracking Analytics Ecommerce This PPT slide can be easily accessed in standard screen and widescreen aspect ratios. It is also available in various formats like PDF, PNG, and JPG. Not only this, the PowerPoint slideshow is completely editable and you can effortlessly modify the font size, font type, and shapes according to your wish. Our PPT layout is compatible with Google Slides as well, so download and edit it as per your knowledge.
-
 Digital Health IT Use Of Data Analytics To Detect And Track Diseases Ppt Styles Gallery
This slide represents the use of data analytics to detect and track diseases through sensors, such as accelerometers, gyroscopes, and pedometers. These detectors easily identify variations in sleeping patterns and body movements. Introducing Digital Health IT Use Of Data Analytics To Detect And Track Diseases Ppt Styles Gallery to increase your presentation threshold. Encompassed with seven stages, this template is a great option to educate and entice your audience. Dispence information on Data Analytics, Detect, Track Diseases, using this template. Grab it now to reap its full benefits.
-
 Use Google Analytics Track Social Media In Powerpoint And Google Slides Cpb
Presenting Use Google Analytics Track Social Media In Powerpoint And Google Slides Cpb slide which is completely adaptable. The graphics in this PowerPoint slide showcase four stages that will help you succinctly convey the information. In addition, you can alternate the color, font size, font type, and shapes of this PPT layout according to your content. This PPT presentation can be accessed with Google Slides and is available in both standard screen and widescreen aspect ratios. It is also a useful set to elucidate topics like Use Google Analytics Track Social Media. This well structured design can be downloaded in different formats like PDF, JPG, and PNG. So, without any delay, click on the download button now.
-
 Biomarker Classification Use Of Data Analytics To Detect And Track Diseases
This slide represents the use of data analytics to detect and track diseases through sensors, such as accelerometers, gyroscopes, and pedometers. These detectors easily identify variations in sleeping patterns and body movements. Increase audience engagement and knowledge by dispensing information using Biomarker Classification Use Of Data Analytics To Detect And Track Diseases. This template helps you present information on seven stages. You can also present information on Analytics, Accelerometers, Neurological using this PPT design. This layout is completely editable so personaize it now to meet your audiences expectations.
-
 Health Information Management Use Of Data Analytics To Detect And Track Diseases
This slide represents the use of data analytics to detect and track diseases through sensors, such as accelerometers, gyroscopes, and pedometers. These detectors easily identify variations in sleeping patterns and body movements. Introducing Health Information Management Use Of Data Analytics To Detect And Track Diseases to increase your presentation threshold. Encompassed with seven stages, this template is a great option to educate and entice your audience. Dispence information on Motor Impairment, Patients, Measured, using this template. Grab it now to reap its full benefits.
-
 Use Of Data Analytics To Detect And Track Diseases Biomedical Informatics
This slide represents the use of data analytics to detect and track diseases through sensors, such as accelerometers, gyroscopes, and pedometers. These detectors easily identify variations in sleeping patterns and body movements. Introducing Use Of Data Analytics To Detect And Track Diseases Biomedical Informatics to increase your presentation threshold. Encompassed with six stages, this template is a great option to educate and entice your audience. Dispence information on Accelerometers, Gyroscopes using this template. Grab it now to reap its full benefits.
-
 Cro analytics and tracking with icons
Presenting cro analytics and tracking with icons. This is a cro analytics and tracking with icons. This is a six stage process. The stages in this process are Cro, conversion rate optimization.


