Powerpoint Templates and Google slides for Time.
Save Your Time and attract your audience with our fully editable PPT Templates and Slides.
-
 Kpi for picked line items dock to stock time goods ratio powerpoint slide
Presenting kpi for picked line items dock to stock time goods ratio powerpoint slide. This presentation slide shows Three Key Performance Indicators or KPIs in a Dashboard style design. The first KPI that can be shown is Percentage of Correctly Picked Line Items. The second KPI is Average Dock to Stock Time for Receiving. The third is Inventory to Obsolete Goods Ratio. These KPI Powerpoint graphics are all data driven, and the shape automatically adjusts according to your data. Just right click on the KPI graphic, enter the right value and the shape will adjust automatically. Make a visual impact with our KPI slides.
-
 Stock time kpi for inspection testing lead time variability powerpoint slide
Presenting stock time kpi for inspection testing lead time variability powerpoint slide. This presentation slide shows Two Key Performance Indicators or KPIs in a Dashboard style design. The first KPI that can be shown is Average Dock to Stock Time for Inspection Testing. The second KPI is Percent Variability in Lead Time. These KPI Powerpoint graphics are all data driven, and the shape automatically adjusts according to your data. Just right click on the KPI graphic, enter the right value and the shape will adjust automatically. Make a visual impact with our KPI slides.
-
 Kpi For Blog Post Times Online Video Game Ppt Slide
Presenting kpi for blog post times online video game ppt slide. This presentation slide shows three Key Performance Indicators or KPIs in a Dashboard style design. The first KPI that can be shown is Number of People That Read Blog Post Sponsored By Brand. The second KPI is Number of Times That Blog Posts Sponsored By Brand Are Read and the third is Number of People That Played Online Video Game Sponsored By Brand. These KPI Powerpoint graphics are all data driven, and the shape automatically adjusts according to your data. Just right click on the KPI graphic, enter the right value and the shape will adjust automatically. Make a visual impact with our KPI slides.
-
 Kpi for number of times people comments viewed clicked ppt slide
Presenting kpi for number of times people comments viewed clicked ppt slide. This presentation slide shows three Key Performance Indicators or KPIs in a Dashboard style design. The first KPI that can be shown is Number of Times People Left Comments on Your Site Using The Comments Plugin. The second KPI is Number of Times People Viewed Like Buttons on Your Site and the third is Number of Times People Clicked The Like Button on Your Site. These KPI Powerpoint graphics are all data driven, and the shape automatically adjusts according to your data. Just right click on the KPI graphic, enter the right value and the shape will adjust automatically. Make a visual impact with our KPI slides.
-
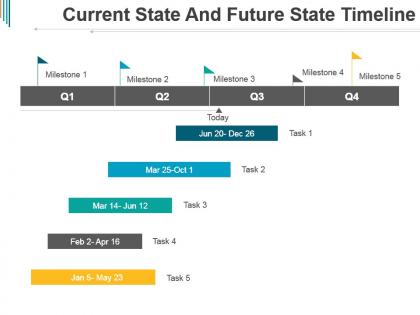 Current state and future state timeline powerpoint slide clipart
Presenting current state and future state timeline powerpoint slide clipart. This is a current state and future state timeline powerpoint slide clipart. This is a four stage process. The stages in this process are problem solution, current state future state, before after, challenges solutions, compare, comparison.
-
 Action tracker stopwatch time treadmill race
Presenting this set of slides with name - Action Tracker Stopwatch Time Treadmill Race. This is a one stage process. The stages in this process are Action Tracker, Activity Tractor, Act Tracker, Exercise Tracker.
-
 Business readiness businessman chasing time
Presenting this set of slides with name - Business Readiness Businessman Chasing Time. This is a one stage process. The stages in this process are Business Readiness, Operational Readiness Plan, Change Management.
-
 Opportunity balance scale with time and money
Presenting this set of slides with name - Opportunity Balance Scale With Time And Money. This is a two stage process. The stages in this process are Alternative Cost, Opportunity Cost, Alternative Price, Expected Return.
-
 Agenda time activity lineup image with pen
Presenting this set of slides with name - Agenda Time Activity Lineup Image With Pen. This is a one stage process. The stages in this process are Agenda Time, Plan Time, Meeting Time.
-
 Agenda time calendar schedule image with pc
Presenting this set of slides with name - Agenda Time Calendar Schedule Image With Pc. This is a one stage process. The stages in this process are Agenda Time, Plan Time, Meeting Time.
-
 Agenda time meeting watch image
Presenting this set of slides with name - Agenda Time Meeting Watch Image. This is a one stage process. The stages in this process are Agenda Time, Plan Time, Meeting Time.
-
 Agenda time notebook list image with wooden background
Presenting this set of slides with name - Agenda Time Notebook List Image With Wooden Background. This is a one stage process. The stages in this process are Agenda Time, Plan Time, Meeting Time.
-
 Agenda time scheduler image with clock
Presenting this set of slides with name - Agenda Time Scheduler Image With Clock. This is a one stage process. The stages in this process are Agenda Time, Plan Time, Meeting Time.
-
 Meeting agenda time plan image
Presenting this set of slides with name - Meeting Agenda Time Plan Image. This is a one stage process. The stages in this process are Agenda Time, Plan Time, Meeting Time.
-
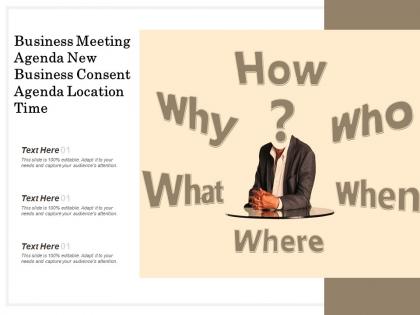 Business meeting agenda new business consent agenda location time
Presenting this set of slides with name - Business Meeting Agenda New Business Consent Agenda Location Time. This is a three stage process. The stages in this process are Question Mark, Asking Question, Query Mark.
-
 Sand clock darkness passage of time
Presenting this set of slides with name - Sand Clock Darkness Passage Of Time. This is a one stage process. The stages in this process are Hourglass, Sand Timer, Sand Clock.
-
 Sand clock hourglass time running out
Presenting our Sand Clock Hourglass Time Running Out PowerPoint presentation. This slideshow is 100% editable and downloadable. You can modify it into different formats like PDF, JPG, and PNG as per your requirement without an issue. It can be easily converted into a different color, font, font size, and font types as per the requirement. The slide is available in both 4:3 and 16:9 aspect ratios. Download this template and impress your audience.
-
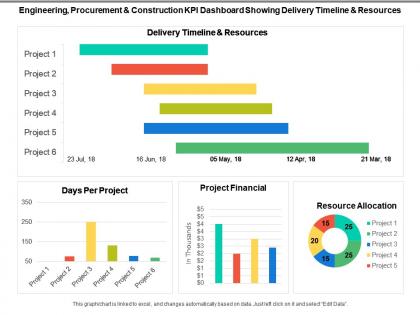 Engineering procurement and construction kpi dashboard showing delivery timeline and resources
Presenting this set of slides with name - Engineering Procurement And Construction Kpi Dashboard Showing Delivery Timeline And Resources. This is a four stage process. The stages in this process are Engineering, Procurement And Construction, Construction Management, Engineering, Purchasing And Construction .
-
 Audit kpi dashboard showing lead time average entry variance and amount contribution
Presenting this set of slides with name - Audit Kpi Dashboard Showing Lead Time Average Entry Variance And Amount Contribution. This is a four stage process. The stages in this process are Audit, Examine, Survey.
-
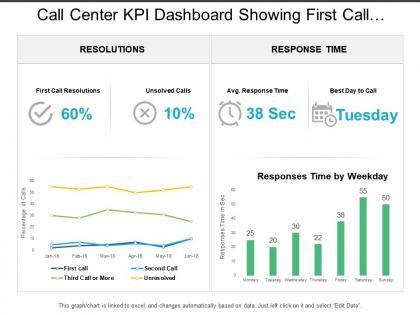 Call center kpi dashboard showing first call resolution response time
Presenting call center KPI dashboard showing first call resolution response time. This deck offers you plenty of space to put in titles and sub titles. This template is Excel linked just right click to input your information. High resolution-based layout, does not change the image even after resizing. This presentation icon is fully compatible with Google slides. Quick downloading speed and simple editing options in color text and fonts.PPT icons can easily be changed into JPEG and PDF applications.
-
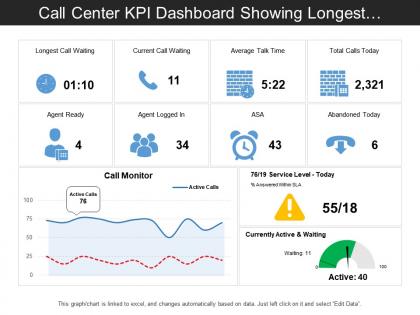 Call center kpi dashboard showing longest call waiting and average talk time
Presenting this set of slides with name - Call Center Kpi Dashboard Showing Longest Call Waiting And Average Talk Time. This is a three stage process. The stages in this process are Call Center Agent, Customer Care, Client Support.
-
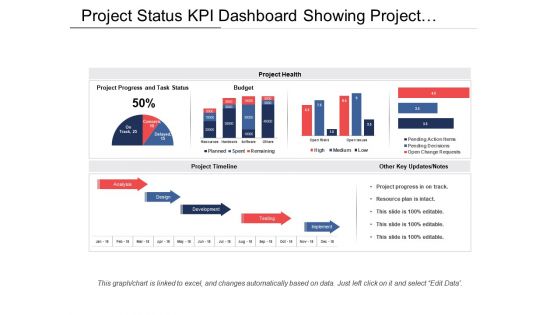 Project status kpi dashboard showing project timeline and budget
Presenting this set of slides with name - Project Status Kpi Dashboard Showing Project Timeline And Budget. This is a five stage process. The stages in this process are Project Health Card, Project Performance, Project Status.
-
 Compliance and legal kpi dashboard showing compliance issues and resolution time
Presenting this set of slides with name - Compliance And Legal Kpi Dashboard Showing Compliance Issues And Resolution Time. This is a three stage process. The stages in this process are Compliance And Legal, Legal Governance, Risk Management.
-
 Vendor kpi dashboard showing defect rate on-time suppliers and lead time
Presenting this set of slides with name - Vendor Kpi Dashboard Showing Defect Rate On-Time Suppliers And Lead Time. This is a stage process. The stages in this process are Vendor, Supplier, Retailer.
-
 Vendor kpi dashboard showing supplier compliance stats and procurement cycle time
Presenting this set of slides with name - Vendor Kpi Dashboard Showing Supplier Compliance Stats And Procurement Cycle Time. This is a four stage process. The stages in this process are Vendor, Supplier, Retailer.
-
 Annual schedule timeline in flag format
Presenting this set of slides with name - Annual Schedule Timeline In Flag Format. This is a six stage process. The stages in this process are Annual Schedule, Yearly Schedule, Annual Plan.
-
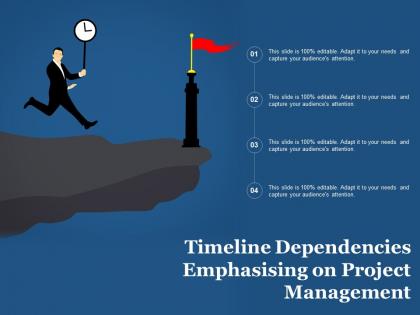 Timeline dependencies emphasising on project management
Presenting this set of slides with name - Timeline Dependencies Emphasising On Project Management. This is a four stage process. The stages in this process are Timeline Dependencies, Dependencies, Project Dependencies.
-
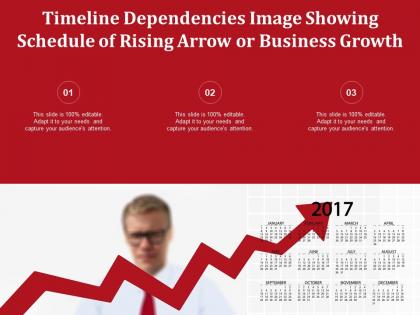 Timeline dependencies image showing schedule of rising arrow or business growth
Presenting this set of slides with name - Timeline Dependencies Image Showing Schedule Of Rising Arrow Or Business Growth. This is a three stage process. The stages in this process are Timeline Dependencies, Dependencies, Project Dependencies.
-
 Timeline dependencies showing day planner or schedule organizer
Presenting this set of slides with name - Timeline Dependencies Showing Day Planner Or Schedule Organizer. This is a three stage process. The stages in this process are Timeline Dependencies, Dependencies, Project Dependencies.
-
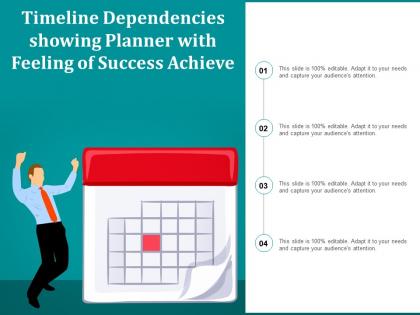 Timeline dependencies showing planner with feeling of success achieve
Presenting this set of slides with name - Timeline Dependencies Showing Planner With Feeling Of Success Achieve. This is a one stage process. The stages in this process are Timeline Dependencies, Dependencies, Project Dependencies.
-
 Timeline dependencies showing time count for task schedule
Presenting this set of slides with name - Timeline Dependencies Showing Time Count For Task Schedule. This is a four stage process. The stages in this process are Timeline Dependencies, Dependencies, Project Dependencies.
-
 Product roadmap timeline 2013 to 2018 graphical representation of technologies powerpoint templates slides
Ready to use template theme which saves time also , Fully customizable Presentation designs, text, font, colors and layout, Unaffected High resolution PPT slides even after customization, Well compatible with all the software’s and Google slides, Graphical visuals to incisively penetrate audience, Convertible into PDF or JPG formats, Easy to replace dummy PPT images with your logo or trademark.
-
 Product roadmap timeline technology bar graph 2013 to 2020 powerpoint templates slides
Use of high-resolution images. Allow instant replacement of the icons or the images. Customize the background, orientation or size of the images or icons. Offered instructions to make changes and modify the slide icons. Useful for the business entrepreneurs, business presenters and the team leaders.
-
 Product roadmap timeline 2012 to 2016 road mapping future perspectives powerpoint templates slides
High resolution PPT presentation diagram. 100 percent editable PPT icons, text, background and other elements. Hassle free insertion of company logo, name and/or trademark. Wide screen output without the adverse effect on picture quality. Compatible with varied number of online and offline software options. Ease of downloading these roadmap timeline templates. Useful for business analysts, strategy makers, entrepreneurs, financial executives, professors and students.
-
 Product roadmap timeline 2d linear graph illustrating future technologies powerpoint templates slides
We are proud to present our product roadmap timeline 2d linear graph illustrating future technologies powerpoint templates slides. This PPT slide is perfect to show future economic, social, technological, and environmental conditions. The mind is always whirring with new ideas. Put them down and present them using our innovative Diagram. Activate the minds of your team with your ideas. Illustrate to them how it will take them to the very top.
-
 Business diagram examples timeline creative calenders designs powerpoint templates
We are proud to present our business diagram examples timeline creative calenders designs powerpoint templates. Use this template to track your appointments in an easy to read, yearly format. Use our creative template to lay down your views. Go ahead and add charm to your presentations with high quality PPT slide.
-
 1113 business ppt diagram timeline creative calendar designs0 powerpoint template
We are proud to present our 1113 business ppt diagram timeline creative calendar designs0 powerpoint template. This Calendar chart helps to organize our household and the members duties to make sure everything gets done on time. It is capable of conveying the important characteristics more plainly than what words are capable of doing.
-
 0514 time management matrix powerpoint presentation
Download is fast and can be inserted in the presentation easily. Presentation design attainable in standard and widescreen view. PowerPoint slide created with high quality resolution design. Entirely variable design as color, text and font can be edited with ease. PPT template easy to download with different nodes and stages. Easy to transmute the presentation design into JPEG and PDF document. Suitable for project managers, commerce professionals, event managing team, pupils etc.
-
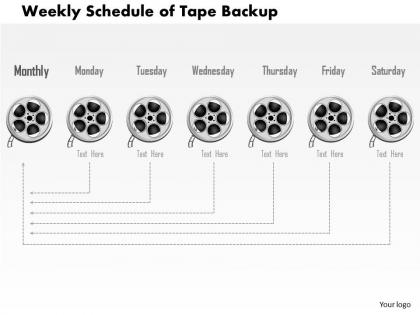 0814 weekly schedule of tape backup showing timeline of retention dates and times ppt slides
We are proud to present our 0814 weekly schedule of tape backup showing timeline of retention dates and times ppt slides. This Powerpoint image slide has been designed with graphic of magnetic tapes. These tapes are used to take data backups and to create records. This PPT slide may be used to display weekly schedule of tape backup with timeline representation.
-
 Real time quality dashboard showing traceability test results defects analysis
Presenting this set of slides with name - Real Time Quality Dashboard Showing Traceability Test Results Defects Analysis. This is a three stage process. The stages in this process are Quality Dashboard, Quality Kpi, Quality Metircs.
-
 Tipping point early adopters qualitative time
Presenting this set of slides with name - Tipping Point Early Adopters Qualitative Time. This is a two stage process. The stages in this process are Tipping Point, Group Processes, Sociological.
-
 Government and public works kpi dashboard showing service request count and time to close
Presenting this set of slides with name - Government And Public Works Kpi Dashboard Showing Service Request Count And Time To Close. This is a five stage process. The stages in this process are Government And Public Works, Government And Public Tasks.
-
 Professional and technical services kpi dashboard snapshot showing timesheet
Presenting this set of slides with name - Professional And Technical Services Kpi Dashboard Snapshot Showing Timesheet. This is a four stage process. The stages in this process are Professional And Technical Services, Services Management, Technical Management.
-
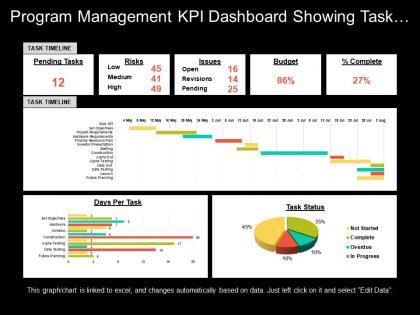 Program management kpi dashboard showing task timeline risks and budget
Presenting Program Management KPI Dashboard Showing Task Timeline Risks And Budget PPT slide. The task timeline dashboard PowerPoint template designed professionally by the team of SlideTeam to present the values over time. The different icons such as pie chart, line chart, as well as other figures and text in the Graphical Chart KPI dashboard slide are customizable in PowerPoint. A user can illustrate the desired numerical information because the graphical management dashboard template gets linked with Excel Sheet. The management dashboard slide is compatible with Google Slide. You may edit the font size, font type, color and dimensions of the different chart to present the desired numerical information.
-
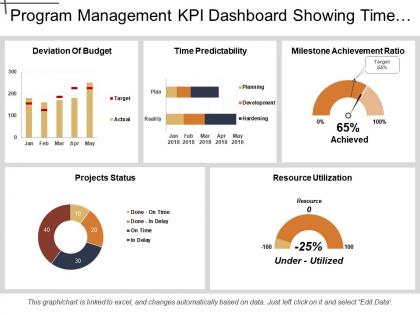 Program management kpi dashboard showing time predictability and resource utilization
Presenting Program Management KPI Dashboard Showing Time Predictability And Resource Utilization PPT slide. The graphical Program Management dashboard PowerPoint template designed by the professional team of SlideTeam to present the different parameters that are essential for any project. The different charts such as line and pie chart, along with that the text in the KPI dashboard slide are editable in PowerPoint. Moreover, this slide is compatible with Google Slide. An individual can edit the font size, font type, color and dimensions of the different figures according to the requirement.
-
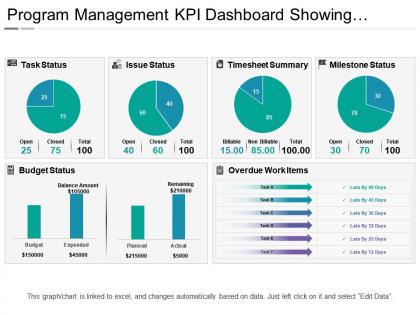 Program management kpi dashboard showing timesheet summary
Presenting Program Management KPI Dashboard Showing Timesheet Summary PPT slide. The Program management KPI dashboard PowerPoint template designed professionally by the team of SlideTeam to present the record of timesheet summary to do any task. The pie chart and line chart figures along with that the text in the timesheet summary dashboard slide are customizable in PowerPoint. A user can illustrate the specific time to do any task because the pie chart dashboard template gets linked with Excel Sheet along with that it is also compatible with Google Slide. A user can alter the font size, font type, color, as well as dimensions of the pie and line chart to present the specific time.
-
 Warehousing kpi dashboard showing collecting time and orders per day
Presenting, warehousing dashboard KPI PowerPoint Presentation Slide. This Presentation has been designed professionally and is fully editable. You can personalize font size, font type, colors, and even the background. This Template is obedient with Google Slide and can be saved in JPG or PDF format without any hassle. Fast download at the click of the button.
-
 Logistics dashboard showing perfect order rate and on time shipments
Presenting Logistics Dashboard Showing Perfect Order Rate And On Time Shipments PPT slide. The on-time shipments dashboard PowerPoint template designed professionally by the team of SlideTeam to present the record of on time delivery to clients and investors. The different icons such as pie chart, ring, line chart and many other which include text in the perfect order rate dashboard slide are customizable in PowerPoint. A user can illustrate the desired values as the graphical dashboard template get linked with Excel Sheet and it is also compatible with Google Slide. A user can do alteration in the font size, font type, color and dimensions of the line and pie chart to present the desired delivery time.
-
 Logistics dashboard with delivery on time and quarter to date
Presenting Logistics Dashboard With Delivery On Time And Quarter To Date PPT slide. The delivery on time dashboard PowerPoint template designed professionally by the team of SlideTeam to present the approximate delivery time to clients and investors as well. The different icons such as vehicle, dollar, speed meter and many other, as well as text in the quarter to date dashboard slide are customizable in PowerPoint and can help you in sharing the average time required for an order get ready and delivered. The logistics delivery dashboard slide is compatible with Google Slide. A user can make changes in the font size, font type, color and dimensions of the different icons to present the desired delivery time.
-
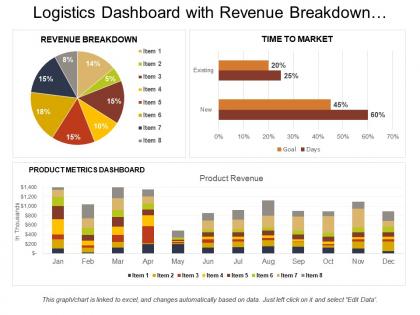 Logistics dashboard with revenue breakdown and time to market
Presenting Logistics Dashboard With Revenue Breakdown And Time To Market PPT slide. The revenue breakdown dashboard PowerPoint template designed by the professional team of SlideTeam to present the entire plan to clients as well as investors. The bar chart, pie charts, text and image in time to market dashboard slide are customizable in PowerPoint and can help you in sharing the market sale target. The logistics performance dashboard slide is compatible with Google Slide which makes easy for a presenter to present business financial statistics. A user may do changes in the font size, font type, color and dimensions of the charts to present the desired sales value.
-
 Animation timeline for work plan development
Presenting this set of slides with name - Animation Timeline For Work Plan Development. This is a six stage process. The stages in this process are Animation Timeline, Animation Roadmap, Animation Linear Process.
-
 Animation timeline layout with eight options
Presenting this set of slides with name - Animation Timeline Layout With Eight Options. This is a four stage process. The stages in this process are Animation Timeline, Animation Roadmap, Animation Linear Process.
-
 Business animation timeline showing eight steps
Presenting this set of slides with name - Business Animation Timeline Showing Eight Steps. This is a four stage process. The stages in this process are Animation Timeline, Animation Roadmap, Animation Linear Process.
-
 Business launch animation timeline
Presenting this set of slides with name - Business Launch Animation Timeline. This is a three stage process. The stages in this process are Animation Timeline, Animation Roadmap, Animation Linear Process.
-
 Business planning animation timeline with icons
Presenting this set of slides with name - Business Planning Animation Timeline With Icons. This is a three stage process. The stages in this process are Animation Timeline, Animation Roadmap, Animation Linear Process.
-
 Six stages horizontal animation timeline
Presenting this set of slides with name - Six Stages Horizontal Animation Timeline. This is a three stage process. The stages in this process are Animation Timeline, Animation Roadmap, Animation Linear Process.
-
 Six years animation timeline
Presenting this set of slides with name - Six Years Animation Timeline. This is a three stage process. The stages in this process are Animation Timeline, Animation Roadmap, Animation Linear Process.
-
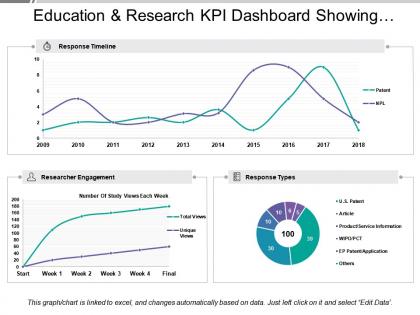 Education and research kpi dashboard showing response timeline and researcher engagement
Presenting education and research KPI dashboard showing response timeline and researcher engagement PPT slide. The education report PPT slide designed by professional team of SlideTeam. The research grant KPI dashboard presentation template is customizable in PowerPoint. The student attendance rate KPI report PowerPoint slide is also compatible with Google Slide so a user can share this template with others. A user can make changes in the font size, font type, color as well as dimensions of the education finance metric dashboard template as per the requirement. You may edit the value in the education KPI dashboard PowerPoint template as the slide gets linked with the Excel sheet. .
-
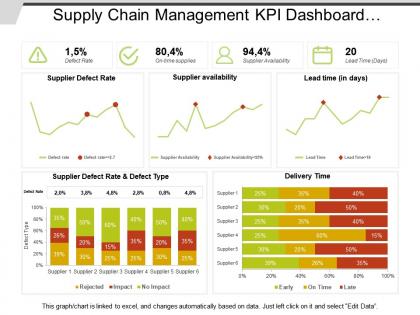 Supply chain management kpi dashboard showing defect rate and delivery time
Presenting this set of slides with name - Supply Chain Management Kpi Dashboard Showing Defect Rate And Delivery Time. This is a three stage process. The stages in this process are Demand Forecasting, Predicting Future Demand, Supply Chain Management.
-
 Entertainment recreation and arts kpi dashboard average annual expenditure and time spent
Presenting this set of slides with name - Entertainment Recreation And Arts Kpi Dashboard Average Annual Expenditure And Time Spent. This is a three stage process. The stages in this process are Entertainment, Recreation And Arts, Attractions, Culture, Entertainment.


