Powerpoint Templates and Google slides for Time Dashboard
Save Your Time and attract your audience with our fully editable PPT Templates and Slides.
-
 Vendor kpi dashboard showing supplier compliance stats and procurement cycle time
Presenting this set of slides with name - Vendor Kpi Dashboard Showing Supplier Compliance Stats And Procurement Cycle Time. This is a four stage process. The stages in this process are Vendor, Supplier, Retailer.
-
 Real time quality dashboard showing traceability test results defects analysis
Presenting this set of slides with name - Real Time Quality Dashboard Showing Traceability Test Results Defects Analysis. This is a three stage process. The stages in this process are Quality Dashboard, Quality Kpi, Quality Metircs.
-
 Government and public works kpi dashboard showing service request count and time to close
Presenting this set of slides with name - Government And Public Works Kpi Dashboard Showing Service Request Count And Time To Close. This is a five stage process. The stages in this process are Government And Public Works, Government And Public Tasks.
-
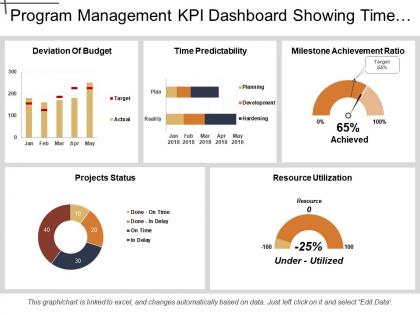 Program management kpi dashboard showing time predictability and resource utilization
Presenting Program Management KPI Dashboard Showing Time Predictability And Resource Utilization PPT slide. The graphical Program Management dashboard PowerPoint template designed by the professional team of SlideTeam to present the different parameters that are essential for any project. The different charts such as line and pie chart, along with that the text in the KPI dashboard slide are editable in PowerPoint. Moreover, this slide is compatible with Google Slide. An individual can edit the font size, font type, color and dimensions of the different figures according to the requirement.
-
 Warehousing kpi dashboard showing collecting time and orders per day
Presenting, warehousing dashboard KPI PowerPoint Presentation Slide. This Presentation has been designed professionally and is fully editable. You can personalize font size, font type, colors, and even the background. This Template is obedient with Google Slide and can be saved in JPG or PDF format without any hassle. Fast download at the click of the button.
-
 Logistics dashboard showing perfect order rate and on time shipments
Presenting Logistics Dashboard Showing Perfect Order Rate And On Time Shipments PPT slide. The on-time shipments dashboard PowerPoint template designed professionally by the team of SlideTeam to present the record of on time delivery to clients and investors. The different icons such as pie chart, ring, line chart and many other which include text in the perfect order rate dashboard slide are customizable in PowerPoint. A user can illustrate the desired values as the graphical dashboard template get linked with Excel Sheet and it is also compatible with Google Slide. A user can do alteration in the font size, font type, color and dimensions of the line and pie chart to present the desired delivery time.
-
 Logistics dashboard with delivery on time and quarter to date
Presenting Logistics Dashboard With Delivery On Time And Quarter To Date PPT slide. The delivery on time dashboard PowerPoint template designed professionally by the team of SlideTeam to present the approximate delivery time to clients and investors as well. The different icons such as vehicle, dollar, speed meter and many other, as well as text in the quarter to date dashboard slide are customizable in PowerPoint and can help you in sharing the average time required for an order get ready and delivered. The logistics delivery dashboard slide is compatible with Google Slide. A user can make changes in the font size, font type, color and dimensions of the different icons to present the desired delivery time.
-
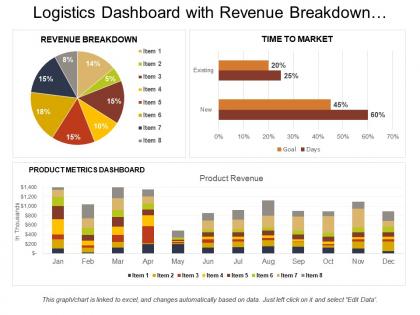 Logistics dashboard with revenue breakdown and time to market
Presenting Logistics Dashboard With Revenue Breakdown And Time To Market PPT slide. The revenue breakdown dashboard PowerPoint template designed by the professional team of SlideTeam to present the entire plan to clients as well as investors. The bar chart, pie charts, text and image in time to market dashboard slide are customizable in PowerPoint and can help you in sharing the market sale target. The logistics performance dashboard slide is compatible with Google Slide which makes easy for a presenter to present business financial statistics. A user may do changes in the font size, font type, color and dimensions of the charts to present the desired sales value.
-
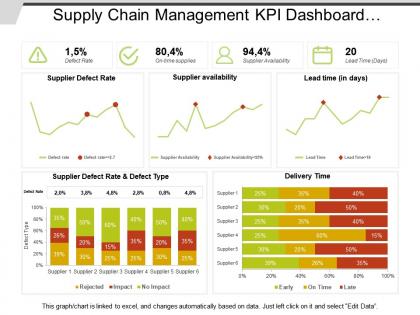 Supply chain management kpi dashboard showing defect rate and delivery time
Presenting this set of slides with name - Supply Chain Management Kpi Dashboard Showing Defect Rate And Delivery Time. This is a three stage process. The stages in this process are Demand Forecasting, Predicting Future Demand, Supply Chain Management.
-
 Entertainment recreation and arts kpi dashboard average annual expenditure and time spent
Presenting this set of slides with name - Entertainment Recreation And Arts Kpi Dashboard Average Annual Expenditure And Time Spent. This is a three stage process. The stages in this process are Entertainment, Recreation And Arts, Attractions, Culture, Entertainment.
-
 Entertainment recreation and arts kpi dashboard market value and percentage of time spend
Presenting this set of slides with name - Entertainment Recreation And Arts Kpi Dashboard Market Value And Percentage Of Time Spend. This is a three stage process. The stages in this process are Entertainment, Recreation And Arts, Attractions, Culture, Entertainment.
-
 Entertainment recreation and arts kpi dashboard showing of media usage and time spent per user
Presenting this set of slides with name - Entertainment Recreation And Arts Kpi Dashboard Showing Of Media Usage And Time Spent Per User. This is a four stage process. The stages in this process are Entertainment, Recreation And Arts, Attractions, Culture, Entertainment.
-
 Workforce kpi dashboard showing headcount full time employee and turnover rate
Presenting this set of slides with name - Workforce Kpi Dashboard Showing Headcount Full Time Employee And Turnover Rate. This is a three stage process. The stages in this process are Staff, Personnel, Workforce.
-
 Workforce kpi dashboard showing part time vs full time employee
Presenting this set of slides with name - Workforce Kpi Dashboard Showing Part Time Vs Full Time Employee. This is a four stage process. The stages in this process are Staff, Personnel, Workforce.
-
 Part time vs full time employees recruitment dashboard
Presenting this set of slides with name - Part Time Vs Full Time Employees Recruitment Dashboard. This is a four stage process. The stages in this process are Staffing Plan, Recruitment, Staff Management.
-
 Transportation kpi dashboard showing cost and on time final delivery
Presenting transportation KPI dashboard showing cost and on time final delivery PPT slide. This deck offers you plenty of space to put in titles and sub titles. This template is Excel linked just right click to input your information. High resolution based layout, does not change the image even after resizing. This presentation icon is fully compatible with Google slides. Quick downloading speed and simple editing options in color text and fonts.PPT icons can easily be changed into JPEG and PDF applications.
-
 Transportation kpi dashboard snapshot showing fleet delivery status loading time and weight
Presenting transportation KPI dashboard snapshot showing fleet delivery status loading time and weight PPT slide. Simple data input with linked Excel chart, just right click to input values. This PowerPoint theme is fully supported by Google slides. Picture quality of these slides does not change even when project on large screen. Fast downloading speed and formats can be easily changed to JPEG and PDF applications. This template is suitable for marketing, sales persons, business managers and entrepreneurs.
-
 Transportation kpi dashboard showing shipments by country and transit time
Presenting transportation KPI Dashboard showing shipments by country and transit time PPT slide. This deck offers you plenty of space to put in titles and subtitles. This template is Excel linked just right click to input your information. High resolution based layout, does not change the image even after resizing. This presentation icon is fully compatible with Google slides. Quick downloading speed and simple editing options in color text and fonts.PPT icons can easily be changed into JPEG and PDF applications
-
 Devops kpi dashboard showing api and site response time
Presenting this set of slides with name - Devops Kpi Dashboard Showing Api And Site Response Time. This is a four stage process. The stages in this process are Development And Operations, Devops.
-
 Devops kpi dashboard showing mean time to recover
Presenting this set of slides with name - Devops Kpi Dashboard Showing Mean Time To Recover. This is a six stage process. The stages in this process are Development And Operations, Devops.
-
 Healthcare dashboard with average time of division and patient satisfaction
Presenting this set of slides with name - Healthcare Dashboard With Average Time Of Division And Patient Satisfaction. This is a five stage process. The stages in this process are Healthcare, Health Improvement, Medical Care.
-
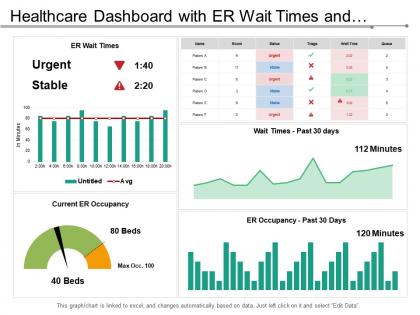 Healthcare dashboard with er wait times and patient in er
Presenting this set of slides with name - Healthcare Dashboard With Er Wait Times And Patient In Er. This is a five stage process. The stages in this process are Healthcare, Health Improvement, Medical Care.
-
 Healthcare dashboard with patient metrics and er wait times
Presenting this set of slides with name - Healthcare Dashboard With Patient Metrics And Er Wait Times. This is a five stage process. The stages in this process are Healthcare, Health Improvement, Medical Care.
-
 Emergency police and justice dashboard with timely deliveries to court
Presenting this set of slides with name - Emergency Police And Justice Dashboard With Timely Deliveries To Court. This is a five stage process. The stages in this process are Emergency, Police And Justice, Police And Emergency Services, Justice And Public Security.
-
 Emergency police and justice dashboard with total street time of police
Presenting this set of slides with name - Emergency Police And Justice Dashboard With Total Street Time Of Police. This is a six stage process. The stages in this process are Emergency, Police And Justice, Police And Emergency Services, Justice And Public Security.
-
 Procurement average time to procure dashboard
Presenting this set of slides with name - Procurement Average Time To Procure Dashboard. This is a seven stage process. The stages in this process are Purchase, Procurement, Buy.
-
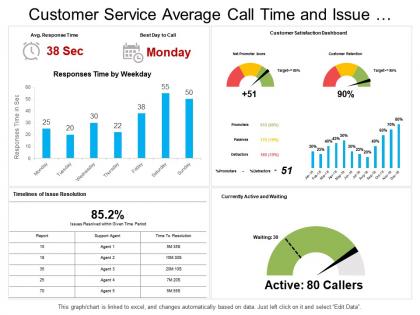 Customer service average call time and issue resolution timeline dashboard
Introducing customer service average call time and issue resolution timeline dashboard PPT slide. This format slide is totally adaptable with Google Slide. You can adjust the tints, content style, text dimension of the slide information according to require. The slide rushes to download and can be spared in PDF, and JPEG designs. For direction, extra instructive slides are given. Best quality designs are used. The nature of the slide illustrations does not obscure when shown on an expansive screen. You can customize the slide by including your association name, and mark.
-
 Customer service resolutions and response time dashboard
Presenting customer service resolutions and response time dashboard PPT template slide. This template slide is fully adjustable with Google Slide. You can edit the color, text style, font size of the template content as per need. The template is easy to download and can be saved in PDF, and JPEG formats. For guidance, additional instructional slides are available. Superior quality graphics are used. The quality of the slide image does not blur when viewed on a large screen. Dummy content can be replaced with other valuable information. You can personalize the template by adding your company name, and signature.
-
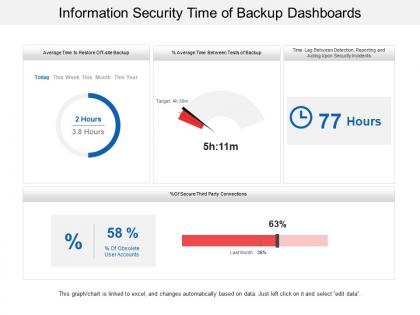 Information security time of backup dashboards
Presenting this set of slides with name - Information Security Time Of Backup Dashboards. This is a three stage process. The stages in this process are Information Security Strategy, Information Security Plan, Information Protection Strategy.
-
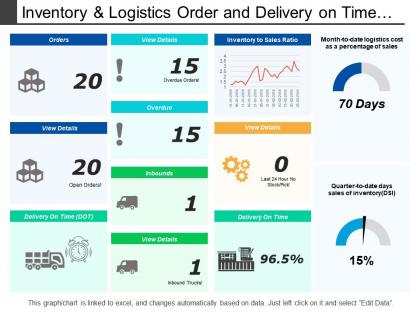 Inventory and logistics order and delivery on time dashboards
Presenting this set of slides with name - Inventory And Logistics Order And Delivery On Time Dashboards. This is a four stage process. The stages in this process are Inventory And Logistics, Inventory Management, Warehousing And Inventory Management.
-
 Dashboard related to logistic company time building an effective logistic strategy for company
This slide shows the dashboards related to the ABC logistic company which includes fleet details, delivery status, delivery by destination, average loading time, etc. Present the topic in a bit more detail with this Dashboard Related To Logistic Company Time Building An Effective Logistic Strategy For Company. Use it as a tool for discussion and navigation on Loading Time And Weight, Deliveries By Destination. This template is free to edit as deemed fit for your organization. Therefore download it now.
-
 Dashboard related to logistic company time creating strategy for supply chain management
This slide shows the dashboards related to the ABC logistic company which includes fleet details, delivery status, delivery by destination, average loading time, etc. Deliver an outstanding presentation on the topic using this Dashboard Related To Logistic Company Time Creating Strategy For Supply Chain Management. Dispense information and present a thorough explanation of Loading Time, Deliveries By Destination, Delivery Status using the slides given. This template can be altered and personalized to fit your needs. It is also available for immediate download. So grab it now.
-
 Google data studio to build real time reporting dashboards digital marketing playbook
This template covers tools to measure marketing analytics such as google analytics for all web tracking, google data studio to build real time reporting dashboards and google data studio reports. Deliver an outstanding presentation on the topic using this Google Data Studio To Build Real Time Reporting Dashboards Digital Marketing Playbook. Dispense information and present a thorough explanation of Mobile System Operating Breakdown, Mobile Geographic Report, Mobile Sessions By Medium, Mobile Goal Analysis using the slides given. This template can be altered and personalized to fit your needs. It is also available for immediate download. So grab it now.
-
 Project task management and time tracking dashboard
Presenting our well structured Project Task Management And Time Tracking Dashboard. The topics discussed in this slide are v. This is an instantly available PowerPoint presentation that can be edited conveniently. Download it right away and captivate your audience.
-
 Time keeping dashboard ppt powerpoint presentation icon shapes cpb
Presenting Time Keeping Dashboard Ppt Powerpoint Presentation Icon Shapes Cpb slide which is completely adaptable. The graphics in this PowerPoint slide showcase three stages that will help you succinctly convey the information. In addition, you can alternate the color, font size, font type, and shapes of this PPT layout according to your content. This PPT presentation can be accessed with Google Slides and is available in both standard screen and widescreen aspect ratios. It is also a useful set to elucidate topics like Time Keeping Dashboard. This well structured design can be downloaded in different formats like PDF, JPG, and PNG. So, without any delay, click on the download button now.
-
 It Project Time Management Dashboard With Task Progress
Introducing our It Project Time Management Dashboard With Task Progress set of slides. The topics discussed in these slides are It Project Time Management Dashboard With Task Progress. This is an immediately available PowerPoint presentation that can be conveniently customized. Download it and convince your audience.
-
 Project Management Tool Time Tracking Dashboard With Usage Details
Introducing our Project Management Tool Time Tracking Dashboard With Usage Details set of slides. The topics discussed in these slides are Project Management Tool Time Tracking Dashboard With Usage Details. This is an immediately available PowerPoint presentation that can be conveniently customized. Download it and convince your audience.
-
 Dashboard For Cyber Security Real Time Monitoring
Presenting our set of slides with name Dashboard For Cyber Security Real Time Monitoring. This exhibits information on three stages of the process. This is an easy to edit and innovatively designed PowerPoint template. So download immediately and highlight information on Dashboard For Cyber Security, Real Time Monitoring.
-
 Time To Market Analytics And Monitoring Dashboard Icon
Introducing our premium set of slides with Time To Market Analytics And Monitoring Dashboard Icon. Ellicudate the four stages and present information using this PPT slide. This is a completely adaptable PowerPoint template design that can be used to interpret topics like Time To Market, Analytics And Monitoring, Dashboard Icon. So download instantly and tailor it with your information.
-
 Time Management Dashboard For Tracking Employee Performance
This slide shows the dashboard representing the employees working time to track their performance. It includes timesheet and weekly reports of employees working time. Introducing our Time Management Dashboard For Tracking Employee Performance set of slides. The topics discussed in these slides are Time Management, Dashboard, Tracking, Employee Performance. This is an immediately available PowerPoint presentation that can be conveniently customized. Download it and convince your audience.
-
 Shipping Time And Transportation Management Dashboard Icon
Presenting our set of slides with Shipping Time And Transportation Management Dashboard Icon. This exhibits information on three stages of the process. This is an easy to edit and innovatively designed PowerPoint template. So download immediately and highlight information on Shipping Time And Transportation, Management Dashboard Icon.
-
 Score time task and session progress dashboard
Presenting this set of slides with name Score Time Task And Session Progress Dashboard. The topics discussed in these slides are Progress Dashboard, Chart And Graph, Finance, Marketing. This is a completely editable PowerPoint presentation and is available for immediate download. Download now and impress your audience.
-
 Complete Guide To Implement Dashboard Showcasing Impact Of Real Time Marketing MKT SS V
Deliver an outstanding presentation on the topic using this Complete Guide To Implement Dashboard Showcasing Impact Of Real Time Marketing MKT SS V Dispense information and present a thorough explanation of Active Marketing Subscribers, Sales Graph using the slides given. This template can be altered and personalized to fit your needs. It is also available for immediate download. So grab it now.
-
 Dashboard Icon For Real Time Tracking And Monitoring Of Organizational Change
Presenting our set of slides with Dashboard Icon For Real Time Tracking And Monitoring Of Organizational Change. This exhibits information on three stages of the process. This is an easy to edit and innovatively designed PowerPoint template. So download immediately and highlight information on Dashboard Icon, Real Time Tracking, Monitoring Of Organizational Change.
-
 Tasks competition status dashboard early on time and late
Presenting this set of slides with name - Tasks Competition Status Dashboard Early On Time And Late. This is a three stage process. The stages in this process are Task Completion, Assignment Completion, Work Completion.
-
 Decision support build success over time bugs dashboard
Presenting this set of slides with name - Decision Support Build Success Over Time Bugs Dashboard. This is an editable four stages graphic that deals with topics like Decision Support, Build Success Over Time, Bugs Dashboard to help convey your message better graphically. This product is a premium product available for immediate download, and is 100 percent editable in Powerpoint. Download this now and use it in your presentations to impress your audience.
-
 Point of sale system dashboard to track the sales in real time
Presenting this set of slides with name - Point Of Sale System Dashboard To Track The Sales In Real Time. This is a two stage process. The stages in this process are Point Of Sale System, POS, Point Of Purchase.
-
 Inventory delivery on time dashboards ppt powerpoint presentation summary clipart
Presenting this set of slides with name - Inventory Delivery On Time Dashboards Ppt Powerpoint Presentation Summary Clipart. This is a five stages process. The stages in this process are Finance, Marketing, Management, Investment, Analysis.
-
 Project time dashboard ppt powerpoint presentation pictures icons cpb
Presenting this set of slides with name Project Time Dashboard Ppt Powerpoint Presentation Pictures Icons Cpb. This is an editable Powerpoint four stages graphic that deals with topics like Project Time Dashboard to help convey your message better graphically. This product is a premium product available for immediate download and is 100 percent editable in Powerpoint. Download this now and use it in your presentations to impress your audience.
-
 Real time dashboard ppt powerpoint presentation icon backgrounds cpb
Presenting this set of slides with name Real Time Dashboard Ppt Powerpoint Presentation Icon Backgrounds Cpb. This is an editable Powerpoint three stages graphic that deals with topics like Real Time Dashboard to help convey your message better graphically. This product is a premium product available for immediate download and is 100 percent editable in Powerpoint. Download this now and use it in your presentations to impress your audience.
-
 Alarm clock with dashboard for time management powerpoint slides
Presenting alarm clock with dashboard for time management powerpoint slides. This Power Point template slide has been crafted with graphic of alarm clock and dashboard. This PPT slide contains the concept of time management. Use this PPT slide for business and management related presentations.
-
 Clock design dashboard for time management powerpoint slides
Presenting clock design dashboard for time management powerpoint slides. This Power Point template slide has been crafted with graphic of clock design dashboard. This PPT slide contains the concept of time management. Use this PPT slide for business and finance related presentations.
-
 Real time data analysis dashboard snapshot icon
Presenting this set of slides with name Real Time Data Analysis Dashboard Snapshot Icon. This is a three stage process. The stages in this process are Real Time Data Analysis Dashboard Icon. This is a completely editable PowerPoint presentation and is available for immediate download. Download now and impress your audience.
-
 Average handling time dashboard snapshot
Presenting this set of slides with name Average Handling Time Dashboard snapshot. The topics discussed in these slides are Average Handling, Time, Dashboard. This is a completely editable PowerPoint presentation and is available for immediate download. Download now and impress your audience.
-
 Kpi dashboard of hr with average time fill by department
Presenting this set of slides with name KPI Dashboard Of HR With Average Time Fill By Department. The topics discussed in these slides are Customer Service, Sales, Marketing, Product Management, Data Science. This is a completely editable PowerPoint presentation and is available for immediate download. Download now and impress your audience.
-
 Qualify leads dashboard showing lifecycle over time
Presenting Qualify Leads Dashboard Showing Lifecycle Over Time. You can edit the slide as per your requirements. It is adaptable with Google Slides which makes it accessible at once. This slide is available in both the standard and widescreen aspect ratios. High-quality graphics ensures that there is no room for deterioration.
-
 Dashboard related to application programming interface average time ppt powerpoint presentation slide
This slide covers the API Application Programming Interface dashboard which includes Uptime History, Run Count, Errors, Average Time taken etc. Presenting this set of slides with name Dashboard Related To Application Programming Interface Average Time Ppt Powerpoint Presentation Slide. The topics discussed in these slides are Dashboard Related To Application Programming Interface Average Time. This is a completely editable PowerPoint presentation and is available for immediate download. Download now and impress your audience.
-
 Dashboard tracking quality time m1918 ppt powerpoint presentation pictures graphics tutorials
This slide provides information regarding the dashboard which will help quality team in managing different projects and keep track on the time, cost spent. Presenting this set of slides with name Dashboard Tracking Quality Time M1918 Ppt Powerpoint Presentation Pictures Graphics Tutorials. The topics discussed in these slides are Projects, Time, Team, Progress, Cost. This is a completely editable PowerPoint presentation and is available for immediate download. Download now and impress your audience.
-
 Time delivery dashboard ppt powerpoint presentation ideas graphics tutorials cpb
Presenting this set of slides with name Time Delivery Dashboard Ppt Powerpoint Presentation Ideas Graphics Tutorials Cpb. This is an editable Powerpoint six stages graphic that deals with topics like Time Delivery Dashboard to help convey your message better graphically. This product is a premium product available for immediate download and is 100 percent editable in Powerpoint. Download this now and use it in your presentations to impress your audience.
-
 Human resource department dashboard kpi with average recruitment time
Presenting this set of slides with name Human Resource Department Dashboard KPI With Average Recruitment Time. The topics discussed in these slides are Recruitment Funnel, Recruitment Process, HR Executive, Interview Candidates, Review Applications. This is a completely editable PowerPoint presentation and is available for immediate download. Download now and impress your audience.


