Powerpoint Templates and Google slides for Supply Chain KPI Dashboard
Save Your Time and attract your audience with our fully editable PPT Templates and Slides.
-
 Supply Chain Kpi Dashboard Powerpoint Presentation Slides
Presenting our supply chain KPI dashboard PowerPoint presentation slides. This PowerPoint design contains fifty-nine slides in it which can be completely customized and edited. It is available for both standard as well as for widescreen formats. This PowerPoint template is compatible with all the presentation software like Microsoft Office, Google Slides, etc. You can download this PPT layout from below.
-
 Supply Chain KPI Dashboard Powerpoint Ppt Template Bundles
Deliver a lucid presentation by utilizing this Supply Chain KPI Dashboard Powerpoint Ppt Template Bundles. Use it to present an overview of the topic with the right visuals, themes, shapes, and graphics. This is an expertly designed complete deck that reinforces positive thoughts and actions. Use it to provide visual cues to your audience and help them make informed decisions. A wide variety of discussion topics can be covered with this creative bundle such as Freight Bill KPI, Warehouse Capacity, Average Purchase Value, Supply Chain Metrics, Total Savings. All the twelve slides are available for immediate download and use. They can be edited and modified to add a personal touch to the presentation. This helps in creating a unique presentation every time. Not only that, with a host of editable features, this presentation can be used by any industry or business vertical depending on their needs and requirements. The compatibility with Google Slides is another feature to look out for in the PPT slideshow.
-
 KPI Dashboard For Monitoring Strategic Guide To Avoid Supply Chain Strategy SS V
Deliver an outstanding presentation on the topic using this KPI Dashboard For Monitoring Strategic Guide To Avoid Supply Chain Strategy SS V. Dispense information and present a thorough explanation of Warehousing Operating, Perfect Order Rate, Total Shipments using the slides given. This template can be altered and personalized to fit your needs. It is also available for immediate download. So grab it now.
-
 KPI Dashboard For Supply Chain Strategic Guide To Avoid Supply Chain Strategy SS V
Present the topic in a bit more detail with this KPI Dashboard For Supply Chain Strategic Guide To Avoid Supply Chain Strategy SS V. Use it as a tool for discussion and navigation on Performance Summary, Inventory Caring Cost, Product Stock Details. This template is free to edit as deemed fit for your organization. Therefore download it now.
-
 Supply Chain Kpi Dashboard For Strategic Guide To Avoid Supply Chain Strategy SS V
Mentioned slide illustrates KPI dashboard that can be used by managers to assess financial health of supply chain business. KPIs covered are supply chain costs versus sales, cash to order cycle, warehouse operating cost distribution etc.Present the topic in a bit more detail with this Supply Chain Kpi Dashboard For Strategic Guide To Avoid Supply Chain Strategy SS V. Use it as a tool for discussion and navigation on Weekly Schedule, Production Control, Car Manufacturer. This template is free to edit as deemed fit for your organization. Therefore download it now.
-
 Kpi Dashboard For Supply Chain Modernizing And Making Efficient And Customer Oriented Strategy SS V
Following slide displays warehouse management dashboard that can be used by supply chain organizations to monitor overall performance using KPIs. KPIs covered are return rate, back order rate, inventory days of supply, inventory carrying cost etc. Present the topic in a bit more detail with this Kpi Dashboard For Supply Chain Modernizing And Making Efficient And Customer Oriented Strategy SS V. Use it as a tool for discussion and navigation on Warehouse, Management, Dashboard. This template is free to edit as deemed fit for your organization. Therefore download it now.
-
 Supply Chain Kpi Dashboard For Modernizing And Making Efficient And Customer Oriented Strategy SS V
Mentioned slide illustrates KPI dashboard that can be used by managers to assess financial health of supply chain business. KPIs covered are supply chain costs versus sales, cash to order cycle, warehouse operating cost distribution etc. Deliver an outstanding presentation on the topic using this Supply Chain Kpi Dashboard For Modernizing And Making Efficient And Customer Oriented Strategy SS V. Dispense information and present a thorough explanation of Dashboard, Financial, Analysis using the slides given. This template can be altered and personalized to fit your needs. It is also available for immediate download. So grab it now.
-
 Campaign Cost Analysis With KPI Dashboard Sustainable Supply Chain MKT SS V
The following slide showcases green marketing campaign costs assessment to evaluate overall expenses and allocate funds adequately for future. It includes elements such as conversions, clicks, click through rate CTR, Ad group, cost per conversion, expense by location etc. Present the topic in a bit more detail with this Campaign Cost Analysis With KPI Dashboard Sustainable Supply Chain MKT SS V Use it as a tool for discussion and navigation on Conversions By Ad Group, Expense By Location, Dashboard This template is free to edit as deemed fit for your organization. Therefore download it now.
-
 Evaluating Impact Of Green Marketing With KPI Dashboard Sustainable Supply Chain MKT SS V
The following slide depicts dashboard to evaluate consequences of sustainable marketing on sales performance and plan future actions. It includes key performance indicators such as orders, net profit margin, sales by location, channel, packaging costs, sales price etc. Deliver an outstanding presentation on the topic using this Evaluating Impact Of Green Marketing With KPI Dashboard Sustainable Supply Chain MKT SS V Dispense information and present a thorough explanation of Evaluating Impact, Green Marketing, Dashboard using the slides given. This template can be altered and personalized to fit your needs. It is also available for immediate download. So grab it now.
-
 KPI Dashboard To Evaluate Energy Consumption Sustainable Supply Chain MKT SS V
The following slide depicts dashboard to measure energy utilization during the year at workplace to gain operational efficiency and develop smart ways to save for future. It includes elements such as progress by segment, transport, waste management, packaging, warehousing etc. Present the topic in a bit more detail with this KPI Dashboard To Evaluate Energy Consumption Sustainable Supply Chain MKT SS V Use it as a tool for discussion and navigation on Kpi Dashboard, Evaluate Energy Consumption This template is free to edit as deemed fit for your organization. Therefore download it now.
-
 Supply Chain Kpi Dashboard For Retail Business
Following slide showcases supply chain KPI dashboard for electronics business. The purpose of this slide is to allow business to track inventory level for fulfilling orders and delivering goods to customers. It also highlights key takeaways based on the overall analysis. Introducing our Supply Chain Kpi Dashboard For Retail Business set of slides. The topics discussed in these slides are Units Per Transaction, Inventory Turnover. This is an immediately available PowerPoint presentation that can be conveniently customized. Download it and convince your audience.
-
 Supply Chain Management Kpi Dashboard With Costing Details
This slide highlights supply chain management KPI dashboard along with costs. The purpose of this template is to monitor procurement ROI, cost reduction, saving and avoidance rate along with average costs incurred and key insights. Presenting our well structured Supply Chain Management Kpi Dashboard With Costing Details. The topics discussed in this slide are Cost Reduction, Procurement Roi.This is an instantly available PowerPoint presentation that can be edited conveniently. Download it right away and captivate your audience.
-
 Supply Chain Warehouse Management Kpi Dashboard
Following slide showcases KPI dashboard for supply chain warehouse management. The purpose of this template is to optimize supply chain process and create wide range of economic benefits for the company. It highlights product stock details, inventory carrying cost, etc with key takeaways. Presenting our well structured Supply Chain Warehouse Management Kpi Dashboard. The topics discussed in this slide are Return Rate, Inventory Turnover.This is an instantly available PowerPoint presentation that can be edited conveniently. Download it right away and captivate your audience.
-
 Supply Chain Kpi Dashboard For Analyzing Same Day Delivery
Following slide showcases supply chain KPI dashboard for same day delivery of products and services. This template provides a glimpse into performance and the type of services delivered. It also highlights critical takeaways based on the overall analysis Presenting our well structured Supply Chain Kpi Dashboard For Analyzing Same Day Delivery. The topics discussed in this slide are Segmentation, Delivery Market.This is an instantly available PowerPoint presentation that can be edited conveniently. Download it right away and captivate your audience.
-
 Technology Strategy KPI Dashboard To Access Supply Chain Enterprise
Following slides represents accessing supply chain technology strategy KPI dashboard for enhanced agility.It further covers on time delivery, stock out rate, inventory turnover and average time to sell.Introducing our Technology Strategy KPI Dashboard To Access Supply Chain Enterprise set of slides.The topics discussed in these slides are Inventory Turnover, Average Time, Time Delivery.This is an immediately available PowerPoint presentation that can be conveniently customized.Download it and convince your audience.
-
 Supply Chain KPI Dashboard To Measure Inventory Forecasting
This slide showcases the graphical representation of last year data to predict the next 5 year forecasting to reduce uncertainties in the supply chain. It includes various KPIs such as previous year forecasting, cost, forecasting accuracy, key insights, etc. Introducing our Supply Chain KPI Dashboard To Measure Inventory Forecasting set of slides. The topics discussed in these slides are Dashboard To Measure, Inventory Forecasting. This is an immediately available PowerPoint presentation that can be conveniently customized. Download it and convince your audience.
-
 Supply chain inventory kpis dashboard with carrying cost
Presenting our well structured Supply Chain Inventory KPIS Dashboard With Carrying Cost. The topics discussed in this slide are Inventory To Sales, Inventory Turnover, Inventory Accuracy. This is an instantly available PowerPoint presentation that can be edited conveniently. Download it right away and captivate your audience.
-
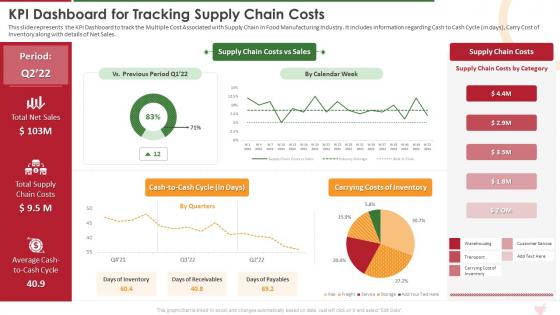 Kpi Dashboard For Tracking Supply Chain Costs Industry Report For Food Manufacturing Sector
This slide represents the KPI Dashboard to track the Multiple Cost Associated with Supply Chain in Food Manufacturing Industry. It includes information regarding Cash to Cash Cycle in days, Carry Cost of Inventory along with details of Net Sales. Present the topic in a bit more detail with this Kpi Dashboard For Tracking Supply Chain Costs Industry Report For Food Manufacturing Sector. Use it as a tool for discussion and navigation on Carrying Costs Of Inventory, Cash To Cash Cycle, Supply Chain Costs. This template is free to edit as deemed fit for your organization. Therefore download it now.
-
 Kpi Dashboard For Tracking Supply Chain Costs Market Research Report
This slide represents the KPI dashboard to track the multiple cost associated with supply chain in food manufacturing industry. It includes information regarding cash to cash cycle in days, carry cost of inventory along with details of net sales. Deliver an outstanding presentation on the topic using this Kpi Dashboard For Tracking Supply Chain Costs Market Research Report. Dispense information and present a thorough explanation of KPI Dashboard For Tracking Supply Chain Costs using the slides given. This template can be altered and personalized to fit your needs. It is also available for immediate download. So grab it now.
-
 KPI Dashboard For Tracking Supply Chain Costs Comprehensive Analysis
This slide represents the KPI dashboard to track the multiple cost associated with supply chain in food manufacturing industry. It includes information regarding cash to cash cycle in days, carry cost of inventory along with details of net sales. Present the topic in a bit more detail with this KPI Dashboard For Tracking Supply Chain Costs Comprehensive Analysis. Use it as a tool for discussion and navigation on Supply Chain Costs, Previous Period, Calendar Week. This template is free to edit as deemed fit for your organization. Therefore download it now.
-
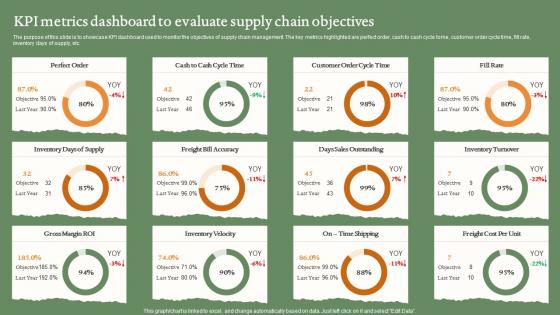 KPI Metrics Dashboard To Evaluate Supply Chain Objectives
The purpose of this slide is to showcase KPI dashboard used to monitor the objectives of supply chain management. The key metrics highlighted are perfect order, cash to cash cycle tome, customer order cycle time, fill rate, inventory days of supply, etc. Introducing our KPI Metrics Dashboard To Evaluate Supply Chain Objectives set of slides. The topics discussed in these slides are KPI Metrics Dashboard, Evaluate, Supply Chain Objectives. This is an immediately available PowerPoint presentation that can be conveniently customized. Download it and convince your audience.
-
 Kpi Dashboard For Tracking Supply Chain Costs Industry 4 0 Application Production
This slide represents the KPI dashboard to track the multiple cost associated with supply chain in food manufacturing industry. It includes information regarding cash to cash cycle in days, carry cost of inventory along with details of net sales. Deliver an outstanding presentation on the topic using this Kpi Dashboard For Tracking Supply Chain Costs Industry 4 0 Application Production. Dispense information and present a thorough explanation of KPI Dashboard For Tracking Supply Chain Costs using the slides given. This template can be altered and personalized to fit your needs. It is also available for immediate download. So grab it now.
-
 KPI Dashboard Highlighting Automation Results In Supply Chain Strengthening Process Improvement
The following slide outlines a comprehensive dashboard depicting the business process automation BPA results in the supply chain. Information covered in the slide is related to average order processing days, average shipping days, etc. Present the topic in a bit more detail with this KPI Dashboard Highlighting Automation Results In Supply Chain Strengthening Process Improvement. Use it as a tool for discussion and navigation on Shipment Status, Average Order Processing Days, Average Order Fulfillment Days, Late Deliveries By Warehouse, Late Deliveries Product. This template is free to edit as deemed fit for your organization. Therefore download it now.
-
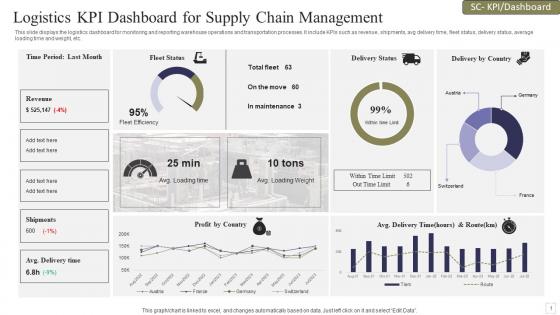 Logistics KPI Dashboard Snapshot For Supply Chain Management
This slide displays the logistics dashboard for monitoring and reporting warehouse operations and transportation processes. It include KPIs such as revenue, shipments, avg delivery time, fleet status, delivery status, average loading time and weight, etc. Presenting our well structured Logistics KPI Dashboard Snapshot For Supply Chain Management. The topics discussed in this slide are Logistics KPI Dashboard, Supply Chain Management, Revenue. This is an instantly available PowerPoint presentation that can be edited conveniently. Download it right away and captivate your audience.
-
 KPI Dashboard For Tracking Supply Chain Costs Industry Overview Of Food
This slide represents the KPI dashboard to track the multiple cost associated with supply chain in food manufacturing industry. It includes information regarding cash to cash cycle in days, carry cost of inventory along with details of net sales. Present the topic in a bit more detail with this KPI Dashboard For Tracking Supply Chain Costs Industry Overview Of Food. Use it as a tool for discussion and navigation on Supply Chain Costs, Sales, Dashboard. This template is free to edit as deemed fit for your organization. Therefore download it now.
-
 KPI Dashboard For Tracking Supply Chain Costs Ppt Powerpoint Presentation File Infographic Template
This slide represents the KPI dashboard to track the multiple cost associated with supply chain in food manufacturing industry. It includes information regarding cash to cash cycle in days, carry cost of inventory along with details of net sales. Deliver an outstanding presentation on the topic using this KPI Dashboard For Tracking Supply Chain Costs Ppt Powerpoint Presentation File Infographic Template. Dispense information and present a thorough explanation of KPI Dashboard, Tracking Supply, Chain Costs using the slides given. This template can be altered and personalized to fit your needs. It is also available for immediate download. So grab it now.
-
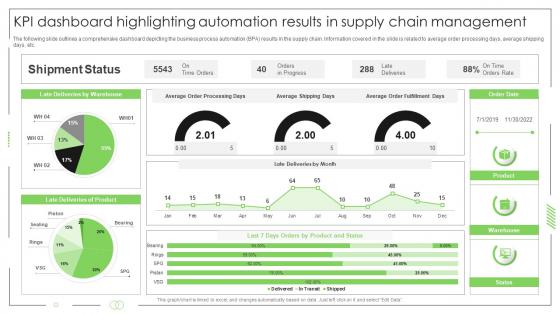 Business Process Automation KPI Dashboard Highlighting Automation Results In Supply Chain Management
The following slide outlines a comprehensive dashboard depicting the business process automation BPA results in the supply chain. Information covered in the slide is related to average order processing days, average shipping days, etc.Deliver an outstanding presentation on the topic using this Business Process Automation KPI Dashboard Highlighting Automation Results In Supply Chain Management. Dispense information and present a thorough explanation of Shipment Status, Late Deliveries, Deliveries Product using the slides given. This template can be altered and personalized to fit your needs. It is also available for immediate download. So grab it now.
-
 KPI Dashboard To Track Supply Chain Solutions Performance
Mentioned slide outlines key performance indicator KPI dashboard which can be used by an organization to measure the performance of supply chain solutions. The major metrics covered in the template are units per transaction, stock turnover, out of stock percentage, etc. Introducing our KPI Dashboard To Track Supply Chain Solutions Performance set of slides. The topics discussed in these slides are Units Per Transaction, Stock Turnover, Out Of Stocks. This is an immediately available PowerPoint presentation that can be conveniently customized. Download it and convince your audience.
-
 KPI Dashboard Highlighting Automation Results In Supply Chain Introducing Automation Tools
The following slide outlines a comprehensive dashboard depicting the business process automation BPA results in the supply chain. Information covered in the slide is related to average order processing days, average shipping days, etc.Present the topic in a bit more detail with this KPI Dashboard Highlighting Automation Results In Supply Chain Introducing Automation Tools. Use it as a tool for discussion and navigation on Orders Progress, Late Deliveries, Order Fulfillment. This template is free to edit as deemed fit for your organization. Therefore download it now.
-
 KPI Dashboard For Monitoring Warehouse Operations Stand Out Supply Chain Strategy
Mentioned slide illustrates warehouse operations dashboard with key performance indicators KPIs . KPIs included are operating cost, order rate, total shipment by country and on time shipment. Present the topic in a bit more detail with this KPI Dashboard For Monitoring Warehouse Operations Stand Out Supply Chain Strategy. Use it as a tool for discussion and navigation on Warehousing, Operating, Costs. This template is free to edit as deemed fit for your organization. Therefore download it now.
-
 KPI Dashboard For Supply Chain Warehouse Management Stand Out Supply Chain Strategy
Following slide displays warehouse management dashboard that can be used by supply chain organizations to monitor overall performance using KPIs. KPIs covered are return rate, back order rate, inventory days of supply, inventory carrying cost etc. Deliver an outstanding presentation on the topic using this KPI Dashboard For Supply Chain Warehouse Management Stand Out Supply Chain Strategy. Dispense information and present a thorough explanation of Warehouse Performance, Inventory Days Of Supply, Sales using the slides given. This template can be altered and personalized to fit your needs. It is also available for immediate download. So grab it now.
-
 Supply Chain KPI Dashboard For Effective Financial Analysis Stand Out Supply Chain Strategy
Mentioned slide illustrates KPI dashboard that can be used by managers to assess financial health of supply chain business. KPIs covered are supply chain costs versus sales, cash to order cycle, warehouse operating cost distribution etc. Present the topic in a bit more detail with this Supply Chain KPI Dashboard For Effective Financial Analysis Stand Out Supply Chain Strategy. Use it as a tool for discussion and navigation on Supply Chain, Costs Of Inventory, Operating Cost. This template is free to edit as deemed fit for your organization. Therefore download it now.
-
 KPI Dashboard For Monitoring Warehouse Operations Taking Supply Chain Performance Strategy SS V
Mentioned slide illustrates warehouse operations dashboard with key performance indicators KPIs. KPIs included are operating cost, order rate, total shipment by country and on-time shipment. Deliver an outstanding presentation on the topic using this KPI Dashboard For Monitoring Warehouse Operations Taking Supply Chain Performance Strategy SS V. Dispense information and present a thorough explanation of Warehousing Operating Costs, Perfect Order Rate using the slides given. This template can be altered and personalized to fit your needs. It is also available for immediate download. So grab it now.
-
 KPI Dashboard For Supply Chain Warehouse Taking Supply Chain Performance Strategy SS V
Following slide displays warehouse management dashboard that can be used by supply chain organizations to monitor overall performance using KPIs. KPIs covered are return rate, back order rate, inventory days of supply, inventory carrying cost etc. Present the topic in a bit more detail with this KPI Dashboard For Supply Chain Warehouse Taking Supply Chain Performance Strategy SS V. Use it as a tool for discussion and navigation on Warehouse Performance Summary, Inventory Days Of Supply. This template is free to edit as deemed fit for your organization. Therefore download it now.
-
 Supply Chain KPI Dashboard For Effective Financial Analysis Taking Supply Chain Performance Strategy SS V
Mentioned slide illustrates KPI dashboard that can be used by managers to assess financial health of supply chain business. KPIs covered are supply chain costs versus sales, cash to order cycle, warehouse operating cost distribution etc. Present the topic in a bit more detail with this Supply Chain KPI Dashboard For Effective Financial Analysis Taking Supply Chain Performance Strategy SS V. Use it as a tool for discussion and navigation on Time Shipping, Carrying Costs Of Inventory. This template is free to edit as deemed fit for your organization. Therefore download it now.
-
 Kpi Dashboard For Supply Chain Successful Strategies To And Responsive Supply Chains Strategy SS
Following slide displays warehouse management dashboard that can be used by supply chain organizations to monitor overall performance using KPIs. KPIs covered are return rate, back order rate, inventory days of supply, inventory carrying cost etc. Present the topic in a bit more detail with this Kpi Dashboard For Supply Chain Successful Strategies To And Responsive Supply Chains Strategy SS. Use it as a tool for discussion and navigation on Dashboard, Management, Organizations. This template is free to edit as deemed fit for your organization. Therefore download it now.
-
 Supply Chain Kpi Dashboard For Effective Successful Strategies To And Responsive Supply Chains Strategy SS
Mentioned slide illustrates KPI dashboard that can be used by managers to assess financial health of supply chain business. KPIs covered are supply chain costs versus sales, cash to order cycle, warehouse operating cost distribution etc. Deliver an outstanding presentation on the topic using this Supply Chain Kpi Dashboard For Effective Successful Strategies To And Responsive Supply Chains Strategy SS. Dispense information and present a thorough explanation of Dashboard, Financial, Analysis using the slides given. This template can be altered and personalized to fit your needs. It is also available for immediate download. So grab it now.
-
 Kpi Dashboard For Monitoring Cultivating Supply Chain Agility To Succeed Environment Strategy SS V
This slide showcases the ideal flow diagram of end-to-end supply chain process following digital transformation. Stages covered are e-sourcing, digital factory design, real-time scheduling, digital manufacturing procedures etc. Deliver an outstanding presentation on the topic using this Kpi Dashboard For Monitoring Cultivating Supply Chain Agility To Succeed Environment Strategy SS V. Dispense information and present a thorough explanation of Process, Manufacturing, Management using the slides given. This template can be altered and personalized to fit your needs. It is also available for immediate download. So grab it now.
-
 Kpi Dashboard For Supply Chain Cultivating Supply Chain Agility To Succeed Environment Strategy SS V
Mentioned slide illustrates warehouse operations dashboard with key performance indicators KPIs. KPIs included are operating cost, order rate, total shipment by country and on-time shipment. Present the topic in a bit more detail with this Kpi Dashboard For Supply Chain Cultivating Supply Chain Agility To Succeed Environment Strategy SS V. Use it as a tool for discussion and navigation on Dashboard, Operations, Monitoring. This template is free to edit as deemed fit for your organization. Therefore download it now.
-
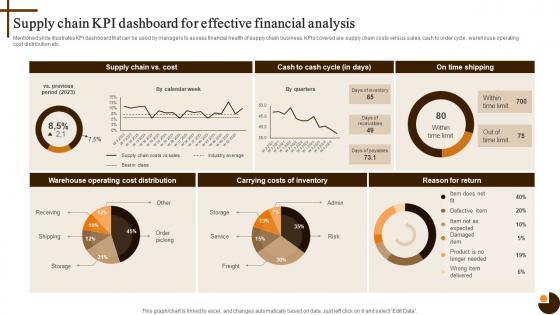 Supply Chain Kpi Dashboard For Effective Cultivating Supply Chain Agility To Succeed Environment Strategy SS V
Mentioned slide illustrates KPI dashboard that can be used by managers to assess financial health of supply chain business. KPIs covered are supply chain costs versus sales, cash to order cycle, warehouse operating cost distribution etc. Deliver an outstanding presentation on the topic using this Supply Chain Kpi Dashboard For Effective Cultivating Supply Chain Agility To Succeed Environment Strategy SS V. Dispense information and present a thorough explanation of Dashboard, Financial, Analysis using the slides given. This template can be altered and personalized to fit your needs. It is also available for immediate download. So grab it now.
-
 Environmental sustainability kpi dashboard showing social footprint and supply chain category
Presenting this set of slides with name - Environmental Sustainability Kpi Dashboard Showing Social Footprint And Supply Chain Category. This is a six stage process. The stages in this process are Environment Sustainability, Environment Continual, Environment Feasibility.
-
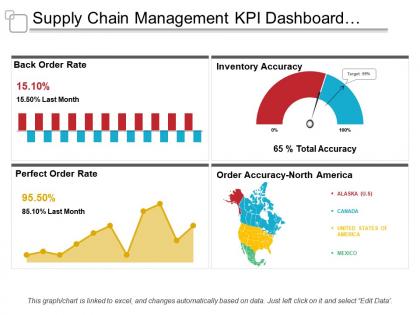 Supply chain management kpi dashboard showing back order rate and order accuracy
Presenting this set of slides with name - Supply Chain Management Kpi Dashboard Showing Back Order Rate And Order Accuracy. This is a four stage process. The stages in this process are Demand Forecasting, Predicting Future Demand, Supply Chain Management.
-
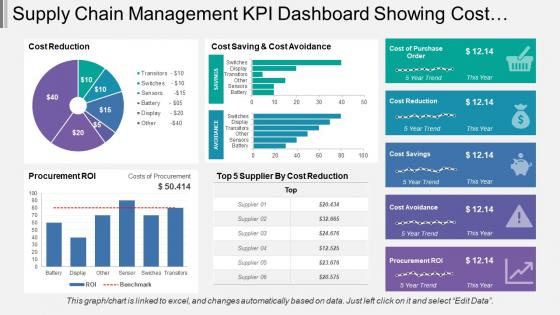 Supply Chain Management Kpi Dashboard Showing Cost Reduction And Procurement Roi
Presenting this set of slides with name - Supply Chain Management Kpi Dashboard Showing Cost Reduction And Procurement Roi. This is a five stage process. The stages in this process are Demand Forecasting, Predicting Future Demand, Supply Chain Management.
-
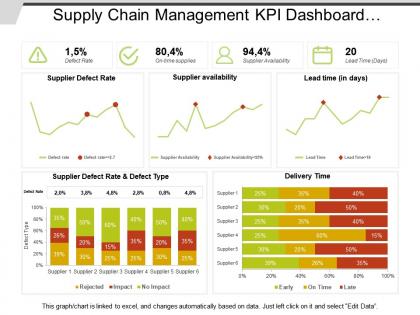 Supply chain management kpi dashboard showing defect rate and delivery time
Presenting this set of slides with name - Supply Chain Management Kpi Dashboard Showing Defect Rate And Delivery Time. This is a three stage process. The stages in this process are Demand Forecasting, Predicting Future Demand, Supply Chain Management.
-
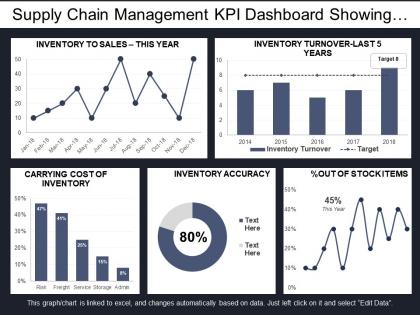 Supply chain management kpi dashboard showing inventory accuracy and turnover
Presenting this set of slides with name - Supply Chain Management Kpi Dashboard Showing Inventory Accuracy And Turnover. This is a five stage process. The stages in this process are Demand Forecasting, Predicting Future Demand, Supply Chain Management.
-
 Supply chain management kpi dashboard showing order status volume and inventory
Presenting this set of slides with name - Supply Chain Management Kpi Dashboard Showing Order Status Volume And Inventory. This is a two stage process. The stages in this process are Demand Forecasting, Predicting Future Demand, Supply Chain Management.
-
 Supply chain management kpi dashboard showing procurement vs utilization
Presenting this set of slides with name - Supply Chain Management Kpi Dashboard Showing Procurement Vs Utilization. This is a six stage process. The stages in this process are Demand Forecasting, Predicting Future Demand, Supply Chain Management.
-
 Supply chain management kpi dashboard showing quarterly inventory and asset turnover
Presenting this set of slides with name - Supply Chain Management Kpi Dashboard Showing Quarterly Inventory And Asset Turnover. This is a ten stage process. The stages in this process are Demand Forecasting, Predicting Future Demand, Supply Chain Management.
-
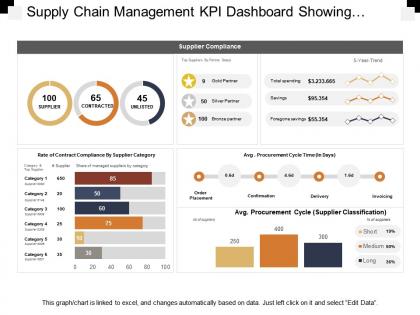 Supply chain management kpi dashboard showing supplier compliance stats
Presenting this set of slides with name - Supply Chain Management Kpi Dashboard Showing Supplier Compliance Stats. This is a four stage process. The stages in this process are Demand Forecasting, Predicting Future Demand, Supply Chain Management.
-
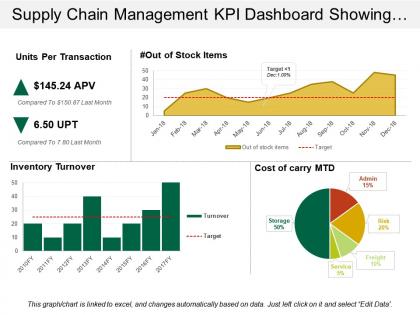 Supply chain management kpi dashboard showing units per transaction
Presenting predesigned Supply Chain Management KPI Dashboard Showing Warehouse Operating Costs PPT slide. Download of the template design is simple. You can modify the layout font type, font size, colors and the background as per needs. Template slide is fully flexible with Google Slides and other online software’s. You can alter the design using the instructional slides provided with the template. You can remove the watermark with your brand name, trademark, signature or logo. You can save the template into PNG or JPEG formats. Supreme quality layouts are used to create this template which is editable in PowerPoint. Sample content can be replaced with your presentation content.
-
 Supply chain management kpi dashboard showing warehouse operating costs
Presenting predesigned Supply Chain Management KPI Dashboard Showing Warehouse Operating Costs PPT slide. Download of the template design is simple. You can modify the layout font type, font size, colors and the background as per needs. Template slide is fully flexible with Google Slides and other online software’s. You can alter the design using the instructional slides provided with the template. You can remove the watermark with your brand name, trademark, signature or logo. You can save the template into PNG or JPEG formats. Supreme quality layouts are used to create this template which is editable in PowerPoint. Sample content can be replaced with your presentation content.
-
 Supply chain kpi dashboard management ppt powerpoint presentation summary graphics tutorials
Presenting this set of slides with name - Supply Chain Kpi Dashboard Management Ppt Powerpoint Presentation Summary Graphics Tutorials. This is a four stages process. The stages in this process are Finance, Marketing, Management, Investment, Analysis.
-
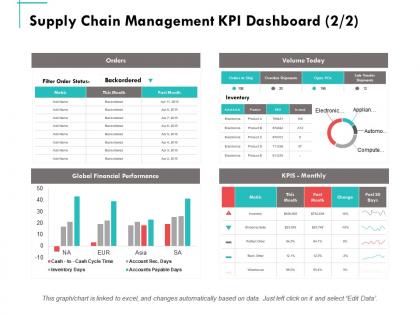 Supply chain management kpi dashboard business ppt powerpoint presentation summary maker
Presenting this set of slides with name - Supply Chain Management Kpi Dashboard Business Ppt Powerpoint Presentation Summary Maker. This is a four stages process. The stages in this process are Finance, Marketing, Management, Investment, Analysis.
-
 Supply chain kpi dashboard 1 2 ppt powerpoint presentation gallery slides
Presenting this set of slides with name - Supply Chain Kpi Dashboard 1 2 Ppt Powerpoint Presentation Gallery Slides. This is a four stage process. The stages in this process are Business, Management, Strategy, Analysis, Finance.
-
 Supply chain management kpi dashboard 2 2 ppt powerpoint presentation gallery visuals
Presenting this set of slides with name - Supply Chain Management Kpi Dashboard 2 2 Ppt Powerpoint Presentation Gallery Visuals. This is a two stage process. The stages in this process are Business, Management, Strategy, Analysis, Finance.
-
 Supply chain kpi dashboard ppt powerpoint presentation infographics grid
Presenting this set of slides with name - Supply Chain KPI Dashboard Ppt Powerpoint Presentation Infographics Grid. This is a four stage process. The stages in this process are Inventory Turnover, Service, Marketing, Analysis, Investment.
-
 Supply chain management kpi dashboard finance ppt powerpoint presentation files
Presenting this set of slides with name - Supply Chain Management KPI Dashboard Finance Ppt Powerpoint Presentation Files. This is a four stage process. The stages in this process are Customer, Inventory, Marketing, Strategy, Planning.
-
 Supply chain kpi dashboard production management ppt powerpoint presentation model rules
Present the topic in a bit more detail with this Supply Chain KPI Dashboard Production Management Ppt Powerpoint Presentation Model Rules. Use it as a tool for discussion and navigation on Inventory Turnover, Cost, Units Per Transaction, Stock Items. This template is free to edit as deemed fit for your organization. Therefore download it now.
-
 Supply chain management kpi dashboard production management ppt outline pictures
Present the topic in a bit more detail with this Supply Chain Management KPI Dashboard Production Management Ppt Outline Pictures. Use it as a tool for discussion and navigation on Global, Financial, Performance, Inventory. This template is free to edit as deemed fit for your organization. Therefore download it now.
-
 Supply chain inventory kpi dashboard with active loadouts
Introducing our Supply Chain Inventory KPI Dashboard With Active Loadouts set of slides. The topics discussed in these slides are Active Projects, Completed Tasks, Completed Projects. This is an immediately available PowerPoint presentation that can be conveniently customized. Download it and convince your audience.


