Powerpoint Templates and Google slides for Statistically
Save Your Time and attract your audience with our fully editable PPT Templates and Slides.
-
 Pie chart statistics and coins powerpoint templates ppt themes and graphics 0213
We are proud to present our pie chart statistics and coins powerpoint templates ppt themes and graphics 0213. Great marketing powerpoint templates are the right combination of quality graphics quality animations few words and limited transitions we have them all and even more. When you provide business solutions to clients you have to present it in such a way that your clients become interested. Well designed finance powerpoint templates can help you do that in very limited time.
-
 Discussion on statistical business powerpoint templates ppt themes and graphics 0213
We are proud to present our discussion on statistical business powerpoint templates ppt themes and graphics 0213. Take a leap off the starting blocks with our Ppeople powerPoint templates. They will put you ahead of the competition in quick time. Put the wind in your sails with our business powerPoint templates. Skim smoothly over the choppy waters of the market.
-
 Bar graphs powerpoint growth statistics templates and themes
We are proud to present our bar graphs powerpoint growth statistics templates and themes. Timeline crunches are a fact of life. Meet all deadlines using our bar graphs PowerPoint growth statistics templates and themes. Connect the dots using our bar graphs power point growth statistics templates and themes. Fan expectations as the whole picture emerges.
-
 Business financial statistics templates and themes process model presentation
We are proud to present our business financial statistics templates and themes process model presentation. Hit the ground running with our Business Financial Statistics Templates and Themes Process Model Presentation Go the full distance with ease and elan. Leave a lasting impression with our Business Financial Statistics Templates and Themes Process Model Presentation They possess an inherent longstanding recall factor.
-
 Business financial statistics templates and themes work flow process presentation
We are proud to present our business financial statistics templates and themes work flow process presentation. Our great team has conjured up a web of Business Financial Statistics Templates and Themes Work Flow Process Presentation Use them to string together your glistening ideas. Think of it and be sure we have it. Our Business Financial Statistics Templates and Themes Work Flow Process Presentation offer you the widest possible range of options.
-
 Financial statistics golden powerpoint templates and themes business flow chart
We are proud to present our financial statistics golden powerpoint templates and themes business flow chart. Our Financial Statistics Golden PowerPoint Templates and Themes Business Flow Chart will provide weight to your words. They will bring out the depth of your thought process. Words like arrows fly straight and true. Use our Financial Statistics Golden PowerPoint Templates and Themes Business Flow Chart to make them hit bulls eye every time.
-
 Financial statistics templates and themes sample business process presentation
We are proud to present our financial statistics templates and themes sample business process presentation. Our Financial Statistics Templates And Themes Sample Business Process Presentation are the chords of your song. String them along and provide the lilt to your views. Our Financial Statistics Templates And Themes Sample Business Process Presentation help you pinpoint your timelines. Highlight the reasons for your deadlines with their use.
-
 Strategy business financial statistics and themes network presentation for small
We are proud to present our strategy business financial statistics and themes network presentation for small. Our Strategy Business Financial Statistics and Themes Network Presentation for Small give you that extra zing. Add your views and make your audience sing. Our pretty Strategy Business Financial Statistics and Themes Network Presentation for Small are like snowflakes that fall. Gather them together and have a ball. Put your wondrously glowing ideas into them. Bind them together and create mayhem.
-
 Strategy business financial statistics templates and themes charts
We are proud to present our strategy business financial statistics templates and themes charts. Dig in to our vast array of Strategy Business Financial Statistics Templates and Themes Charts Be sure to come with many that fit your need perfectly. Unleash the value of your experience with our Strategy Business Financial Statistics Templates and Themes Charts Educate your team with the knowledge you have gained.
-
 Strategy financial statistics templates and themes business network presentation
We are proud to present our strategy financial statistics templates and themes business network presentation. Our Strategy Financial Statistics Templates and Themes Business Network Presentation give good value for money. They also have respect for the value of your time. Take a leap off the starting blocks with our Strategy Financial Statistics Templates and Themes Business Network Presentation They will put you ahead of the competition in quick time.
-
 Strategy financial statistics templates and themes business plan presentation
We are proud to present our strategy financial statistics templates and themes business plan presentation. Put the wind in your sails with our Strategy Financial Statistics Templates and Themes Business Plan Presentation Skim smoothly over the choppy waters of the market. Let our Strategy Financial Statistics Templates and Themes Business Plan Presentation give the updraft to your ideas. See them soar to great heights with ease.
-
 3d person explaining statistics chart ppt graphics icons powerpoint
We are proud to present our 3d person explaining statistics chart ppt graphics icons powerpoint. Visually support your Microsoft office PPT Presentation with our above template. Use our template to illustrate what you say. Use this template to highlight the key issues of your presentation.
-
 Growth statistics bar graphs templates with red arrow business ppt slides powerpoint
We are proud to present our growth statistics bar graphs templates with red arrow business ppt slides powerpoint. This Business PowerPoint template contains an image of key with dollar sign. The image depicts the concept of money or wealth. This PowerPoint template can be used in presentations relating to business, finance, strategy, economy, solution and stability.
-
 Growth statistics bar graphs powerpoint templates business marketing ppt slides
We are proud to present our growth statistics bar graphs powerpoint templates business marketing ppt slides. This PowerPoint template shows image of bar graph with success written on it. This template can be used for presentations related to business, success, growth and development.
-
 Growth statistics bar graphs templates business success strategy ppt slides powerpoint
We are proud to present our growth statistics bar graphs templates business success strategy ppt slides powerpoint. This PowerPoint contains the image of bar graph with dollar sign. You can make your Business PPT realistic and impress your audience with this bar graph dollar Image.
-
 Growth statistics bar graphs templates business success finance ppt slide powerpoint
We are proud to present our growth statistics bar graphs templates business success finance ppt slide powerpoint. This background image is Target bar graph PowerPoint background. This gives extremely attractive look to the presentations.
-
 Growth blank bar graphs templates statistics business education ppt backgrounds powerpoint
We are proud to present our growth blank bar graphs templates statistics business education ppt backgrounds powerpoint. This Power Point Template shows dew drops on Green Leaf with word Nature. A perfect images to give you the best and brightest look to your Go Green PowerPoint presentation
-
 Growth statistics bar graphs powerpoint templates progress global ppt themes
We are proud to present our growth statistics bar graphs powerpoint templates progress global ppt themes. Business PowerPoint template consisting of bar graph showing growth and standing business people. It shows the concept of global business and development in business. This template can be used in presentations relating to business, finance, profit, success and progress.
-
 Illustration of colorful pie chart statistical data powerpoint templates ppt themes and graphics 0313
We are proud to present our illustration of colorful pie chart statistical data powerpoint templates ppt themes and graphics 0313. Our Colorful Powerpoint Templates give you the basic framework of your talk. Give it the shape you desire with your wonderful views. Our Marketing Powerpoint Templates are the lungs of your talk. Fill them with the oxygen of your indepth thought process.
-
 Pie chart represents statistics marketing powerpoint templates ppt themes and graphics 0313
We are proud to present our pie chart represents statistics marketing powerpoint templates ppt themes and graphics 0313. Let our Colorful Powerpoint Templates mark the footprints of your journey. Illustrate how they will lead you to your desired destination. Conjure up grand ideas with our magical Marketing Powerpoint Templates. Leave everyone awestruck by the end of your presentation.
-
 Statistical data analysis marketing powerpoint templates ppt themes and graphics 0313
We are proud to present our statistical data analysis marketing powerpoint templates ppt themes and graphics 0313. Channelise the thoughts of your team with our Success Powerpoint Templates. Urge them to focus on the goals you have set. Give impetus to the hopes of your colleagues. Our Design Powerpoint Templates will aid you in winning their trust.
-
 Data driven 3d bar chart for business statistics powerpoint slides
We are proud to present our data driven 3d bar chart for business statistics powerpoint slides. This Professionally designed PowerPoint template shows bar chart for business statistics. Using visual representations to present data and evaluation of activities makes audience easier to understand.
-
 Data driven 3d bar chart for research in statistics powerpoint slides
Presenting data driven 3d bar chart for research in statistics presentation slides. Effortlessly alterable template slide as stats in excel sheet styles are customizable. This presentation slide is entirely flexible with Google Slides. Easy to download this template and save into JPEG and PDF format. Application of the best graphics, color, and icons. Quick to insert organization image, name, signature, copyright and picture for personalization of slide. Graphics quality does not get harm when displayed on widescreen. Instructional slides are available for guidance.
-
 Data driven 3d chart for interpretation of statistics powerpoint slides
We are proud to present our data driven 3d chart for interpretation of statistics powerpoint slides. A bar graph is composed of discrete bars that represent different categories of data. The length or height of the bar is equal to the quantity within that category of data. Bar graphs are best used to compare values across categories.
-
 Data driven 3d chart for statistical process powerpoint slides
Designed comes with professional approach as color and shape blend well. PowerPoint design can be viewed in standard and widescreen view. Easy to adjustable PPT slide as works well Google slides. Presentation template is easy to edit and amend elements like font, text, color etc. Top in picture and pixel quality. Harmonious with software options such as JPEG and PDF. PowerPoint graphic can be modified with corporate details as it comes with access to add business name
-
 Data driven 3d interpretation of statistical quality control powerpoint slides
We are proud to present our data driven 3d interpretation of statistical quality control powerpoint slides. Our Data Driven 3D Interpretation Of Statistical Quality Control Powerpoint Slides Power Point Templates Are Creatively Constructed And Eye Catching. Focus Attention On The Key Issues Of Your Presentation. Use Our Data Driven 3D Interpretation Of Statistical Quality Control Powerpoint Slides Power Point Templates And Nail The Day. Lead Your Team Show Them The Way.
-
 Data driven 3d pie chart for business statistics powerpoint slides
We are proud to present our data driven 3d pie chart for business statistics powerpoint slides. Put The Wind In Your Sails With Our Data Driven 3D Pie Chart For Business Statistics Powerpoint Slides Power Point Templates. Skim Smoothly Over The Choppy Waters Of The Market. Let Our Data Driven 3D Pie Chart For Business Statistics Powerpoint Slides Power Point Templates Give The Updraft To Your Ideas. See Them Soar To Great Heights With Ease.
-
 Data driven 3d statistical process column chart powerpoint slides
We are proud to present our data driven 3d statistical process column chart powerpoint slides. Use Our Data Driven 3D Statistical Process Column Chart Powerpoint Slides Power Point Templates Get Your Audience In Sync. Grab Their Eyeballs They Won?t Even Blink. You Work The Stage With An Air Of Royalty. Let Our Data Driven 3D Statistical Process Column Chart Powerpoint Slides Power Point Templates Be The Jewels In Your Crown.
-
 Data driven 3d statistical quality control chart powerpoint slides
We are proud to present our data driven 3d statistical quality control chart powerpoint slides. Put Your Wonderful Verbal Artistry On Display. Our Data Driven 3D Statistical Quality Control Chart Powerpoint Slides Power Point Templates Will Provide You The Necessary Glam And Glitter. You Have The Co-Ordinates For Your Destination Of Success. Let Our Data Driven 3D Statistical Quality Control Chart Powerpoint Slides Power Point Templates Map Out Your Journey.
-
 1013 statistical data analysis in marketing powerpoint templates ppt themes and graphics
We are proud to present our 1013 statistical data analysis in marketing powerpoint templates ppt themes and graphics. You Are An Avid Believer In Ethical Practices. Highlight The Benefits That Accrue With Our Finance Power Point Templates. Set Your Controls For The Heart Of The Sun. Our Marketing Power Point Templates Will Be The Propellant To Get You There.
-
 Data driven categorical statistics doughnut chart powerpoint slides
We are proud to present our data driven categorical statistics doughnut chart powerpoint slides. Our Data Driven Categorical Statistics Doughnut Chart Powerpoint slides Power Point Templates Give You That Extra Zing. Add Your Views And Make Your Audience Sing. Our Pretty Data Driven Categorical Statistics Doughnut Chart Powerpoint slides Power Point Templates Are Like Snowflakes That Fall. Gather Them Together And Have A Ball. Put Your Wondrously Glowing Ideas Into Them. Bind Them Together And Create Mayhem.
-
 Data driven demonstrate statistics with scatter chart powerpoint slides
We are proud to present our data driven demonstrate statistics with scatter chart powerpoint slides. Dig In To Our Vast Array Of Data Driven Demonstrate Statistics With Scatter Chart Powerpoint slides Power Point Templates. Be Sure To Come With Many That Fit Your Need Perfectly. Unleash The Value Of Your Experience With Our Data Driven Demonstrate Statistics With Scatter Chart Powerpoint slides Power Point Templates. Educate Your Team With The Knowledge You Have Gained.
-
 Analysis of statistical business graph powerpoint templates ppt themes and graphics 0313
We are proud to present our analysis of statistical business graph powerpoint templates ppt themes and graphics 0313. Hit the ground running with our Analysis Of Statistical Business Graph PowerPoint Templates PPT Themes And Graphics 0313. Go the full distance with ease and elan.
-
 Statistical data analysis in marketing powerpoint templates ppt themes and graphics 0313
We are proud to present our statistical data analysis in marketing powerpoint templates ppt themes and graphics 0313. You are an avid believer in ethical practices. Highlight the benefits that accrue with our Statistical Data Analysis In Marketing PowerPoint Templates PPT Themes And Graphics 0313 Set your controls for the heart of the sun.
-
 0313 statistical business graph powerpoint templates ppt themes and graphics
We are proud to present our 0313 statistical business graph powerpoint templates ppt themes and graphics. You have gained great respect for your brilliant ideas. Use our Finance to strengthen and enhance your reputation. Channelise the thoughts of your team with our Marketing. Urge them to focus on the goals you have set.
-
 0413 business growth graph and statistical chart powerpoint templates ppt themes and graphics
We are proud to present our 0413 business growth graph and statistical chart powerpoint templates ppt themes and graphics. Honors Your Audience With A Grand Parade Of Your Thoughts. Shower On Them The Confetti Of Our Business Growth Graph And Statistical Chart PowerPoint Templates PPT Themes And Graphics 0413 Power Point Templates. Set New Benchmarks With Our Business Growth Graph And Statistical Chart PowerPoint Templates PPT Themes And Graphics 0413 Power Point Templates. They Will Keep Your Prospects Well Above Par.
-
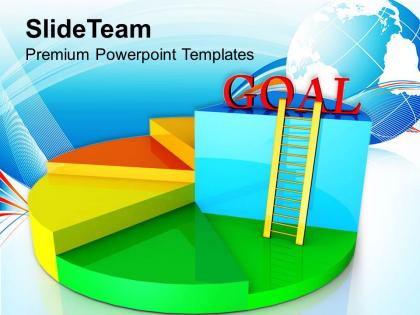 0413 statistical business achievement goal powerpoint templates ppt themes and graphics
We are proud to present our 0413 statistical business achievement goal powerpoint templates ppt themes and graphics. Our Finance Powerpoint Templates are creatively constructed and eye catching. Focus attention on the key issues of your presentation. Use our Marketing Powerpoint Templates and nail the day. Lead your team show them the way.
-
 0814 colored bars inside the circle for business statistics image graphics for powerpoint
We are proud to present our 0814 colored bars inside the circle for business statistics image graphics for powerpoint. This image slide displays colored bars inside the circle for business statistics. This image slide has been designed with 3d graphic of circle having colored bars of different heights in it . This image slide depicts statistics. This power point template may be used to display wide variety of information. Representing data in this form makes it easy to compare and draw conclusions. This image slide would be a great visual aid for your information.
-
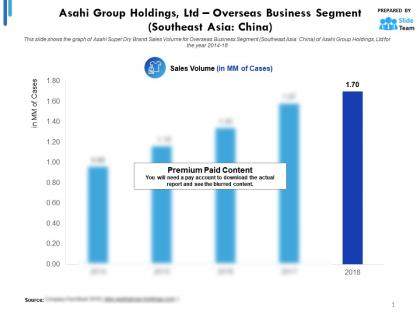 Asahi group holdings ltd statistic 1 overseas business segment southeast asia china
This is a professionally designed visual chart for Asahi Group Holdings Ltd Statistic 1 Overseas Business Segment Southeast Asia China. This is part of our Data and Statistics products selection, and you will need a Paid account to download the actual report with accurate data and sources. Downloaded report will contain the editable graph with accurate data, an excel table with the actual data, the exact source of the data and the release date. This slide shows the graph of Asahi Super Dry Brand Sales Volume for Overseas Business Segment Southeast Asia, China of Asahi Group Holdings, Ltd for the year 2014 to 18. Download it immediately and use it for your business.
-
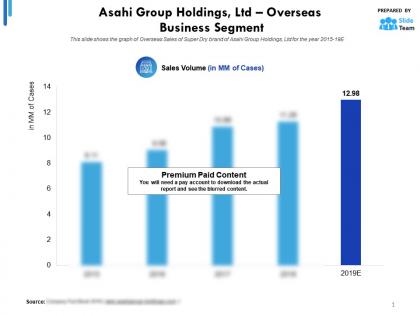 Asahi group holdings ltd statistic 1 overseas business segment
This is a professionally designed visual chart for Asahi Group Holdings Ltd Statistic 1 Overseas Business Segment. This is part of our Data and Statistics products selection, and you will need a Paid account to download the actual report with accurate data and sources. Downloaded report will contain the editable graph with accurate data, an excel table with the actual data, the exact source of the data and the release date. This slide shows the graph of Overseas Sales of Super Dry brand of Asahi Group Holdings, Ltd for the year 2015 to 19E. Download it immediately and use it for your business.
-
 Asahi group holdings ltd statistic 1 alcohol beverages business segment
This is a professionally designed visual chart for Asahi Group Holdings Ltd Statistic 1 Alcohol Beverages Business Segment. This is part of our Data and Statistics products selection, and you will need a Paid account to download the actual report with accurate data and sources. Downloaded report will contain the editable graph with accurate data, an excel table with the actual data, the exact source of the data and the release date. This slide provides a graph of revenue split of Alcohol Beverages Business Segment by container type bottle, can, keg of Asahi Group Holdings, Ltd for the years 2014 to 18. Download it immediately and use it for your business.
-
 Asahi group holdings ltd statistic 1 food business segment
This is a professionally designed visual chart for Asahi Group Holdings Ltd Statistic 1 Food Business Segment. This is part of our Data and Statistics products selection, and you will need a Paid account to download the actual report with accurate data and sources. Downloaded report will contain the editable graph with accurate data, an excel table with the actual data, the exact source of the data and the release date. This slide provides the graph of market share candy tablet market, baby food market, instant miso soup of Asahi Group Holdings, Ltd in Japanese market for the year 2018. Download it immediately and use it for your business.
-
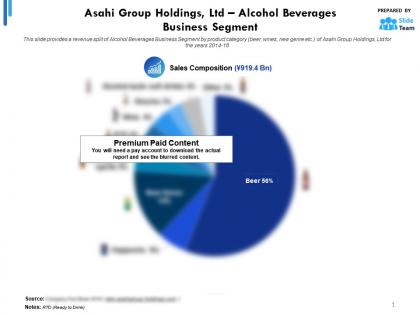 Asahi group holdings ltd statistic 2 alcohol beverages business segment
This is a professionally designed visual chart for Asahi Group Holdings Ltd Statistic 2 Alcohol Beverages Business Segment. This is part of our Data and Statistics products selection, and you will need a Paid account to download the actual report with accurate data and sources. Downloaded report will contain the editable graph with accurate data, an excel table with the actual data, the exact source of the data and the release date. This slide provides a revenue split of Alcohol Beverages Business Segment by product category beer, wines, new genre etc. of Asahi Group Holdings, Ltd for the years 2014 to 18. Download it immediately and use it for your business.
-
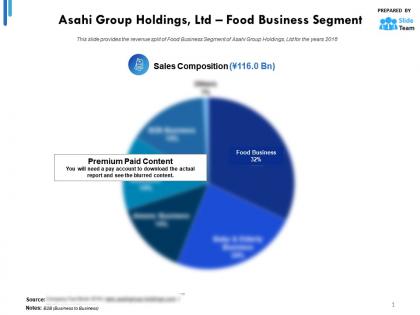 Asahi group holdings ltd statistic 2 food business segment
This is a professionally designed visual chart for Asahi Group Holdings Ltd Statistic 2 Food Business Segment. This is part of our Data and Statistics products selection, and you will need a Paid account to download the actual report with accurate data and sources. Downloaded report will contain the editable graph with accurate data, an excel table with the actual data, the exact source of the data and the release date. Asahi Group Holdings Ltd Statistic 3 Food Business Segment This slide provides the revenue split of Food Business Segment of Asahi Group Holdings, Ltd for the years 2018. Download it immediately and use it for your business.
-
 Asahi group holdings ltd statistic 3 alcohol beverages business segment
This is a professionally designed visual chart for Asahi Group Holdings Ltd Statistic 3 Alcohol Beverages Business Segment. This is part of our Data and Statistics products selection, and you will need a Paid account to download the actual report with accurate data and sources. Downloaded report will contain the editable graph with accurate data, an excel table with the actual data, the exact source of the data and the release date. This slide provides a graph of revenue in JPY Bn and core operating profit margin of Alcohol Beverages Business Segment of Asahi Group Holdings, Ltd for the years 2014 to 18. Download it immediately and use it for your business.
-
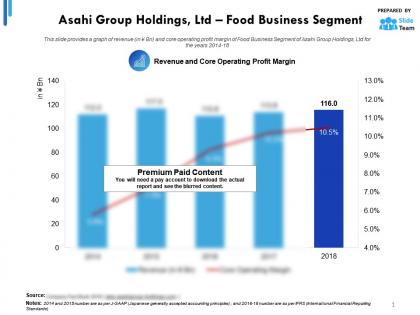 Asahi group holdings ltd statistic 3 food business segment
This is a professionally designed visual chart for Asahi Group Holdings Ltd Statistic 3 Food Business Segment. This is part of our Data and Statistics products selection, and you will need a Paid account to download the actual report with accurate data and sources. Downloaded report will contain the editable graph with accurate data, an excel table with the actual data, the exact source of the data and the release date. This slide provides a graph of revenue in JPY Bn and core operating profit margin of Food Business Segment of Asahi Group Holdings, Ltd for the years 2014 to 18. Download it immediately and use it for your business.
-
 Asahi group holdings ltd statistic 1 overseas business europe italy netherlands and uk
This is a professionally designed visual chart for Asahi Group Holdings Ltd Statistic 1 Overseas Business Europe Italy Netherlands And UK. This is part of our Data and Statistics products selection, and you will need a Paid account to download the actual report with accurate data and sources. Downloaded report will contain the editable graph with accurate data, an excel table with the actual data, the exact source of the data and the release date. This slide provides a graph of revenue in JPY MM and core operating profit margin of Overseas Business Europe-Italy, Netherlands and UK of Asahi Group Holdings, Ltd for the years 2014 to 18. Download it immediately and use it for your business.
-
 Asahi group holdings ltd statistic 1 overseas business europe poland czech slovakia romania hungary
This is a professionally designed visual chart for Asahi Group Holdings Ltd Statistic 1 Overseas Business Europe Poland Czech Slovakia Romania Hungary. This is part of our Data and Statistics products selection, and you will need a Paid account to download the actual report with accurate data and sources. Downloaded report will contain the editable graph with accurate data, an excel table with the actual data, the exact source of the data and the release date. This slide provides a graph of revenue in JPY MM and core operating profit margin of Overseas Business Europe-Poland, Czech, Slovakia, Romania, Hungary of Asahi Group Holdings, Ltd for the years 2014 to 18. Download it immediately and use it for your business.
-
 Asahi group holdings ltd statistic 1 soft drinks business segment
This is a professionally designed visual chart for Asahi Group Holdings Ltd Statistic 1 Soft Drinks Business Segment. This is part of our Data and Statistics products selection, and you will need a Paid account to download the actual report with accurate data and sources. Downloaded report will contain the editable graph with accurate data, an excel table with the actual data, the exact source of the data and the release date. This slide provides a sales volume of Soft Drinks Business Segment by marketing channel vending machines, Convenience stores, supermarkets etc. of Asahi Group Holdings, Ltd for the years 2014 to 18. Download it immediately and use it for your business.
-
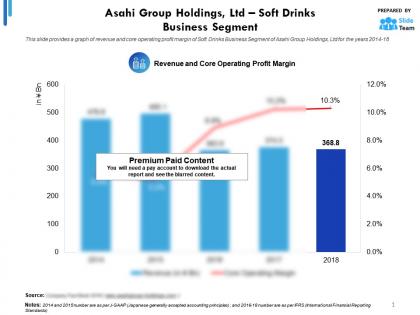 Asahi group holdings ltd statistic 2 soft drinks business segment
This is a professionally designed visual chart for Asahi Group Holdings Ltd Statistic 2 Soft Drinks Business Segment. This is part of our Data and Statistics products selection, and you will need a Paid account to download the actual report with accurate data and sources. Downloaded report will contain the editable graph with accurate data, an excel table with the actual data, the exact source of the data and the release date. This slide provides a graph of revenue and core operating profit margin of Soft Drinks Business Segment of Asahi Group Holdings, Ltd for the years 2014 to 18. Download it immediately and use it for your business.
-
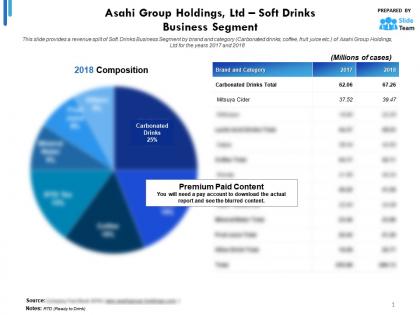 Asahi group holdings ltd statistic 3 soft drinks business segment
This is a professionally designed visual chart for Asahi Group Holdings Ltd Statistic 3 Soft Drinks Business Segment. This is part of our Data and Statistics products selection, and you will need a Paid account to download the actual report with accurate data and sources. Downloaded report will contain the editable graph with accurate data, an excel table with the actual data, the exact source of the data and the release date. This slide provides a revenue split of Soft Drinks Business Segment by brand and category Carbonated drinks, coffee, fruit juice etc. of Asahi Group Holdings, Ltd for the years 2017 to 2018. Download it immediately and use it for your business.
-
 Client Testimonials Statistical Analysis Of Research Findings One Pager Sample Example Document
This is a One Pager titled Client Testimonials Statistical Analysis Of Research Findings One Pager Sample Example Document featuring A4 size content and graphics. It is designed in PowerPoint by an expert and is 100 percent editable. You can also access it with Google Slides.
-
 Statistical Analysis Cost Structure One Pager Sample Example Document
This is a One Pager designed in Powerpoint titled Statistical Analysis Cost Structure One Pager Sample Example Document. It is crafted using high-quality visuals that can be readjusted in PowerPoint and Google Slides. This template comes in an editable format and is available in A4 size format for immediate download.
-
 Team Structure Of Statistical Analysis Of Research Findings Company One Pager Sample Example Document
This is a One Pager designed in Powerpoint titled Team Structure Of Statistical Analysis Of Research Findings Company One Pager Sample Example Document. It is crafted using high-quality visuals that can be readjusted in PowerPoint and Google Slides. This template comes in an editable format and is available in A4 size format for immediate download.
-
 Honda motor co ltd key statistics 2018
The information presented in this slide has been researched by our team of professional business analysts. This is part of our Company Profiles products selection, and you will need a Paid account to download the actual report with accurate data and sources. Downloaded report will be in Powerpoint and will contain the actual editable slides with the actual data and sources for each data. This slide shows the key statistics related to dividend per share, number of shareholders, associates, shares issued of Honda in 2018 in billions JPY. Download it immediately and use it for your business.
-
 Suntory beverage and food limited key statistics 2018
The information presented in this slide has been researched by our team of professional business analysts. This is part of our Company Profiles products selection, and you will need a Paid account to download the actual report with accurate data and sources. Downloaded report will be in Powerpoint and will contain the actual editable slides with the actual data and sources for each data. This slide provides the Key Statistics including Revenue Sales Segment Profit etc of the company Suntory Beverage and Food Limited as of Dec 2018. Download it immediately and use it for your business.
-
 Statistics Of Ai Tools Across Tasks Revolutionizing Marketing With Ai Trends And Opportunities AI SS V
This slide showcases statistic which indicate usage of multiple artificial intelligence AI tools across marketing ecosystem. It provides details about Jasper.ai, ChatGPT, Copy.ai, Frase.io, high quality content, social media content, etc. Deliver an outstanding presentation on the topic using this Statistics Of Ai Tools Across Tasks Revolutionizing Marketing With Ai Trends And Opportunities AI SS V. Dispense information and present a thorough explanation of Statistics, Marketing, Businesses using the slides given. This template can be altered and personalized to fit your needs. It is also available for immediate download. So grab it now.
-
 Statistics Associated With Global Wine Consumption Global Wine Industry Report IR SS
The purpose of the slide is to provide a comprehensive overview of quantitative data and trends related to the consumption of wine. It include global wine consumption statistics from 2000 to 2022 and consumption by country. Deliver an outstanding presentation on the topic using this Statistics Associated With Global Wine Consumption Global Wine Industry Report IR SS. Dispense information and present a thorough explanation of Statistics, Associated, Consumption using the slides given. This template can be altered and personalized to fit your needs. It is also available for immediate download. So grab it now.
-
 Educational statistics education powerpoint templates and powerpoint backgrounds 0311
Microsoft PowerPoint Template and Background with multi-color pie chart sitting on top of a closed large blue book
-
 Statistic graphic money powerpoint backgrounds and templates 1210
Microsoft PowerPoint Template and Background with statistic graphic with golden coins


