Powerpoint Templates and Google slides for Statistical Used Data Analysis
Save Your Time and attract your audience with our fully editable PPT Templates and Slides.
-
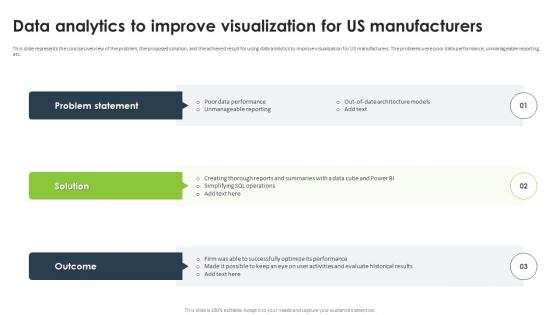
 Data Analytics To Improve Visualization For Us Manufacturers Statistical Analysis For Data Driven
This slide represents the concise overview of the problem, the proposed solution, and the achieved result for using data analytics to improve visualization for US manufacturers. The problems were poor data performance, unmanageable reporting, etc. Increase audience engagement and knowledge by dispensing information using Data Analytics To Improve Visualization For Us Manufacturers Statistical Analysis For Data Driven. This template helps you present information on three stages. You can also present information on Poor Data Performance, Unmanageable Reporting, Data Analytics, Visualization For US Manufacturers using this PPT design. This layout is completely editable so personaize it now to meet your audiences expectations.
-
 Statistical Analysis For Data Driven Benefits Of Using Statistical Analysis In Business
This slide discusses the advantages of statistical analysis for organizations. These benefits are cut operating costs, perform market analysis, boost workplace efficiency and improve decision making. It also outlines the examples of each advantage. Present the topic in a bit more detail with this Statistical Analysis For Data Driven Benefits Of Using Statistical Analysis In Business. Use it as a tool for discussion and navigation on Perform Market Analysis, Boost Workplace Efficiency, Improve Decision Making. This template is free to edit as deemed fit for your organization. Therefore download it now.
-
 Statistical Analysis For Data Driven Criteria Used To Select Statistical Analysis Software
This slide represents the features and cost of various statistical analysis software available in the market. The purpose of this slide is to provide insights about the criteria used to select suitable statistical tool for data analytics. Deliver an outstanding presentation on the topic using this Statistical Analysis For Data Driven Criteria Used To Select Statistical Analysis Software. Dispense information and present a thorough explanation of Open Source Integration, Automated Reporting, Statistical Functions, Statistical Analysis Software using the slides given. This template can be altered and personalized to fit your needs. It is also available for immediate download. So grab it now.
-
 Statistical Analysis For Data Driven Different Uses Of Statistical Analysis For Business
This slide outlines the different applications of statistical analysis in business. The uses of this analysis include research, modelling, pricing decisions, optimal product pricing, credit decisions, customer segmentation, and commodity forecasting. Introducing Statistical Analysis For Data Driven Different Uses Of Statistical Analysis For Business to increase your presentation threshold. Encompassed with six stages, this template is a great option to educate and entice your audience. Dispence information on Customer Segmentation, Commodity Forecasting, Pricing Decisions, Statistical Analysis For Business, using this template. Grab it now to reap its full benefits.
-
 Statistical Analysis For Data Driven Health Record Management Using Statistical Analysis
This slide represents the concise overview of the problem, the proposed solution, and the achieved result for using data analytics in health record management. The outcomes are plan quicker follow-ups, make more appointment bookings, etc. Deliver an outstanding presentation on the topic using this Statistical Analysis For Data Driven Health Record Management Using Statistical Analysis. Dispense information and present a thorough explanation of Health Record Management, Statistical Analysis, Data Analytics, Constrained Development Possibilities using the slides given. This template can be altered and personalized to fit your needs. It is also available for immediate download. So grab it now.
-
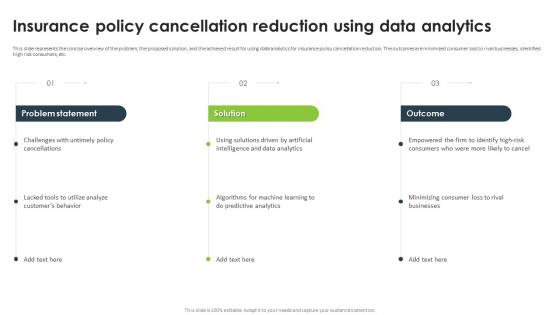
 Statistical Analysis For Data Driven Insurance Policy Cancellation Reduction Using Data Analytics
This slide represents the concise overview of the problem, the proposed solution, and the achieved result for using data analytics for insurance policy cancellation reduction. The outcomes are minimized consumer loss to rival businesses, identified high risk consumers, etc. Deliver an outstanding presentation on the topic using this Statistical Analysis For Data Driven Insurance Policy Cancellation Reduction Using Data Analytics. Dispense information and present a thorough explanation of Insurance Policy Cancellation, Reduction Using Data Analytics, Identified High Risk Consumers using the slides given. This template can be altered and personalized to fit your needs. It is also available for immediate download. So grab it now.
-
 Statistical Analysis For Data Driven Statistical And Data Analysis Techniques Used In Different Domains
This slide outlines the statistical and data analysis methods applied in different fields. These domains are spatial models, time series, survival analysis, market segmentation, recommendation systems, attribution modeling, clustering, etc. Present the topic in a bit more detail with this Statistical Analysis For Data Driven Statistical And Data Analysis Techniques Used In Different Domains. Use it as a tool for discussion and navigation on Recommendation Systems, Survival Analysis, Market Segmentation, Predictive Modeling. This template is free to edit as deemed fit for your organization. Therefore download it now.
-
 Powerpoint business statistical analysis of parallel data using arrows templates
We are proud to present our powerpoint business statistical analysis of parallel data using arrows templates. Visually support your Microsoft office PPT Presentation with our above template illustrating four steps to define and execute the plans. This diagram can be used to describe the business step-by-step workflows of components in a system. Deliver amazing presentations to mesmerize your audience.
-
 Research Analysis Of Market Data Using Statistical Tools
Introducing our premium set of slides with Research Analysis Of Market Data Using Statistical Tools. Elucidate the three stages and present information using this PPT slide. This is a completely adaptable PowerPoint template design that can be used to interpret topics like Research Analysis Of Market Data Using Statistical Tools. So download instantly and tailor it with your information.
-
 Statistical Used Data Analysis Ppt Powerpoint Presentation Professional Objects Cpb
Presenting Statistical Used Data Analysis Ppt Powerpoint Presentation Professional Objects Cpb slide which is completely adaptable. The graphics in this PowerPoint slide showcase four stages that will help you succinctly convey the information. In addition, you can alternate the color, font size, font type, and shapes of this PPT layout according to your content. This PPT presentation can be accessed with Google Slides and is available in both standard screen and widescreen aspect ratios. It is also a useful set to elucidate topics like Statistical Used Data Analysis. This well structured design can be downloaded in different formats like PDF, JPG, and PNG. So, without any delay, click on the download button now.
-
 Data analysis using statistics ppt powerpoint presentation summary icon cpb
Presenting Data Analysis Using Statistics Ppt Powerpoint Presentation Summary Icon Cpb slide which is completely adaptable. The graphics in this PowerPoint slide showcase four stages that will help you succinctly convey the information. In addition, you can alternate the color, font size, font type, and shapes of this PPT layout according to your content. This PPT presentation can be accessed with Google Slides and is available in both standard screen and widescreen aspect ratios. It is also a useful set to elucidate topics like Data Analysis Using Statistics. This well-structured design can be downloaded in different formats like PDF, JPG, and PNG. So, without any delay, click on the download button now.


