Powerpoint Templates and Google slides for Statistical Data
Save Your Time and attract your audience with our fully editable PPT Templates and Slides.
-
 Statistical Analysis For Data Driven Critical Steps Involved In Statistical Analysis
This slide represents the working process of statistical data analysis. The steps involved in performing statistical analysis are data collection, data cleaning, descriptive analysis, inferential analysis, interpretation, etc. Increase audience engagement and knowledge by dispensing information using Statistical Analysis For Data Driven Critical Steps Involved In Statistical Analysis. This template helps you present information on six stages. You can also present information on Descriptive Analysis, Inferential Analysis, Data Collection, Data Cleaning, Statistical Analysis using this PPT design. This layout is completely editable so personaize it now to meet your audiences expectations.
-
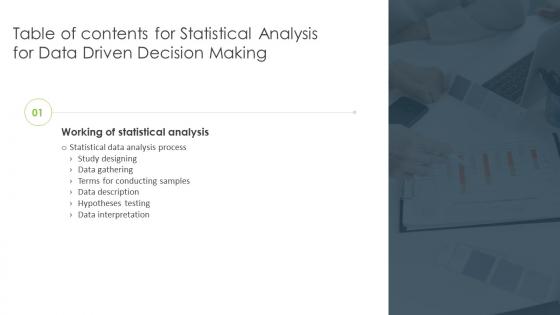 Statistical Analysis For Data Driven Decision Making For Table Of Contents
Introducing Statistical Analysis For Data Driven Decision Making For Table Of Contents to increase your presentation threshold. Encompassed with one stages, this template is a great option to educate and entice your audience. Dispence information on Study Designing, Data Gathering, Terms For Conducting Samples, Data Description, using this template. Grab it now to reap its full benefits.
-
 Statistical Analysis For Data Driven Descriptive And Inferential Methods Of Statistical Analysis
This slide represents the different techniques of descriptive and inferential statistical analysis. These are univariate, bivariate, multivariate, central limit theorem, binomial theorem, hypothesis testing, normal distribution, applied to means, etc. Increase audience engagement and knowledge by dispensing information using Statistical Analysis For Data Driven Descriptive And Inferential Methods Of Statistical Analysis. This template helps you present information on two stages. You can also present information on Statistical Analysis, Hypothesis Testing, Normal Distribution, Univariate, Bivariate using this PPT design. This layout is completely editable so personaize it now to meet your audiences expectations.
-
 Statistical Analysis For Data Driven Different Uses Of Statistical Analysis For Business
This slide outlines the different applications of statistical analysis in business. The uses of this analysis include research, modelling, pricing decisions, optimal product pricing, credit decisions, customer segmentation, and commodity forecasting. Introducing Statistical Analysis For Data Driven Different Uses Of Statistical Analysis For Business to increase your presentation threshold. Encompassed with six stages, this template is a great option to educate and entice your audience. Dispence information on Customer Segmentation, Commodity Forecasting, Pricing Decisions, Statistical Analysis For Business, using this template. Grab it now to reap its full benefits.
-
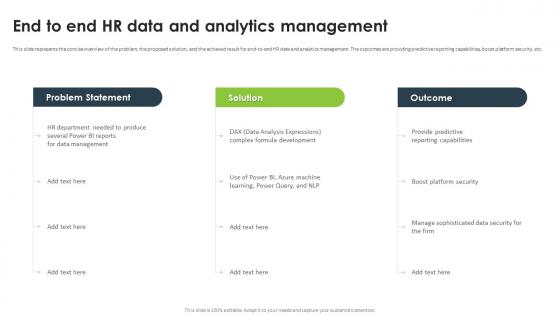 Statistical Analysis For Data Driven End To End Hr Data And Analytics Management
This slide represents the concise overview of the problem, the proposed solution, and the achieved result for end-to-end HR data and analytics management. The outcomes are providing predictive reporting capabilities, boost platform security, etc. Deliver an outstanding presentation on the topic using this Statistical Analysis For Data Driven End To End HR Data And Analytics Management. Dispense information and present a thorough explanation of Predictive Reporting Capabilities, Data Analysis Expressions, Boost Platform Security using the slides given. This template can be altered and personalized to fit your needs. It is also available for immediate download. So grab it now.
-
 Statistical Analysis For Data Driven Health Record Management Using Statistical Analysis
This slide represents the concise overview of the problem, the proposed solution, and the achieved result for using data analytics in health record management. The outcomes are plan quicker follow-ups, make more appointment bookings, etc. Deliver an outstanding presentation on the topic using this Statistical Analysis For Data Driven Health Record Management Using Statistical Analysis. Dispense information and present a thorough explanation of Health Record Management, Statistical Analysis, Data Analytics, Constrained Development Possibilities using the slides given. This template can be altered and personalized to fit your needs. It is also available for immediate download. So grab it now.
-
 Statistical Analysis For Data Driven Identifying Need For Statistical Analysis Plan
This slide demonstrates the importance of Statistical Analysis Plan SAP. The components of this slide are sufficiency of protocol description, complexity demands, initial application evaluation and detailed analysis instructions. Increase audience engagement and knowledge by dispensing information using Statistical Analysis For Data Driven Identifying Need For Statistical Analysis Plan. This template helps you present information on four stages. You can also present information on Sufficiency Of Protocol Description, Initial Application Evaluation, Detailed Analysis Instructions using this PPT design. This layout is completely editable so personaize it now to meet your audiences expectations.
-
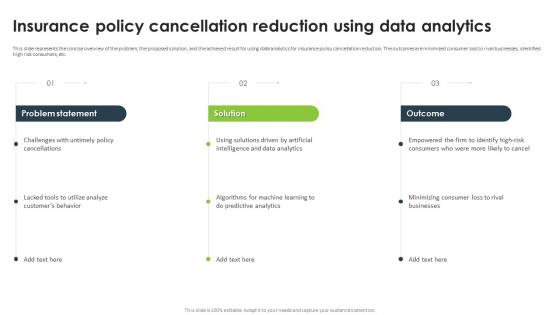 Statistical Analysis For Data Driven Insurance Policy Cancellation Reduction Using Data Analytics
This slide represents the concise overview of the problem, the proposed solution, and the achieved result for using data analytics for insurance policy cancellation reduction. The outcomes are minimized consumer loss to rival businesses, identified high risk consumers, etc. Deliver an outstanding presentation on the topic using this Statistical Analysis For Data Driven Insurance Policy Cancellation Reduction Using Data Analytics. Dispense information and present a thorough explanation of Insurance Policy Cancellation, Reduction Using Data Analytics, Identified High Risk Consumers using the slides given. This template can be altered and personalized to fit your needs. It is also available for immediate download. So grab it now.
-
 Statistical Analysis For Data Driven Key Components Of Statistical Analysis Plan
This slide outlines the various sections of Statistical Analysis Plan SAP. The components include document information, sample size calculation, analysis goals and objectives, outcome measures, data analysis procedures, statistical significance, etc. Present the topic in a bit more detail with this Statistical Analysis For Data Driven Key Components Of Statistical Analysis Plan. Use it as a tool for discussion and navigation on Analysis Goals And Objectives, Statistical Significance, Protocol Variations And Compliance, Presentation Of Results. This template is free to edit as deemed fit for your organization. Therefore download it now.
-
 Statistical Analysis For Data Driven Key Statistical Terms For Conducting Samples
The purpose of this slide is to outline the statistical measures involved in sampling data for analytical processes. These terms are population standard deviation, statistical power, expected effect size, significance level, etc. Deliver an outstanding presentation on the topic using this Statistical Analysis For Data Driven Key Statistical Terms For Conducting Samples. Dispense information and present a thorough explanation of Population Standard Deviation, Predetermined Threshold, Probability Of Rejecting A Null Hypothesis using the slides given. This template can be altered and personalized to fit your needs. It is also available for immediate download. So grab it now.
-
 Statistical Analysis For Data Driven Methods To Perform Statistical Analysis Of Data
This slide demonstrates the different methods employed to perform statistical analysis of business data, which helps in deriving various patterns. These include mean, regression, standard deviation, hypothesis testing, and sample size distribution. Introducing Statistical Analysis For Data Driven Methods To Perform Statistical Analysis Of Data to increase your presentation threshold. Encompassed with five stages, this template is a great option to educate and entice your audience. Dispence information on Hypothesis Testing, Sample Size Determination, Statistical Analysis Of Data, Standard Deviation, using this template. Grab it now to reap its full benefits.
-
 Statistical Analysis For Data Driven Overview Of Different Types Of Statistical Analysis
This slide outlines the various types of statistical analysis. These are mechanistic analysis, descriptive statistical analysis, inferential statistical analysis, predictive statistical analysis, prescriptive statistical analysis, exploratory data analysis, etc. Increase audience engagement and knowledge by dispensing information using Statistical Analysis For Data Driven Overview Of Different Types Of Statistical Analysis. This template helps you present information on nine stages. You can also present information on Inferential Statistical Analysis, Descriptive Statistical Analysis, Prescriptive Statistical Analysis, Regression Analysis using this PPT design. This layout is completely editable so personaize it now to meet your audiences expectations.
-
 Statistical Analysis For Data Driven Ppdac Cycle Of Statistical Analysis Process
This slide showcases the PPDAC Problem Plan Data Analysis Conclusion model of statistical data analysis. The purpose of this slide is to briefly explain the five stages of statistical analysis lifecycle, which are problem, plan, data, analysis, and conclusion. Introducing Statistical Analysis For Data Driven Ppdac Cycle Of Statistical Analysis Process to increase your presentation threshold. Encompassed with five stages, this template is a great option to educate and entice your audience. Dispence information on Result Interpretation, Communication, Data Collection, Data Management, using this template. Grab it now to reap its full benefits.
-
 Statistical Analysis For Data Driven Roadmap For Step By Step Statistical Data Analysis Process
This slide shows the timeline for performing statistical data analysis. The key steps include writing hypothesis and plan research design, collect data from a sample, summarize data with descriptive statistics, test hypotheses, result interpretation, etc. Increase audience engagement and knowledge by dispensing information using Statistical Analysis For Data Driven Roadmap For Step By Step Statistical Data Analysis Process. This template helps you present information on four stages. You can also present information on Statistical Data Analysis Process, Test Hypotheses, Result Interpretation, Plan Research Design using this PPT design. This layout is completely editable so personaize it now to meet your audiences expectations.
-
 Statistical Analysis For Data Driven Statistical Analysis Challenges And Possible Solutions
The purpose of this slide is to discuss the limitations of statistical analysis and their possible solutions. The challenges of statistical analytics are data integration and quality, skill gap, scalability, data security and budget constraints. Deliver an outstanding presentation on the topic using this Statistical Analysis For Data Driven Statistical Analysis Challenges And Possible Solutions. Dispense information and present a thorough explanation of Data Integration And Quality, Statistical Analysis Challenges, Data Security, Budget Constraints using the slides given. This template can be altered and personalized to fit your needs. It is also available for immediate download. So grab it now.
-
 Statistical Analysis For Data Driven Statistical Analysis Impact On Business Performance
This slide illustrates the business impact of performing statistical analysis. The parameters described in this slide are data-driven decision-making, operational efficiency, customer insights, quality control, revenue optimization, risk management, etc. Present the topic in a bit more detail with this Statistical Analysis For Data Driven Statistical Analysis Impact On Business Performance. Use it as a tool for discussion and navigation on Data Driven Decision Making, Revenue Optimization, Operational Efficiency, Business Performance. This template is free to edit as deemed fit for your organization. Therefore download it now.
-
 Statistical Analysis For Data Driven Statistical Analysis Plan Overview And Components
This slide discusses the overview of Statistical Analysis Plan SAP. The purpose of this slide is to highlight the components of Statistical Analysis Plan, such as endpoints, both primary and secondary, methods of analysis, comparisons, significance levels, etc. Deliver an outstanding presentation on the topic using this Statistical Analysis For Data Driven Statistical Analysis Plan Overview And Components. Dispense information and present a thorough explanation of Comparisons And Significance Levels, Exploratory Data Analyses, Statistical Analysis Plan using the slides given. This template can be altered and personalized to fit your needs. It is also available for immediate download. So grab it now.
-
 Statistical Analysis For Data Driven Statistical Analysis Software Features And Benefits
The purpose of this slide is to outline the different software used to perform statistical analysis. This slide represents the primary features and benefits of various statistical software available in the market. Present the topic in a bit more detail with this Statistical Analysis For Data Driven Statistical Analysis Software Features And Benefits. Use it as a tool for discussion and navigation on Statistical Analysis Software, Future Proof Data Analysis, Support For Regression Analysis, Time Series Analysis. This template is free to edit as deemed fit for your organization. Therefore download it now.
-
 Statistical Analysis For Data Driven Statistical Analysis Training Program For Beginners
This slide represents the training program for performing statistical data analysis. The purpose of this slide is to outline the mode, cost, agenda, and schedule for the training programs. Deliver an outstanding presentation on the topic using this Statistical Analysis For Data Driven Statistical Analysis Training Program For Beginners. Dispense information and present a thorough explanation of Statistical Analysis Training, Program For Beginners, Training Programs, Performing Statistical Data Analysis using the slides given. This template can be altered and personalized to fit your needs. It is also available for immediate download. So grab it now.
-
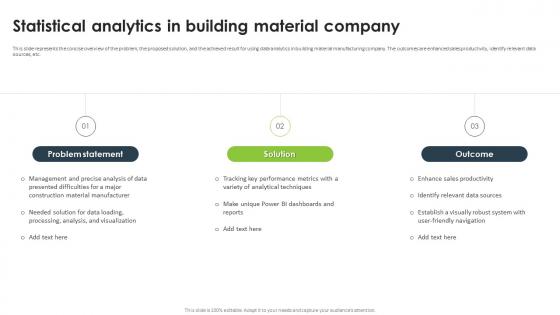 Statistical Analysis For Data Driven Statistical Analytics In Building Material Company
This slide represents the concise overview of the problem, the proposed solution, and the achieved result for using data analytics in building material manufacturing company. The outcomes are enhanced sales productivity, identify relevant data sources, etc. Introducing Statistical Analysis For Data Driven Statistical Analytics In Building Material Company to increase your presentation threshold. Encompassed with three stages, this template is a great option to educate and entice your audience. Dispence information on Statistical Analytics, Building Material Company, Identify Relevant Data Sources, Enhanced Sales Productivity, using this template. Grab it now to reap its full benefits.
-
 Statistical Analysis For Data Driven Statistical Analytics In Food Processing Outlet
This slide represents the concise overview of the problem, the proposed solution, and the achieved result for using data analytics in food processing outlet. The outcomes are precise food quantity forecasts, optimized resource allocation, etc. Increase audience engagement and knowledge by dispensing information using Statistical Analysis For Data Driven Statistical Analytics In Food Processing Outlet. This template helps you present information on three stages. You can also present information on Statistical Analytics, Food Processing Outlet, Optimized Resource Allocation, Data Analytics using this PPT design. This layout is completely editable so personaize it now to meet your audiences expectations.
-
 Statistical Analysis For Data Driven Statistical And Data Analysis Techniques Used In Different Domains
This slide outlines the statistical and data analysis methods applied in different fields. These domains are spatial models, time series, survival analysis, market segmentation, recommendation systems, attribution modeling, clustering, etc. Present the topic in a bit more detail with this Statistical Analysis For Data Driven Statistical And Data Analysis Techniques Used In Different Domains. Use it as a tool for discussion and navigation on Recommendation Systems, Survival Analysis, Market Segmentation, Predictive Modeling. This template is free to edit as deemed fit for your organization. Therefore download it now.
-
 Statistical Analysis For Data Driven Statistical Data Analysis Process Hypotheses Testing
The purpose of this slide is to demonstrate the hypothesis testing phase of statistical data analysis. The different steps involved in this phase are hypothesis formulation, analysis plan, collect and analyse sample data and result evaluation. Introducing Statistical Analysis For Data Driven Statistical Data Analysis Process Hypotheses Testing to increase your presentation threshold. Encompassed with four stages, this template is a great option to educate and entice your audience. Dispence information on Hypothesis Formulation, Analysis Plan, Hypotheses Testing, Statistical Data Analysis Process, using this template. Grab it now to reap its full benefits.
-
 Statistical Analysis For Data Driven Tasks Performed By Statistical Data Analysis
This slide demonstrates the major activities involved in statistical analysis. These are offers insight into complex data, informs the decision-making process, assesses hypotheses, evaluates the efficacy of interventions and supports predictive modeling. Increase audience engagement and knowledge by dispensing information using Statistical Analysis For Data Driven Tasks Performed By Statistical Data Analysis. This template helps you present information on five stages. You can also present information on Tasks Performed, Statistical Data Analysis, Supports Predictive Modeling, Assesses Hypotheses using this PPT design. This layout is completely editable so personaize it now to meet your audiences expectations.
-
 Statistical Analysis For Data Driven Timeline To Conduct Statistical Data Analysis
This slide shows the timeline for performing statistical data analysis. The key steps include writing hypothesis and plan research design, collect data from a sample, summarize data with descriptive statistics, test hypotheses, result interpretation, etc. Introducing Statistical Analysis For Data Driven Timeline To Conduct Statistical Data Analysis to increase your presentation threshold. Encompassed with five stages, this template is a great option to educate and entice your audience. Dispence information on Statistical Data Analysis, Test Hypotheses, Result Interpretation, Plan Research Design, using this template. Grab it now to reap its full benefits.
-
 Statistical Analysis For Data Driven Understanding The Concept Of Statistical Data Analysis
The purpose of this slide is to discuss the statistical data analysis. This slide highlights the key tasks performed by the statistical analysis of data for several benefits. These tasks are quantification, variability and confidence level associated with these variations. Increase audience engagement and knowledge by dispensing information using Statistical Analysis For Data Driven Understanding The Concept Of Statistical Data Analysis. This template helps you present information on two stages. You can also present information on Statistical Data Analysis, Variability And Confidence Level, Associated With These Variations using this PPT design. This layout is completely editable so personaize it now to meet your audiences expectations.
-
 Statistical Data Analysis Process Data Description Statistical Analysis For Data Driven
This slide discusses the data description phase of statistical analysis, which includes methods such as scatter plot, bar chart, frequency distribution, etc. This slide also outlines the different types of skewed distribution techniques. Deliver an outstanding presentation on the topic using this Statistical Data Analysis Process Data Description Statistical Analysis For Data Driven. Dispense information and present a thorough explanation of Statistical Data Analysis Process, Data Description, Skewed Distribution Techniques, Bar Chart using the slides given. This template can be altered and personalized to fit your needs. It is also available for immediate download. So grab it now.
-
 Statistical Data Analysis Process Data Gathering Statistical Analysis For Data Driven
This slide discusses the data-gathering phase of the statistical data analysis process. The purpose of this slide is to outline reliable and non-reliable sampling methods, such as simple random, stratified random, cluster random, voluntary response, etc. Present the topic in a bit more detail with this Statistical Data Analysis Process Data Gathering Statistical Analysis For Data Driven. Use it as a tool for discussion and navigation on Statistical Data Analysis Process, Data Gathering, Stratified Random, Cluster Random, Voluntary Response. This template is free to edit as deemed fit for your organization. Therefore download it now.
-
 Statistical Data Analysis Process Data Interpretation Statistical Analysis For Data Driven
This slide represents the data interpretation phase of statistical analysis. The steps involved are compare P-value to significance level, assess probability, answer original questions, defend against objections, acknowledge limitations, iterate, etc. Deliver an outstanding presentation on the topic using this Statistical Data Analysis Process Data Interpretation Statistical Analysis For Data Driven. Dispense information and present a thorough explanation of Statistical Data Analysis Process, Data Interpretation, Acknowledge Limitations, Determine Statistical Significance using the slides given. This template can be altered and personalized to fit your needs. It is also available for immediate download. So grab it now.
-
 Statistical Data Analysis Process Study Designing Statistical Analysis For Data Driven
This slide discusses the study designing phase of statistical data analysis. The purpose of this slide is to outline the statistical tests used in different research designs, such as descriptive design, correlational design, and experimental design. Present the topic in a bit more detail with this Statistical Data Analysis Process Study Designing Statistical Analysis For Data Driven. Use it as a tool for discussion and navigation on Statistical Data Analysis Process, Study Designing, Correlational Design, Experimental Design. This template is free to edit as deemed fit for your organization. Therefore download it now.
-
 Table Of Contents For Statistical Analysis For Data Driven Decision Making
Introducing Table Of Contents For Statistical Analysis For Data Driven Decision Making to increase your presentation threshold. Encompassed with thirteen stages, this template is a great option to educate and entice your audience. Dispence information on Working Of Statistical Analysis, Monitoring Dashboards, Statistical Analysis Plan, Training And Budget, using this template. Grab it now to reap its full benefits.
-
 Key Statistics Related To Ineffective Data Breach Management
This slide depicts the key statistics associated with ineffective data breach management. The purpose of this slide is to help the business ensure it implements suitable practices in order to improve its data protection and security. Presenting our set of slides with Key Statistics Related To Ineffective Data Breach Management. This exhibits information on five stages of the process. This is an easy to edit and innovatively designed PowerPoint template. So download immediately and highlight information on Company Networks And Data, Data Security Breach Occur, Data Breach And Cyberattacks.
-
 Key Statistics Related Of Data Centre Colocations
This slide covers seven pivotal statistics related to data center colocations. The purpose of this template is to inform stakeholders about key trends and figures shaping the data center colocation industry. It includes projected global market value, the rapid growth in the Asia Pacific region, and the driving forces behind the colocation market. Introducing our premium set of slides with Key Statistics Related Of Data Centre Colocations Ellicudate the Seven stages and present information using this PPT slide. This is a completely adaptable PowerPoint template design that can be used to interpret topics like IT Infrastructure Costs, Global Data Center So download instantly and tailor it with your information.
-
 Database Marketing Statistics For 2023 Essential Guide To Database Marketing MKT SS V
The purpose of this slide is to outline latest statistics associated with database marketing. Information covered in this slide is related to data sharing, switching to competitors, data management platforms, personalized content, etc. Introducing Database Marketing Statistics For 2023 Essential Guide To Database Marketing MKT SS V to increase your presentation threshold. Encompassed with five stages, this template is a great option to educate and entice your audience. Dispence information on Discount Customized Offers, Personalized Content, Non Personalized Email using this template. Grab it now to reap its full benefits.
-
 Statistic Report Google Data Analytics Icon
Introducing our premium set of slides with Statistic Report Google Data Analytics Icon Ellicudate the three stages and present information using this PPT slide. This is a completely adaptable PowerPoint template design that can be used to interpret topics like Statistic Report, Google Data Analytics Icon So download instantly and tailor it with your information.
-
 Statistics Highlighting Demand For Data Driven Decision Measuring Marketing Success MKT SS V
The following slide showcases some marketing analytics facts and figures to encourage business decisions based on big data. It includes elements such as higher return on investments, promotional expenses, competitive outputs, budget investments etc. Introducing Statistics Highlighting Demand For Data Driven Decision Measuring Marketing Success MKT SS V to increase your presentation threshold. Encompassed with six stages, this template is a great option to educate and entice your audience. Dispence information on Promotional Expenses, Marketing Analytics, Data Analytics using this template. Grab it now to reap its full benefits.
-
 Y197 Statistical Data Supporting Need Of Converting Text To Video Synthesia AI Overview Of Video AI SS
This slide represents the statistical data highlighting the benefits of using video content over texts. It includes details related to need of converting text to video such as video is memorable, grabs attention and drives action. Introducing Y197 Statistical Data Supporting Need Of Converting Text To Video Synthesia AI Overview Of Video AI SS to increase your presentation threshold. Encompassed with three stages, this template is a great option to educate and entice your audience. Dispence information on Video Is Memorable, Video Grabs Attention, Video Drives Action, using this template. Grab it now to reap its full benefits.
-
 Implementing Big Data Analytics Statistics Associated With Supply Chain Analytics Markets CRP DK SS
This slide showcases various stats related to supply chain analytics solutions which includes stock inventory, logistic operations, optimal supply chains etc. Increase audience engagement and knowledge by dispensing information using Implementing Big Data Analytics Statistics Associated With Supply Chain Analytics Markets CRP DK SS. This template helps you present information on four stages. You can also present information on Supply Chain Analytics, Stock Inventory, Logistic Operations, Optimal Supply Chains using this PPT design. This layout is completely editable so personaize it now to meet your audiences expectations.
-
 Database Marketing Statistics For Database Marketing Practices To Increase MKT SS V
The purpose of this slide is to outline latest statistics associated with database marketing. Information covered in this slide is related to data sharing, switching to competitors, data management platforms, personalized content, etc. Deliver an outstanding presentation on the topic using this Database Marketing Statistics For Database Marketing Practices To Increase MKT SS V. Dispense information and present a thorough explanation of Discount, Personalized, Management using the slides given. This template can be altered and personalized to fit your needs. It is also available for immediate download. So grab it now.
-
 Key Statistics Associated With IoT Big Data Analytics Comprehensive Guide For Big Data IoT SS
Following slide depicts statistics for IoT big data analytics across various sectors to understand its potential across to improve efficiency. It covers elements such as market size, CAGR, manufacturing sector, revenue, etc. Introducing Key Statistics Associated With IoT Big Data Analytics Comprehensive Guide For Big Data IoT SS to increase your presentation threshold. Encompassed with five stages, this template is a great option to educate and entice your audience. Dispence information on Estimated Generate, Manufacturing Projected, Organizations Real Teal, using this template. Grab it now to reap its full benefits.
-
 Key Statistics Associated With IoT Use In Telecom IoT In Telecommunications Data IoT SS
Following slide depicts statistics to understand market size and growth for IoT telecom services. It includes elements such as market size, growth rate, devices demand growth, projected annual revenue, etc. Introducing Key Statistics Associated With IoT Use In Telecom IoT In Telecommunications Data IoT SS to increase your presentation threshold. Encompassed with four stages, this template is a great option to educate and entice your audience. Dispence information on Projected Generate, Remote Services Network, Mobile Network Operators, using this template. Grab it now to reap its full benefits.
-
 Key Statistics Associated With Big Data Analytics Big Data Analytics Applications Data Analytics SS
This slide showcases various stats related to big data analytics which helps in identifying market growth prospects for future investments. It includes elements such as business profit, data generated, market share, investment etc. Increase audience engagement and knowledge by dispensing information using Key Statistics Associated With Big Data Analytics Big Data Analytics Applications Data Analytics SS. This template helps you present information on six stages. You can also present information on Data Analytics, Profit To Business, Companies Since using this PPT design. This layout is completely editable so personaize it now to meet your audiences expectations.
-
 Database Marketing Statistics For 2024 Using Customer Data To Improve MKT SS V
The purpose of this slide is to outline latest statistics associated with database marketing. Information covered in this slide is related to data sharing, switching to competitors, data management platforms, personalized content, etc. Increase audience engagement and knowledge by dispensing information using Database Marketing Statistics For 2024 Using Customer Data To Improve MKT SS V. This template helps you present information on six stages. You can also present information on Customized, Management, Campaigns using this PPT design. This layout is completely editable so personaize it now to meet your audiences expectations.
-
 Statistics Related To Oracle Database Crypto Secure Exploring Diverse Blockchain BCT SS
This slide covers facts regarding Oracle Database Crypto-Secure Data Management, such as reducing data breaches, enhancing query performance, and offering fine-grained access control. Introducing Statistics Related To Oracle Database Crypto Secure Exploring Diverse Blockchain BCT SS to increase your presentation threshold. Encompassed with three stages, this template is a great option to educate and entice your audience. Dispence information on Sensitive Data, Query Performance, Encryption Methods using this template. Grab it now to reap its full benefits.
-
 Key Statistics For Web Data Mining
This slide covers key statistics related to web mining. The purpose of this template is to provide the audience with insightful data regarding the growth and applications of web mining. It includes statistics such as market projections, industry focus areas, adoption by Fortune 500 companies, and expected growth rates in various web mining applications. Introducing our premium set of slides with Key Statistics For Web Data Mining. Ellicudate the seven stages and present information using this PPT slide. This is a completely adaptable PowerPoint template design that can be used to interpret topics like Key Statistics, Personalization, Companies. So download instantly and tailor it with your information.
-
 Database Marketing Statistics For 2023 Database Marketing Techniques MKT SS V
The purpose of this slide is to outline latest statistics associated with database marketing. Information covered in this slide is related to data sharing, switching to competitors, data management platforms, personalized content, etc. Increase audience engagement and knowledge by dispensing information using Database Marketing Statistics For 2023 Database Marketing Techniques MKT SS V. This template helps you present information on six stages. You can also present information on Consumers, Customer Data, Non-Personalized Email using this PPT design. This layout is completely editable so personaize it now to meet your audiences expectations.
-
 Statistical Data To Analyze Need Of Enhancing B2B Demand B2B Lead Generation Techniques
This slide covers need of optimizing demand generation strategies by analyzing statistical data. It involves optimizing right techniques, aligning content with customer journey. Increase audience engagement and knowledge by dispensing information using Statistical Data To Analyze Need Of Enhancing B2B Demand B2B Lead Generation Techniques. This template helps you present information on Four stages. You can also present information on IB2b Marketers Optimize, Demand Generation Techniques, B2B Revenue Leader using this PPT design. This layout is completely editable so personaize it now to meet your audiences expectations.
-
 Key Statistics Associated With Healthcare Data Definitive Guide To Implement Data Analytics SS
This slide showcases various stats related to healthcare data analytics which helps in making informed investment decisions. It includes elements such as clinical decision support system, operational costs, decision making, big data analytics, patient health etc. Introducing Key Statistics Associated With Healthcare Data Definitive Guide To Implement Data Analytics SS to increase your presentation threshold. Encompassed with Five stages, this template is a great option to educate and entice your audience. Dispence information on Data Analytics, Healthcare Organizations, Clinical Decision, using this template. Grab it now to reap its full benefits.
-
 Introduction To Data Integration With Key Statistics Marketing Technology Stack Analysis
Following slide provides information about the concept of data integration in marketing. It includes key elements such as description, key statistics, advantages, and limitations. Deliver an outstanding presentation on the topic using this Introduction To Data Integration With Key Statistics Marketing Technology Stack Analysis Dispense information and present a thorough explanation of Organization Data, Efficiency, Increased Productivity using the slides given. This template can be altered and personalized to fit your needs. It is also available for immediate download. So grab it now.
-
 Log Statistical Data Analytic Icon
Introducing our Log Statistical Data Analytic Icon set of slides.The topics discussed in these slides are Log Statistical Data, Analytic Icon.This is an immediately available PowerPoint presentation that can be conveniently customized.Download it and convince your audience.
-
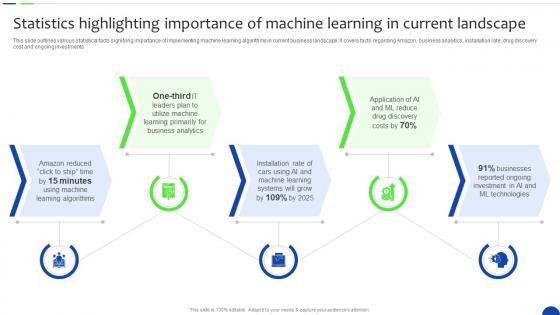 Statistics Highlighting Importance Of Machine Unlocking The Power Of Prescriptive Data Analytics SS
This slide outlines various statistical facts signifying importance of implementing machine learning algorithms in current business landscape. It covers facts regarding Amazon, business analytics, installation rate, drug discovery cost and ongoing investments. Introducing Statistics Highlighting Importance Of Machine Unlocking The Power Of Prescriptive Data Analytics SS to increase your presentation threshold. Encompassed with five stages, this template is a great option to educate and entice your audience. Dispence information on Machine Learning, ML Technologies, Machine Learning Algorithms, using this template. Grab it now to reap its full benefits.
-
 Statistics Highlighting Importance Enhancing Business Insights Implementing Product Data Analytics SS V
This slide outlines statistical figures citing reasons for businesses to adopt retention analysis. It covers reasons pertaining to CLV to CAC ratio, boost in profits, new customer acquisition and customer data analytics. Increase audience engagement and knowledge by dispensing information using Statistics Highlighting Importance Enhancing Business Insights Implementing Product Data Analytics SS V. This template helps you present information on four stages. You can also present information on Retention Rate, Boost, Profits using this PPT design. This layout is completely editable so personaize it now to meet your audiences expectations.
-
 Statistics Highlighting Need For Enhancing Business Insights Implementing Product Data Analytics SS V
This slide outlines statistical figures citing reasons for businesses to adopt customer journey mapping. It covers reasons pertaining to providers, customer journey, processes, sales leads, etc. Introducing Statistics Highlighting Need For Enhancing Business Insights Implementing Product Data Analytics SS V to increase your presentation threshold. Encompassed with five stages, this template is a great option to educate and entice your audience. Dispence information on Statistics Highlighting Need, Customer Journey Mapping, using this template. Grab it now to reap its full benefits.
-
 Statistics Highlighting Enhancing Business Insights Implementing Product Data Analytics SS V
This slide provides statistical figures highlighting importance of leveraging product analytics in businesses to make data driven decisions. It covers statistics related to recommendations, personalisation, retention, generation of new customers and profits. Increase audience engagement and knowledge by dispensing information using Statistics Highlighting Enhancing Business Insights Implementing Product Data Analytics SS V. This template helps you present information on five stages. You can also present information on Statistics Highlighting, Importance Of Adopting, Product Analytics using this PPT design. This layout is completely editable so personaize it now to meet your audiences expectations.
-
 Benefit Data Analysis Icon Showcasing Statistics
Introducing our premium set of slides with Benefit Data Analysis Icon Showcasing Statistics Ellicudate the three stages and present information using this PPT slide. This is a completely adaptable PowerPoint template design that can be used to interpret topics like Benefit Data Analysis, Showcasing Statistics So download instantly and tailor it with your information.
-
 Applications Of Statistical Analysis For Mastering Data Analytics A Comprehensive Data Analytics SS
This slide outlines real life applications of statistical analysis in various industries aimed compiling and reporting research findings. It covers use cases of finance, marketing, information technology, business management, etc. Introducing Applications Of Statistical Analysis For Mastering Data Analytics A Comprehensive Data Analytics SS to increase your presentation threshold. Encompassed with five stages, this template is a great option to educate and entice your audience. Dispence information on Production, Information Technology, Business Management, using this template. Grab it now to reap its full benefits.
-
 Key Benefits Of Leveraging Statistical Analysis Mastering Data Analytics A Comprehensive Data Analytics SS
This slide outlines advantages of using statistical analysis by businesses aimed at identifying patterns and revolutionizing business operations. It covers benefits such as understand data, determine probability, find casual relationships and data informed decisions. Introducing Key Benefits Of Leveraging Statistical Analysis Mastering Data Analytics A Comprehensive Data Analytics SS to increase your presentation threshold. Encompassed with four stages, this template is a great option to educate and entice your audience. Dispence information on Find Casual Relationships, Understand Data, Determine Probability, using this template. Grab it now to reap its full benefits.
-
 Major Types Of Statistical Analysis Mastering Data Analytics A Comprehensive Data Analytics SS
This slide highlights types of statistical analysis employed by businesses aimed at predicting outcomes using datasets efficiently. It covers six types such as descriptive, inferential, predictive, prescriptive, exploratory and casual analysis. Increase audience engagement and knowledge by dispensing information using Major Types Of Statistical Analysis Mastering Data Analytics A Comprehensive Data Analytics SS. This template helps you present information on six stages. You can also present information on Inferential Statistics, Descriptive Analytics, Predictive Analysis using this PPT design. This layout is completely editable so personaize it now to meet your audiences expectations.
-
 Statistics Highlighting Importance Of Mastering Data Analytics A Comprehensive Data Analytics SS
This slide outlines various statistical facts signifying importance of implementing machine learning algorithms in current business landscape. It covers facts regarding Amazon, business analytics, installation rate, drug discovery cost and ongoing investments. Introducing Statistics Highlighting Importance Of Mastering Data Analytics A Comprehensive Data Analytics SS to increase your presentation threshold. Encompassed with five stages, this template is a great option to educate and entice your audience. Dispence information on Machine Learning Algorithms, Machine Learning Systems, Ml Technologies, using this template. Grab it now to reap its full benefits.
-
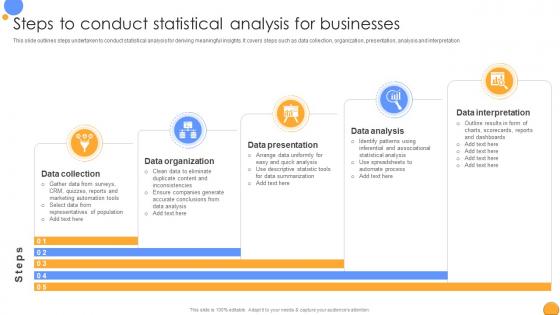 Steps To Conduct Statistical Analysis Mastering Data Analytics A Comprehensive Data Analytics SS
This slide outlines steps undertaken to conduct statistical analysis for deriving meaningful insights. It covers steps such as data collection, organization, presentation, analysis and interpretation. Increase audience engagement and knowledge by dispensing information using Steps To Conduct Statistical Analysis Mastering Data Analytics A Comprehensive Data Analytics SS. This template helps you present information on five stages. You can also present information on Data Organization, Data Presentation, Data Analysis using this PPT design. This layout is completely editable so personaize it now to meet your audiences expectations.


