Powerpoint Templates and Google slides for Statistical Analytics
Save Your Time and attract your audience with our fully editable PPT Templates and Slides.
-
 Data Usage Business Analytics Services Statistics Documenting
Introduce your topic and host expert discussion sessions with this Data Usage Business Analytics Services Statistics Documenting. This template is designed using high-quality visuals, images, graphics, etc, that can be used to showcase your expertise. Different topics can be tackled using the twelve slides included in this template. You can present each topic on a different slide to help your audience interpret the information more effectively. Apart from this, this PPT slideshow is available in two screen sizes, standard and widescreen making its delivery more impactful. This will not only help in presenting a birds-eye view of the topic but also keep your audience engaged. Since this PPT slideshow utilizes well-researched content, it induces strategic thinking and helps you convey your message in the best possible manner. The biggest feature of this design is that it comes with a host of editable features like color, font, background, etc. So, grab it now to deliver a unique presentation every time.
-
 Data Types Analytics Business Programming Financial Government Statistics
Engage buyer personas and boost brand awareness by pitching yourself using this prefabricated set. This Data Types Analytics Business Programming Financial Government Statistics is a great tool to connect with your audience as it contains high-quality content and graphics. This helps in conveying your thoughts in a well-structured manner. It also helps you attain a competitive advantage because of its unique design and aesthetics. In addition to this, you can use this PPT design to portray information and educate your audience on various topics. With twelve slides, this is a great design to use for your upcoming presentations. Not only is it cost-effective but also easily pliable depending on your needs and requirements. As such color, font, or any other design component can be altered. It is also available for immediate download in different formats such as PNG, JPG, etc. So, without any further ado, download it now.
-
 Sales Volume Icon Analytics Enterprise Incremental Product Statistics Growth
Introduce your topic and host expert discussion sessions with this Sales Volume Icon Analytics Enterprise Incremental Product Statistics Growth. This template is designed using high-quality visuals, images, graphics, etc, that can be used to showcase your expertise. Different topics can be tackled using the twelve slides included in this template. You can present each topic on a different slide to help your audience interpret the information more effectively. Apart from this, this PPT slideshow is available in two screen sizes, standard and widescreen making its delivery more impactful. This will not only help in presenting a birds-eye view of the topic but also keep your audience engaged. Since this PPT slideshow utilizes well-researched content, it induces strategic thinking and helps you convey your message in the best possible manner. The biggest feature of this design is that it comes with a host of editable features like color, font, background, etc. So, grab it now to deliver a unique presentation every time.
-
 Statistics Showing Why Women Are Not In Visionary And Analytical Thinking Strategy SS V
Present the topic in a bit more detail with this Statistics Showing Why Women Are Not In Visionary And Analytical Thinking Strategy SS V. Use it as a tool for discussion and navigation on Executive, Positions, Political. This template is free to edit as deemed fit for your organization. Therefore download it now.
-
 Statistics For Companies Using Data Analytics
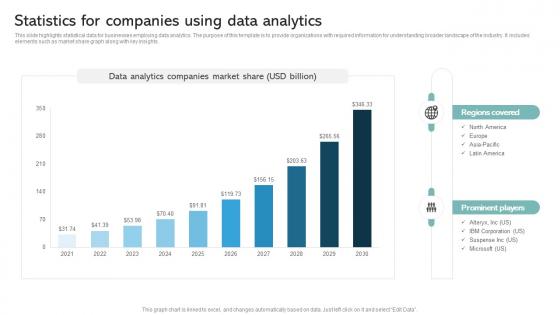
This slide highlights statistical data for businesses employing data analytics. The purpose of this template is to provide organizations with required information for understanding broader landscape of the industry. It includes elements such as market share graph along with key insights. Presenting our well structured Statistics For Companies Using Data Analytics. The topics discussed in this slide are Using Data Analytics, Regions Covered, Prominent Players. This is an instantly available PowerPoint presentation that can be edited conveniently. Download it right away and captivate your audience.
-
 Statistical Analysis For Data Driven Dashboard For Data Visualization And Analytics
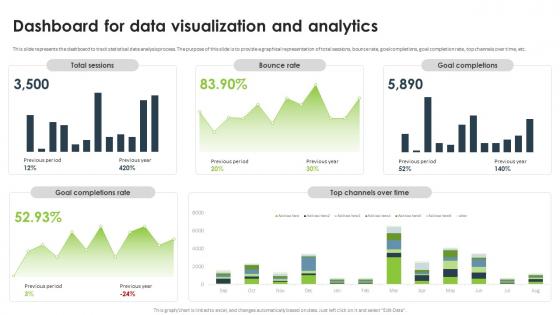
This slide represents the dashboard to track statistical data analysis process. The purpose of this slide is to provide a graphical representation of total sessions, bounce rate, goal completions, goal completion rate, top channels over time, etc. Present the topic in a bit more detail with this Statistical Analysis For Data Driven Dashboard For Data Visualization And Analytics. Use it as a tool for discussion and navigation on Data Visualization And Analytics, Bounce Rate, Goal Completions, Goal Completion Rate. This template is free to edit as deemed fit for your organization. Therefore download it now.
-
 Statistical Analysis For Data Driven Healthcare Data Analytics Monitoring Dashboard
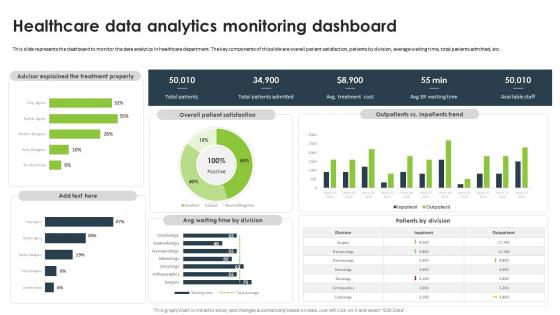
This slide represents the dashboard to monitor the data analytics in healthcare department. The key components of this slide are overall patient satisfaction, patients by division, average waiting time, total patients admitted, etc. Present the topic in a bit more detail with this Statistical Analysis For Data Driven Healthcare Data Analytics Monitoring Dashboard. Use it as a tool for discussion and navigation on Healthcare Data Analytics, Monitoring Dashboard, Healthcare Department. This template is free to edit as deemed fit for your organization. Therefore download it now.
-
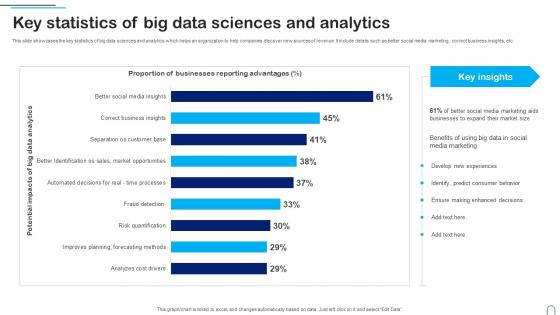 Key Statistics Of Big Data Sciences And Analytics
This slide showcases the key statistics of big data sciences and analytics which helps an organization to help companies discover new sources of revenue. It include details such as better social media marketing, correct business insights, etc. Introducing our Key Statistics Of Big Data Sciences And Analytics set of slides. The topics discussed in these slides are Develop New Experiences, Predict Consumer Behavior, Ensure Making Enhanced Decisions. This is an immediately available PowerPoint presentation that can be conveniently customized. Download it and convince your audience.
-
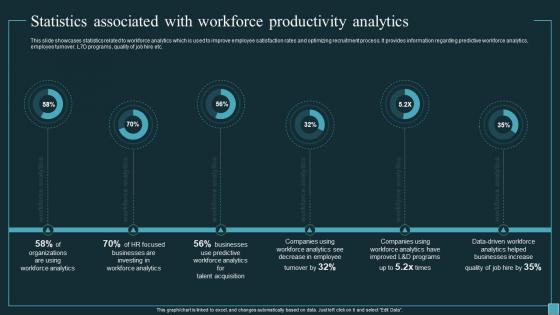 Implementing Workforce Analytics Statistics Associated With Workforce Productivity Analytics Data Analytics SS
This slide showcases statistics related to workforce analytics which is used to improve employee satisfaction rates and optimizing recruitment process. It provides information regarding predictive workforce analytics, employee turnover, L7D programs, quality of job hire etc. Deliver an outstanding presentation on the topic using this Implementing Workforce Analytics Statistics Associated With Workforce Productivity Analytics Data Analytics SS. Dispense information and present a thorough explanation of Statistics Associated, Workforce Productivity Analytics, Predictive Workforce Analytics, Employee Turnover using the slides given. This template can be altered and personalized to fit your needs. It is also available for immediate download. So grab it now.
-
 Key Statistics Associated With Big Data Analytics Market Data Driven Insights Big Data Analytics SS V
This slide showcases various stats related to big data analytics which helps in identifying market growth prospects for future investments. It includes elements such as business profit, data generated, market share, investment etc. Present the topic in a bit more detail with this Key Statistics Associated With Big Data Analytics Market Data Driven Insights Big Data Analytics SS V Use it as a tool for discussion and navigation on Businesses, Data Analytics, Analytics Brings Profit This template is free to edit as deemed fit for your organization. Therefore download it now.
-
 Key Statistics Associated With Business Analytics Complete Guide To Business Analytics Data Analytics SS
This slide showcases various teams involved in utilizing business analytics to improve business operations and optimize performance. It provides information regarding sales teams, human resource, finance and senior executives. Deliver an outstanding presentation on the topic using this Key Statistics Associated With Business Analytics Complete Guide To Business Analytics Data Analytics SS. Dispense information and present a thorough explanation of Key Statistics Associated, Business Analytics Market, Data Analytics Influences, Business Operations using the slides given. This template can be altered and personalized to fit your needs. It is also available for immediate download. So grab it now.
-
 Ports Industry Report Big Data Analytics Market Statistics IR SS
The slide examines the attributes on the basis of technology used in the port industry. The purpose of this slide is to make readers aware about the big data analytics market in the port sector. Present the topic in a bit more detail with this Ports Industry Report Big Data Analytics Market Statistics IR SS. Use it as a tool for discussion and navigation on Big Data Analytics, Market Statistics, Global Marine Big Data, Market Is Expected To Reach. This template is free to edit as deemed fit for your organization. Therefore download it now.
-
 Statistics Highlighting And Monitoring Leveraging Data Analytics For Clinical Success Data Analytics SS
This slide outlines statistical graph highlighting importance of effective site selection and monitoring. It covers current situation of site selection and its impact on enrolment levels Present the topic in a bit more detail with this Statistics Highlighting And Monitoring Leveraging Data Analytics For Clinical Success Data Analytics SS. Use it as a tool for discussion and navigation on Monitoring, Statistics, Therapeutic Practices. This template is free to edit as deemed fit for your organization. Therefore download it now.
-
 Statistical Analysis Techniques Healthcare Data Analytics Monitoring Dashboard
This slide represents the dashboard to monitor the data analytics in healthcare department. The key components of this slide are overall patient satisfaction, patients by division, average waiting time, total patients admitted, etc. Present the topic in a bit more detail with this Statistical Analysis Techniques Healthcare Data Analytics Monitoring Dashboard. Use it as a tool for discussion and navigation on Outpatient Vs Inpatients Trend, Overall Patient Satisfaction, Advisor Explained The Treatment Properly. This template is free to edit as deemed fit for your organization. Therefore download it now.
-
 Analytical CRM Software Global Statistics Of Sales Analytics Software SA SS
The slide showcases sales analytics software market expected to grow from US dollar 4.1 Bn in 2022 to US dollar 12.3 Bn. It also growth drivers that are cloud technology, collaboration tools and AI implementation. Present the topic in a bit more detail with this Analytical CRM Software Global Statistics Of Sales Analytics Software SA SS. Use it as a tool for discussion and navigation on Global Statistics Of Sales Analytics Software. This template is free to edit as deemed fit for your organization. Therefore download it now.
-
 Key Statistics Associated With Telecom Implementing Data Analytics To Enhance Telecom Data Analytics SS
This slide showcases various stats related to telecom analytics which helps in identifying growth prospects for investment. It includes elements such as customer churn rate, business revenue, data analytics, decision making, fraudulent practices, market growth etc. Deliver an outstanding presentation on the topic using this Key Statistics Associated With Telecom Implementing Data Analytics To Enhance Telecom Data Analytics SS. Dispense information and present a thorough explanation of Global Telecom Analytics Market, Decision Making, Business Revenue using the slides given. This template can be altered and personalized to fit your needs. It is also available for immediate download. So grab it now.
-
 Key Statistics For Edge Analytics Uses
This slide covers key statistics of Edge Analytics in various market aspects. The purpose of this template is to provide valuable insights into the current market share, profitability, and deployment models related to Edge Analytics. It includes essential data points that highlight the significance of Edge Analytics.Introducing our premium set of slides with Key Statistics For Edge Analytics Uses. Ellicudate the seven stages and present information using this PPT slide. This is a completely adaptable PowerPoint template design that can be used to interpret topics like Companies Adopting, Production Errors, Compromising Analytics Performance. So download instantly and tailor it with your information.
-
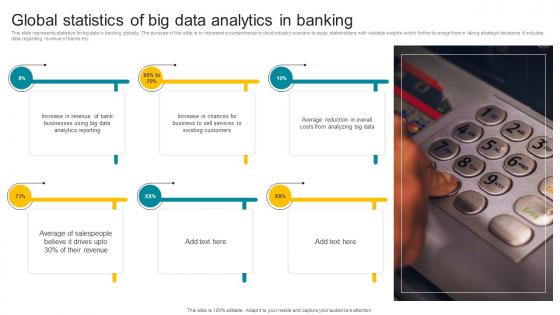 Global Statistics Of Big Data Analytics In Banking
This slide represents statistics for big data in banking globally. The purpose of this slide is to represent a comprehensive cloud industry scenario to equip stakeholders with valuable insights which further leverage them in taking strategic decisions. It includes data regarding, revenue of banks etc. Presenting our set of slides with Global Statistics Of Big Data Analytics In Banking. This exhibits information on six stages of the process. This is an easy to edit and innovatively designed PowerPoint template. So download immediately and highlight information on Increase In Revenue Bank, Existing Customers.
-
 Guide For Web And Digital Marketing Statistics Showing Rising Scope For Marketing Analytics MKT SS V
The following slide highlights key stats to understand growing demand for analytics and boosts marketing efforts. It includes elements such as evaluating campaign performances, gaining competitive edge, future projections, gaining higher profits, appropriating promotional budget etc. Introducing Guide For Web And Digital Marketing Statistics Showing Rising Scope For Marketing Analytics MKT SS V to increase your presentation threshold. Encompassed with Six stages, this template is a great option to educate and entice your audience. Dispence information on Performance Of Campaigns, Decision Making, Marketing Budget, using this template. Grab it now to reap its full benefits.
-
 Overview And Key Statistics Of Iot In Big Data Analytics Iot And Big Data Analytics
Following slide provides introduction of IoT and big data analytics that helps in effective decision making. It includes elements such as overview, objectives and key statistics. Increase audience engagement and knowledge by dispensing information using Overview And Key Statistics Of Iot In Big Data Analytics Iot And Big Data Analytics. This template helps you present information on two stages. You can also present information on Key Statistics, Analytics Market Is Estimated using this PPT design. This layout is completely editable so personaize it now to meet your audiences expectations.
-
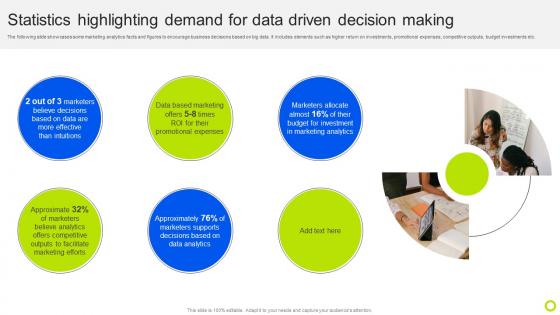 Statistics Highlighting Demand For Data Making Guide For Implementing Analytics MKT SS V
The following slide showcases some marketing analytics facts and figures to encourage business decisions based on big data. It includes elements such as higher return on investments, promotional expenses, competitive outputs, budget investments etc. Introducing Statistics Highlighting Demand For Data Making Guide For Implementing Analytics MKT SS V to increase your presentation threshold. Encompassed with one stage, this template is a great option to educate and entice your audience. Dispence information on Marketers Believe, Marketing Efforts, Budget Investment, using this template. Grab it now to reap its full benefits.
-
 Analytics Transformation Icon Showcasing Business Statistics
Presenting our set of slides with Analytics Transformation Icon Showcasing Business Statistics. This exhibits information on Three stages of the process. This is an easy to edit and innovatively designed PowerPoint template. So download immediately and highlight information on Analytics Transformation Icon Showcasing Business Statistics.
-
 Big Data Marketing Statistics Showing Rising Scope For Marketing Analytics MKT SS V
The following slide highlights key stats to understand growing demand for analytics and boosts marketing efforts. It includes elements such as evaluating campaign performances, gaining competitive edge, future projections, gaining higher profits, appropriating promotional budget etc. Introducing Big Data Marketing Statistics Showing Rising Scope For Marketing Analytics MKT SS V to increase your presentation threshold. Encompassed with Six stages, this template is a great option to educate and entice your audience. Dispence information on Performance Of Campaigns, Higher Profits, Marketing Budget using this template. Grab it now to reap its full benefits.
-
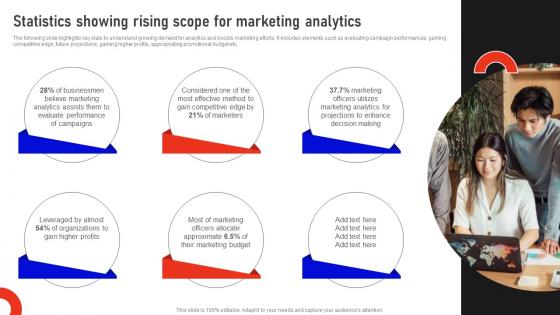 Statistics Showing Rising Scope For Marketing Analytics Marketing Data Analysis MKT SS V
The following slide highlights key stats to understand growing demand for analytics and boosts marketing efforts. It includes elements such as evaluating campaign performances, gaining competitive edge, future projections, gaining higher profits, appropriating promotional budget etc. Increase audience engagement and knowledge by dispensing information using Statistics Showing Rising Scope For Marketing Analytics Marketing Data Analysis MKT SS V This template helps you present information on six stages. You can also present information on Businessmen, Marketing Budget, Decision Making using this PPT design. This layout is completely editable so personaize it now to meet your audiences expectations.
-
 Statistics Showing Rising Scope For Marketing Analytics Guide For Improving Decision MKT SS V
The following slide highlights key stats to understand growing demand for analytics and boosts marketing efforts. It includes elements such as evaluating campaign performances, gaining competitive edge, future projections, gaining higher profits, appropriating promotional budget etc. Increase audience engagement and knowledge by dispensing information using Statistics Showing Rising Scope For Marketing Analytics Guide For Improving Decision MKT SS V. This template helps you present information on six stages. You can also present information on Statistics Showing, Marketing Analytics, Performance Of Campaigns using this PPT design. This layout is completely editable so personaize it now to meet your audiences expectations.
-
 Analytics Intelligence Icon Showcasing Statistics
Presenting our set of slides with Analytics Intelligence Icon Showcasing Statistics. This exhibits information on four stages of the process. This is an easy to edit and innovatively designed PowerPoint template. So download immediately and highlight information on Analytics, Showcasing, Statistics.
-
 Business Analytics with Statistics AI Image PowerPoint Presentation PPT ECS
Introducing a Visual PPT on Business Analytics with Statistics. Each PowerPoint Slide has been crafted by our Presentation Specialists. Easily update content to your liking, by adding or removing details. Also, the PPT Template is adaptable to all screen sizes and monitors and is even compatible with Google Slides. Download the PPT, add or delete content, and showcase it with assurance.
-
 Guide For Boosting Marketing Statistics Showing Rising Scope For Marketing Analytics MKT SS V
The following slide highlights key stats to understand growing demand for analytics and boosts marketing efforts. It includes elements such as evaluating campaign performances, gaining competitive edge, future projections, gaining higher profits, appropriating promotional budget etc. Increase audience engagement and knowledge by dispensing information using Guide For Boosting Marketing Statistics Showing Rising Scope For Marketing Analytics MKT SS V. This template helps you present information on five stages. You can also present information on Businessmen Believe, Leveraged By Almost using this PPT design. This layout is completely editable so personaize it now to meet your audiences expectations.
-
 Text Analytics Icon For Statistical Report
Presenting our well structured Text Analytics Icon For Statistical Report. The topics discussed in this slide are Text Analytics Icon, Statistical Report. This is an instantly available PowerPoint presentation that can be edited conveniently. Download it right away and captivate your audience.
-
 Key Industry Statistics Associated With Visionary And Analytical Thinking Strategy SS V
This slide provides glimpse about current industry statistics related to leadership and management that help business understand the changing environment. It includes facts about general leadership, women in leadership, leadership training, etc. Increase audience engagement and knowledge by dispensing information using Key Industry Statistics Associated With Visionary And Analytical Thinking Strategy SS V. This template helps you present information on four stages. You can also present information on General, Leadership, Statistics using this PPT design. This layout is completely editable so personaize it now to meet your audiences expectations.
-
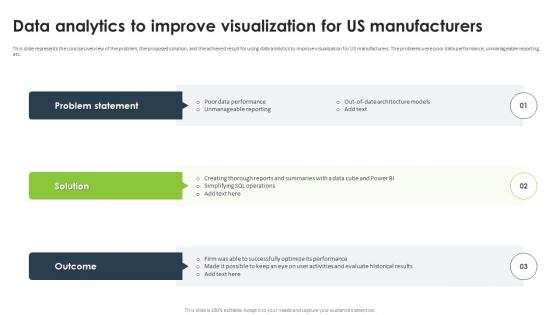 Data Analytics To Improve Visualization For Us Manufacturers Statistical Analysis For Data Driven
This slide represents the concise overview of the problem, the proposed solution, and the achieved result for using data analytics to improve visualization for US manufacturers. The problems were poor data performance, unmanageable reporting, etc. Increase audience engagement and knowledge by dispensing information using Data Analytics To Improve Visualization For Us Manufacturers Statistical Analysis For Data Driven. This template helps you present information on three stages. You can also present information on Poor Data Performance, Unmanageable Reporting, Data Analytics, Visualization For US Manufacturers using this PPT design. This layout is completely editable so personaize it now to meet your audiences expectations.
-
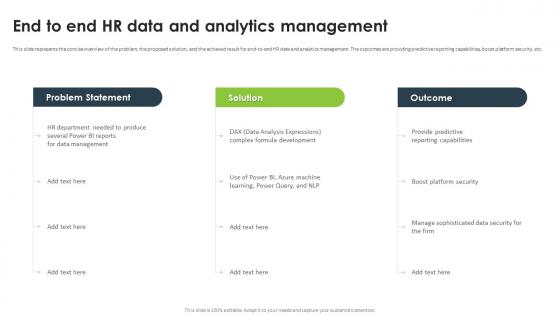 Statistical Analysis For Data Driven End To End Hr Data And Analytics Management
This slide represents the concise overview of the problem, the proposed solution, and the achieved result for end-to-end HR data and analytics management. The outcomes are providing predictive reporting capabilities, boost platform security, etc. Deliver an outstanding presentation on the topic using this Statistical Analysis For Data Driven End To End HR Data And Analytics Management. Dispense information and present a thorough explanation of Predictive Reporting Capabilities, Data Analysis Expressions, Boost Platform Security using the slides given. This template can be altered and personalized to fit your needs. It is also available for immediate download. So grab it now.
-
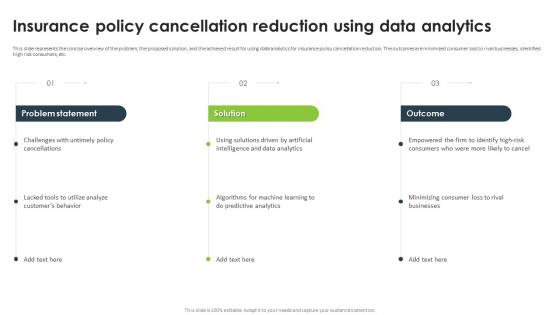 Statistical Analysis For Data Driven Insurance Policy Cancellation Reduction Using Data Analytics
This slide represents the concise overview of the problem, the proposed solution, and the achieved result for using data analytics for insurance policy cancellation reduction. The outcomes are minimized consumer loss to rival businesses, identified high risk consumers, etc. Deliver an outstanding presentation on the topic using this Statistical Analysis For Data Driven Insurance Policy Cancellation Reduction Using Data Analytics. Dispense information and present a thorough explanation of Insurance Policy Cancellation, Reduction Using Data Analytics, Identified High Risk Consumers using the slides given. This template can be altered and personalized to fit your needs. It is also available for immediate download. So grab it now.
-
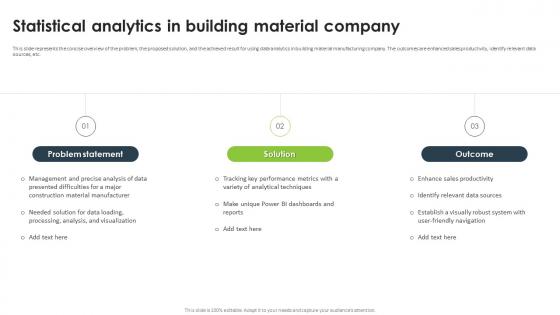 Statistical Analysis For Data Driven Statistical Analytics In Building Material Company
This slide represents the concise overview of the problem, the proposed solution, and the achieved result for using data analytics in building material manufacturing company. The outcomes are enhanced sales productivity, identify relevant data sources, etc. Introducing Statistical Analysis For Data Driven Statistical Analytics In Building Material Company to increase your presentation threshold. Encompassed with three stages, this template is a great option to educate and entice your audience. Dispence information on Statistical Analytics, Building Material Company, Identify Relevant Data Sources, Enhanced Sales Productivity, using this template. Grab it now to reap its full benefits.
-
 Statistical Analysis For Data Driven Statistical Analytics In Food Processing Outlet
This slide represents the concise overview of the problem, the proposed solution, and the achieved result for using data analytics in food processing outlet. The outcomes are precise food quantity forecasts, optimized resource allocation, etc. Increase audience engagement and knowledge by dispensing information using Statistical Analysis For Data Driven Statistical Analytics In Food Processing Outlet. This template helps you present information on three stages. You can also present information on Statistical Analytics, Food Processing Outlet, Optimized Resource Allocation, Data Analytics using this PPT design. This layout is completely editable so personaize it now to meet your audiences expectations.
-
 Statistic Report Google Data Analytics Icon
Introducing our premium set of slides with Statistic Report Google Data Analytics Icon Ellicudate the three stages and present information using this PPT slide. This is a completely adaptable PowerPoint template design that can be used to interpret topics like Statistic Report, Google Data Analytics Icon So download instantly and tailor it with your information.
-
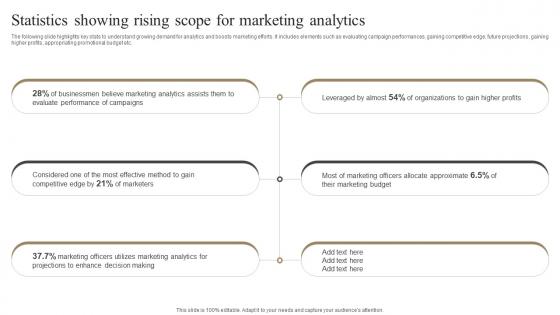 Statistics Showing Rising Scope For Marketing Analytics Measuring Marketing Success MKT SS V
The following slide highlights key stats to understand growing demand for analytics and boosts marketing efforts. It includes elements such as evaluating campaign performances, gaining competitive edge, future projections, gaining higher profits, appropriating promotional budget etc. Increase audience engagement and knowledge by dispensing information using Statistics Showing Rising Scope For Marketing Analytics Measuring Marketing Success MKT SS V This template helps you present information on six stages. You can also present information on Believe Marketing, Analytics Assists, Campaigns using this PPT design. This layout is completely editable so personaize it now to meet your audiences expectations.
-
 Implementing Big Data Analytics Statistics Associated With Supply Chain Analytics Markets CRP DK SS
This slide showcases various stats related to supply chain analytics solutions which includes stock inventory, logistic operations, optimal supply chains etc. Increase audience engagement and knowledge by dispensing information using Implementing Big Data Analytics Statistics Associated With Supply Chain Analytics Markets CRP DK SS. This template helps you present information on four stages. You can also present information on Supply Chain Analytics, Stock Inventory, Logistic Operations, Optimal Supply Chains using this PPT design. This layout is completely editable so personaize it now to meet your audiences expectations.
-
 Key Statistics Associated With IoT Big Data Analytics Comprehensive Guide For Big Data IoT SS
Following slide depicts statistics for IoT big data analytics across various sectors to understand its potential across to improve efficiency. It covers elements such as market size, CAGR, manufacturing sector, revenue, etc. Introducing Key Statistics Associated With IoT Big Data Analytics Comprehensive Guide For Big Data IoT SS to increase your presentation threshold. Encompassed with five stages, this template is a great option to educate and entice your audience. Dispence information on Estimated Generate, Manufacturing Projected, Organizations Real Teal, using this template. Grab it now to reap its full benefits.
-
 Key Statistics Associated With Big Data Analytics Big Data Analytics Applications Data Analytics SS
This slide showcases various stats related to big data analytics which helps in identifying market growth prospects for future investments. It includes elements such as business profit, data generated, market share, investment etc. Increase audience engagement and knowledge by dispensing information using Key Statistics Associated With Big Data Analytics Big Data Analytics Applications Data Analytics SS. This template helps you present information on six stages. You can also present information on Data Analytics, Profit To Business, Companies Since using this PPT design. This layout is completely editable so personaize it now to meet your audiences expectations.
-
 Key Statistics Associated With Healthcare Data Definitive Guide To Implement Data Analytics SS
This slide showcases various stats related to healthcare data analytics which helps in making informed investment decisions. It includes elements such as clinical decision support system, operational costs, decision making, big data analytics, patient health etc. Introducing Key Statistics Associated With Healthcare Data Definitive Guide To Implement Data Analytics SS to increase your presentation threshold. Encompassed with Five stages, this template is a great option to educate and entice your audience. Dispence information on Data Analytics, Healthcare Organizations, Clinical Decision, using this template. Grab it now to reap its full benefits.
-
 Log Statistical Data Analytic Icon
Introducing our Log Statistical Data Analytic Icon set of slides.The topics discussed in these slides are Log Statistical Data, Analytic Icon.This is an immediately available PowerPoint presentation that can be conveniently customized.Download it and convince your audience.
-
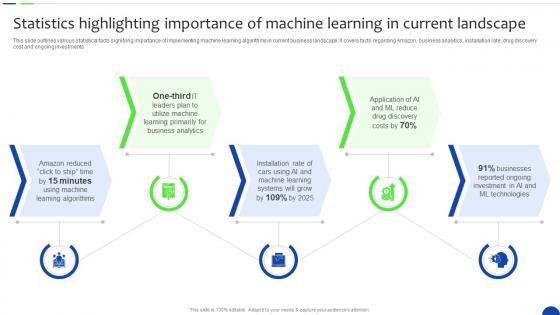 Statistics Highlighting Importance Of Machine Unlocking The Power Of Prescriptive Data Analytics SS
This slide outlines various statistical facts signifying importance of implementing machine learning algorithms in current business landscape. It covers facts regarding Amazon, business analytics, installation rate, drug discovery cost and ongoing investments. Introducing Statistics Highlighting Importance Of Machine Unlocking The Power Of Prescriptive Data Analytics SS to increase your presentation threshold. Encompassed with five stages, this template is a great option to educate and entice your audience. Dispence information on Machine Learning, ML Technologies, Machine Learning Algorithms, using this template. Grab it now to reap its full benefits.
-
 Statistics Highlighting Importance Enhancing Business Insights Implementing Product Data Analytics SS V
This slide outlines statistical figures citing reasons for businesses to adopt retention analysis. It covers reasons pertaining to CLV to CAC ratio, boost in profits, new customer acquisition and customer data analytics. Increase audience engagement and knowledge by dispensing information using Statistics Highlighting Importance Enhancing Business Insights Implementing Product Data Analytics SS V. This template helps you present information on four stages. You can also present information on Retention Rate, Boost, Profits using this PPT design. This layout is completely editable so personaize it now to meet your audiences expectations.
-
 Statistics Highlighting Need For Enhancing Business Insights Implementing Product Data Analytics SS V
This slide outlines statistical figures citing reasons for businesses to adopt customer journey mapping. It covers reasons pertaining to providers, customer journey, processes, sales leads, etc. Introducing Statistics Highlighting Need For Enhancing Business Insights Implementing Product Data Analytics SS V to increase your presentation threshold. Encompassed with five stages, this template is a great option to educate and entice your audience. Dispence information on Statistics Highlighting Need, Customer Journey Mapping, using this template. Grab it now to reap its full benefits.
-
 Statistics Highlighting Enhancing Business Insights Implementing Product Data Analytics SS V
This slide provides statistical figures highlighting importance of leveraging product analytics in businesses to make data driven decisions. It covers statistics related to recommendations, personalisation, retention, generation of new customers and profits. Increase audience engagement and knowledge by dispensing information using Statistics Highlighting Enhancing Business Insights Implementing Product Data Analytics SS V. This template helps you present information on five stages. You can also present information on Statistics Highlighting, Importance Of Adopting, Product Analytics using this PPT design. This layout is completely editable so personaize it now to meet your audiences expectations.
-
 Applications Of Statistical Analysis For Mastering Data Analytics A Comprehensive Data Analytics SS
This slide outlines real life applications of statistical analysis in various industries aimed compiling and reporting research findings. It covers use cases of finance, marketing, information technology, business management, etc. Introducing Applications Of Statistical Analysis For Mastering Data Analytics A Comprehensive Data Analytics SS to increase your presentation threshold. Encompassed with five stages, this template is a great option to educate and entice your audience. Dispence information on Production, Information Technology, Business Management, using this template. Grab it now to reap its full benefits.
-
 Key Benefits Of Leveraging Statistical Analysis Mastering Data Analytics A Comprehensive Data Analytics SS
This slide outlines advantages of using statistical analysis by businesses aimed at identifying patterns and revolutionizing business operations. It covers benefits such as understand data, determine probability, find casual relationships and data informed decisions. Introducing Key Benefits Of Leveraging Statistical Analysis Mastering Data Analytics A Comprehensive Data Analytics SS to increase your presentation threshold. Encompassed with four stages, this template is a great option to educate and entice your audience. Dispence information on Find Casual Relationships, Understand Data, Determine Probability, using this template. Grab it now to reap its full benefits.
-
 Major Types Of Statistical Analysis Mastering Data Analytics A Comprehensive Data Analytics SS
This slide highlights types of statistical analysis employed by businesses aimed at predicting outcomes using datasets efficiently. It covers six types such as descriptive, inferential, predictive, prescriptive, exploratory and casual analysis. Increase audience engagement and knowledge by dispensing information using Major Types Of Statistical Analysis Mastering Data Analytics A Comprehensive Data Analytics SS. This template helps you present information on six stages. You can also present information on Inferential Statistics, Descriptive Analytics, Predictive Analysis using this PPT design. This layout is completely editable so personaize it now to meet your audiences expectations.
-
 Statistics Highlighting Importance Of Mastering Data Analytics A Comprehensive Data Analytics SS
This slide outlines various statistical facts signifying importance of implementing machine learning algorithms in current business landscape. It covers facts regarding Amazon, business analytics, installation rate, drug discovery cost and ongoing investments. Introducing Statistics Highlighting Importance Of Mastering Data Analytics A Comprehensive Data Analytics SS to increase your presentation threshold. Encompassed with five stages, this template is a great option to educate and entice your audience. Dispence information on Machine Learning Algorithms, Machine Learning Systems, Ml Technologies, using this template. Grab it now to reap its full benefits.
-
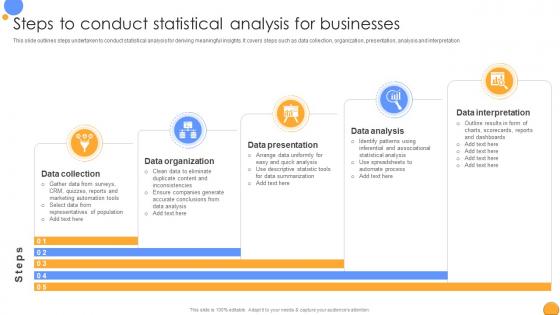 Steps To Conduct Statistical Analysis Mastering Data Analytics A Comprehensive Data Analytics SS
This slide outlines steps undertaken to conduct statistical analysis for deriving meaningful insights. It covers steps such as data collection, organization, presentation, analysis and interpretation. Increase audience engagement and knowledge by dispensing information using Steps To Conduct Statistical Analysis Mastering Data Analytics A Comprehensive Data Analytics SS. This template helps you present information on five stages. You can also present information on Data Organization, Data Presentation, Data Analysis using this PPT design. This layout is completely editable so personaize it now to meet your audiences expectations.
-
 Statistics Outlining Importance Of Insurance Analytics Navigating The Future Of Insurance Data Analytics SS
This slide outlines statistical facts outlining importance of implementing data analytics in insurance to improve efficiency of claims, policy and sales processes. It covers facts related to optimized prediction, predictive analytics, investment in big data analytics and benefits. Increase audience engagement and knowledge by dispensing information using Statistics Outlining Importance Of Insurance Analytics Navigating The Future Of Insurance Data Analytics SS. This template helps you present information on four stages. You can also present information on Data Analytics Mechanisms, Current Investment Rate, Investment In Insurance Analytics using this PPT design. This layout is completely editable so personaize it now to meet your audiences expectations.
-
 Statistical Of Analytics Clinical Research Leveraging Data Analytics For Clinical Success Data Analytics SS
This slide outlines statistics highlighting importance of clinical analytics in current business landscape aimed at helping organisations understand its usability. It covers facts related to risk identification, well being, benefits utilization and program effectiveness Introducing Statistical Of Analytics Clinical Research Leveraging Data Analytics For Clinical Success Data Analytics SS to increase your presentation threshold. Encompassed with five stages, this template is a great option to educate and entice your audience. Dispence information on Clinical Research, Statistical, Data Analytics, using this template. Grab it now to reap its full benefits.
-
 Key Statistics Associated With Digital Marketing Leveraging Digital Analytics To Develop Data Analytics SS
This slide showcases various stats related to digital marketing analytics which helps in identifying growth prospects for investment. It includes elements such as marketing budget, customer databases, campaign performance, informed decision making, revenue generation, sales contacts etc. Introducing Key Statistics Associated With Digital Marketing Leveraging Digital Analytics To Develop Data Analytics SS to increase your presentation threshold. Encompassed with six stages, this template is a great option to educate and entice your audience. Dispence information on Digital Analytics, Campaign Performance, Sales Contacts And Customer Databases, using this template. Grab it now to reap its full benefits.
-
 Predictive Analytics For Data Driven Statistical Analysis System Tool For Predictive Analytics AI SS
This slide showcases SAS tool that can help organization to implement predictive analytics process. It also highlights key features of software that are data preparation, statistical analysis and predictive analytics. Introducing Predictive Analytics For Data Driven Statistical Analysis System Tool For Predictive Analytics AI SS to increase your presentation threshold. Encompassed with three stages, this template is a great option to educate and entice your audience. Dispence information on Statistical Analysis, Data Preparation, Predictive Analytics, Statistical Analysis System Tool, using this template. Grab it now to reap its full benefits.
-
 Statistics Showing Impact Of Marketing Analytics Tool
The purpose of this slide is to outline the various statistics of marketing analytics tool. The statistics are related to customer acquisition, customer retention, social media, segmentation, promotion strategy etc. Presenting our well-structured Statistics Showing Impact Of Marketing Analytics Tool. The topics discussed in this slide are Statistics Showing Impact Of Marketing Analytics Tool. This is an instantly available PowerPoint presentation that can be edited conveniently. Download it right away and captivate your audience.
-
 Statistical Analytics Report Showing Evolution Of Sales Industry
The following slide showcases a comprehensive analytical report highlighting the evolution of sales industry over the years. It provides information about sales cycle, state of the sales industry, etc. Presenting our well structured Statistical Analytics Report Showing Evolution Of Sales Industry. The topics discussed in this slide are Sales Industry, Organizations, Technologies. This is an instantly available PowerPoint presentation that can be edited conveniently. Download it right away and captivate your audience.
-
 Major Statistics Of Business Analytics Tools
Mentioned slide outlines various statistics of business analytics tools. It covers information about the various benefits companies get after using analytics tool, factors firms consider before selecting tools and the challenges to the use of analytics tool. Introducing our Major Statistics Of Business Analytics Tools set of slides. The topics discussed in these slides are Statistics Of Business Analytics Tools, Benefits Companies Get After Using Analytics Tool, Factors Firms Consider Before Selecting Tools. This is an immediately available PowerPoint presentation that can be conveniently customized. Download it and convince your audience.
-
 Key Branding Campaign Statistics For Business Analytics
The following slide exhibits influencer marketing strategy for building partnerships, providing value to audience. The main components are influencer marketing size, social media platforms, influencer marketing adoption rate etc. Presenting our well structured Key Branding Campaign Statistics For Business Analytics. The topics discussed in this slide are Key Insights, Brand Loyalty, Western Countries. This is an instantly available PowerPoint presentation that can be edited conveniently. Download it right away and captivate your audience.
-
 Business Statistics Related To Customer Data Analytics
This slide brings forth business statistics related to customer data analytics that give an idea about benefits of using customer data. Major benefits relate to sales growth, sales, return on investment and profit. Introducing our Business Statistics Related To Customer Data Analytics set of slides. The topics discussed in these slides are Brands customer, data analytics, growth sales because. This is an immediately available PowerPoint presentation that can be conveniently customized. Download it and convince your audience.


