Powerpoint Templates and Google slides for Sprint Performance
Save Your Time and attract your audience with our fully editable PPT Templates and Slides.
-
 Key Performance Indicators For In Sprint Testing Automation
This slide highlights the key performance indicators for in-sprint testing automation. The purpose of this slide is to help the business measure the effectiveness of testing automation. It includes KPIs such as the percentage of automatable test cases, automaton test coverage, etc. Presenting our well structured Key Performance Indicators For In Sprint Testing Automation. The topics discussed in this slide are Performance, Indicators, Automation. This is an instantly available PowerPoint presentation that can be edited conveniently. Download it right away and captivate your audience.
-
 Beer And Sprints Pairings Guidelines Bridging Performance Gaps Through Hospitality DTE SS
The slide showcases pairing techniques for beer and sprints. Elements are considered intensity, complement flavors, contrast with complements, etc. Deliver an outstanding presentation on the topic using this Beer And Sprints Pairings Guidelines Bridging Performance Gaps Through Hospitality DTE SS. Dispense information and present a thorough explanation of Beer Pairing, Sprints Pairing using the slides given. This template can be altered and personalized to fit your needs. It is also available for immediate download. So grab it now.
-
 Types Of Sprints And Its Characteristics Bridging Performance Gaps Through Hospitality DTE SS
The slide showcases sprints types such as vodka, whiskey, rum, gin, tequila, brandy and rye. It also showcases its characteristics and examples. Present the topic in a bit more detail with this Types Of Sprints And Its Characteristics Bridging Performance Gaps Through Hospitality DTE SS. Use it as a tool for discussion and navigation on Types Of Sprints. This template is free to edit as deemed fit for your organization. Therefore download it now.
-
 Scrum Metrics Sprint Performance Dashboard
This slide illustrates graphical representation of sprint performance in scrum framework. It includes KPIs like team velocity, past trends of velocity and variance in sprints etc. Introducing our Scrum Metrics Sprint Performance Dashboard set of slides. The topics discussed in these slides are Team Velocity, Past Trends Of Velocity, Variance In Sprint. This is an immediately available PowerPoint presentation that can be conveniently customized. Download it and convince your audience.
-
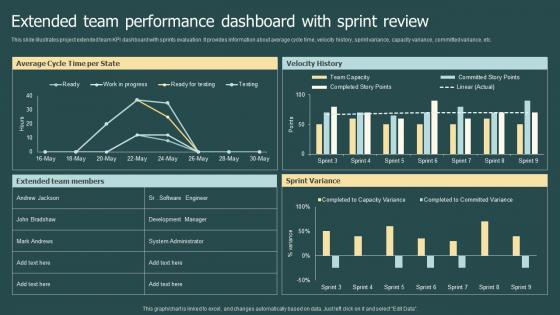
 Extended Team Performance Dashboard With Sprint Review
This slide illustrates project extended team KPI dashboard with sprints evaluation. It provides information about average cycle time, velocity history, sprint variance, capacity variance, committed variance, etc. Introducing our Extended Team Performance Dashboard With Sprint Review set of slides. The topics discussed in these slides are Average Cycle Time Per State, Velocity History, Extended Team Members. This is an immediately available PowerPoint presentation that can be conveniently customized. Download it and convince your audience.
-
 Key Steps Performed By Product Owner In Sprint Testing Plan
This slide showcases steps adopted by product owner in sprint testing to get beat outcomes. It also includes business objectives , sprint goal , forecast , development plan , etc. Introducing our premium set of slides with Key Steps Performed By Product Owner In Sprint Testing Plan. Ellicudate the four stages and present information using this PPT slide. This is a completely adaptable PowerPoint template design that can be used to interpret topics like Business Objectives, Sprint Goal, Forecast. So download instantly and tailor it with your information.
-
 Sprint planning team performance product improvement and team capacity
Presenting this set of slides with name - Sprint Planning Team Performance Product Improvement And Team Capacity. This is a four stage process. The stages in this process are Sprint Planning, Scrum Planning, Agile Planning.
-
 Current team performance using velocity metrics sprint ppt powerpoint presentation layout
This slide depicts the current performance of the team through a graph that shows the committed work to be done and the actual work that has been done. The tasks have been divided into various sprints and performance is measured in story points. Presenting this set of slides with name Current Team Performance Using Velocity Metrics Sprint Ppt Powerpoint Presentation Layout. The topics discussed in these slides are Performance, Graph, Actual Units. This is a completely editable PowerPoint presentation and is available for immediate download. Download now and impress your audience.
-
 Current team performance using velocity metrics sprint ppt icons
This slide depicts the current performance of the team through a graph that shows the committed work to be done and the actual work that has been done. The tasks have been divided into various sprints and performance is measured in story points. Present the topic in a bit more detail with this Current Team Performance Using Velocity Metrics Sprint Ppt Icons Use it as a tool for discussion and navigation on Current Team Performance Using Velocity Metrics. This template is free to edit as deemed fit for your organization. Therefore download it now.


