Powerpoint Templates and Google slides for Snapshot
Save Your Time and attract your audience with our fully editable PPT Templates and Slides.
-
 Automation Project Status Dashboard Snapshot Of Consulting Firm
This slide showcases project status dashboard that provides a concise visual of key indicators progress and allow to compare actual performance with pre-built objectives. Key metrics covered are cost performance, time v or s project phase, timeline v or s resource capacity. Introducing our Automation Project Status Dashboard Of Consulting Firm set of slides. The topics discussed in these slides are Automation Project Status, Dashboard Consulting Firm. This is an immediately available PowerPoint presentation that can be conveniently customized. Download it and convince your audience.
-
 F531 Operational Risk Management Key Metrics Dashboard Snapshot Enterprise Management Mitigation Plan
This slide represents dashboard representing the key metrics of operational risk management. It includes KPIs such as operational risk by rating, by month, operational risk list etc. Present the topic in a bit more detail with this F531 Operational Risk Management Key Metrics Dashboard Snapshot Enterprise Management Mitigation Plan. Use it as a tool for discussion and navigation on Operational, Management, Dashboard. This template is free to edit as deemed fit for your organization. Therefore download it now.
-
 Regulatory Report Dashboard Snapshot With Compliance Status
The following slide exhibits regulatory reporting dashboard Snapshot with compliance summary. It provides information about overview, geography status, legislation, status breakdown, etc. Presenting our well-structured Regulatory Report Dashboard With Compliance Status. The topics discussed in this slide are Critical, Medium, High, Legislation Category Breakdown. This is an instantly available PowerPoint presentation that can be edited conveniently. Download it right away and captivate your audience.
-
 Regulatory Report Security Dashboard Snapshot With Gateways
This slide shows the dashboard depicting regulatory compliance report. It covers information about monitoring practices, gateways, blades with review percentage such as secure, good, medium and poor Introducing our Regulatory Report Security Dashboard Snapshot With Gateways set of slides. The topics discussed in these slides are Secure, Good, Medium, Poor. This is an immediately available PowerPoint presentation that can be conveniently customized. Download it and convince your audience.
-
 Dashboard Snapshot Showing Profit Potential From Corporate Trends
This slide illustrates facts and figures related to five years of corporate financial figures for evaluation of expected profit. It includes yearly revenue and EBITDA, PAT and PAT margin, net worth and return on net worth etc. Presenting our well structured Dashboard Showing Profit Potential From Corporate Trends. The topics discussed in this slide are Dashboard, Profit Potential, Corporate Trends. This is an instantly available PowerPoint presentation that can be edited conveniently. Download it right away and captivate your audience.
-
 KPI Dashboard Snapshot Showing Workforce Headcount Analysis
Mentioned slide outlines key performance indicator KPI dashboard which can be used by an organization calculate workforce headcount . The major metrics covered in the template are total employees, average employees, gender ratio, absence rate, et c. Introducing our KPI Dashboard Snapshot Showing Workforce Headcount Analysis set of slides. The topics discussed in these slides are KPI Dashboard, Showing Workforce, Headcount Analysis. This is an immediately available PowerPoint presentation that can be conveniently customized. Download it and convince your audience.
-
 Customer Churn Dashboard Snapshot With Monthly Trends
This slide showcases summery for overall month over month attrition rate to improve company revenue and track total consumers lost. It further includes details about existing, new and active clients. Introducing our Customer Churn Dashboard Snapshot With Monthly Trends set of slides. The topics discussed in these slides are Customer Churn Dashboard, Monthly Trends. This is an immediately available PowerPoint presentation that can be conveniently customized. Download it and convince your audience.
-
 Record To Report Dashboard Snapshot With Income Statement
Following slide outlines a comprehensive record to report dashboard used for taking financial decisions. The various metrics covered in this slide are total income, expenses, net profit, cash at end of month, income and expenses, quick ratio, current ratio etc. Introducing our Record To Report Dashboard With Income Statement set of slides. The topics discussed in these slides are Record Report, Dashboard, Income Statement. This is an immediately available PowerPoint presentation that can be conveniently customized. Download it and convince your audience.
-
 Financial Performance Indicator Dashboard Snapshot Measuring Business Performance Using Kpis
This slide shows financial performance indicator dashboard covering net profit and net sales, profitability indicator ratios, cogs and net profit by region or channel. Present the topic in a bit more detail with this Financial Performance Indicator Dashboard Snapshot Measuring Business Performance Using Kpis. Use it as a tool for discussion and navigation on Financial, Performance, Dashboard. This template is free to edit as deemed fit for your organization. Therefore download it now.
-
 Profit Margin Dashboard Snapshot Measuring Business Performance Using Kpis
Following slide illustrates profit margin dashboard with a 12 months format. It also includes gross profit margin, operating profit margin and net profit margin. Deliver an outstanding presentation on the topic using this Profit Margin Dashboard Snapshot Measuring Business Performance Using Kpis. Dispense information and present a thorough explanation of Dashboard, Illustrates, Operating using the slides given. This template can be altered and personalized to fit your needs. It is also available for immediate download. So grab it now.
-
 Hr Talent Management Key Metrics Dashboard Snapshot Implementing Business Enhancing Hr Operation
This slide represents the KPI dashboard snapshot to track and monitor management of talent by the HR department. It includes details related to talent satisfaction, talent turnover rate, fired talents etc. Deliver an outstanding presentation on the topic using this Hr Talent Management Key Metrics Dashboard Implementing Business Enhancing Hr Operation. Dispense information and present a thorough explanation of Management, Dashboard, Satisfaction using the slides given. This template can be altered and personalized to fit your needs. It is also available for immediate download. So grab it now.
-
 Dashboard Snapshot For Risk Communication Planning And Key Metrics Tracking
This slide shows dashboard snapshot for planning risk communication and tracking key metrics which includes heat map of risk, classification, objectives, effectiveness, critical risks, etc. Presenting our well-structured Dashboard For Risk Communication Planning And Key Metrics Tracking. The topics discussed in this slide are Classification Risks, Tactical Objectives, Controls Effectiveness. This is an instantly available PowerPoint presentation that can be edited conveniently. Download it right away and captivate your audience.
-
 Dashboard Snapshot For Email Communication Metrics
This slide showcases email communication dashboard snapshot that can help to keep track of performance of email marketing campaign. Its key elements are number of campaign, total recipients, average open percentage and average click percentage Introducing our Dashboard For Email Communication Metrics set of slides. The topics discussed in these slides are Opens, Clicks, Device. This is an immediately available PowerPoint presentation that can be conveniently customized. Download it and convince your audience.
-
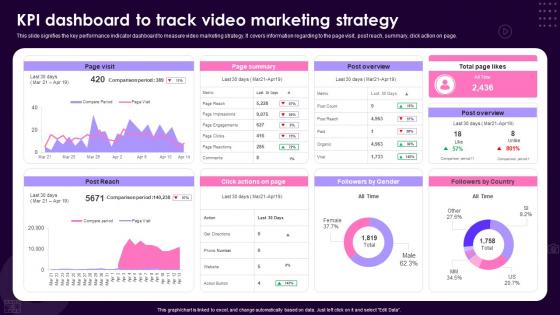 KPI Dashboard Snapshot To Track Video Marketing Strategy
This slide signifies the key performance indicator dashboard to measure video marketing strategy. It covers information regarding to the page visit, post reach, summary, click action on page. Introducing our KPI Dashboard Snapshot To Track Video Marketing Strategy set of slides. The topics discussed in these slides are KPI Dashboard, Video Marketing Strategy. This is an immediately available PowerPoint presentation that can be conveniently customized. Download it and convince your audience.
-
 Project Management Report Dashboard Snapshot Exhibiting Task Progress
This slide showcase report dashboard snapshot of project management representing task progress status. It covers project name, status, tasks, priority, budget and pending items for the project. Introducing our Project Management Report Dashboard Exhibiting Task Progress set of slides. The topics discussed in these slides are Task, Budget, Company Website Development. This is an immediately available PowerPoint presentation that can be conveniently customized. Download it and convince your audience.
-
 Customer Intelligence Dashboard Snapshot With Net Promoter Score
Mentioned slide visually represents customer intelligence dashboard that can be used by organization in order to understand customer journey. Customer satisfaction by product, net promotor score of last 90 and 365 days, agent performance, satisfaction by channel are some of the key metrics which are shown in this slide. Introducing our Customer Intelligence Dashboard Snapshot With Net Promoter Score set of slides. The topics discussed in these slides are Customer Intelligence Dashboard, Net Promoter Score. This is an immediately available PowerPoint presentation that can be conveniently customized. Download it and convince your audience.
-
 Project Management Dashboard Snapshot And Reports
This slide covers the project management dashboard which focuses on project financials with business objective, project costs, status, approved budget, forecasting, data variance, capital expenditure on new product development, comparison of total cost with actual budget, etc. Presenting our well structured Project Management Dashboard Snapshot And Reports. The topics discussed in this slide are Budget Vs Actual Speed By Portfolio, Project Financials By Business Objective, Budget By Investment Type And Business . This is an instantly available PowerPoint presentation that can be edited conveniently. Download it right away and captivate your audience.
-
 Safety Team Performance Management Dashboard Snapshot With Key Metrics
This slide shows a dashboard representing performance measurement of the safety team of the organization on the basis of key performance indicators. It includes details related to safety team performance ranking, average result area scores etc. Presenting our well structured Safety Team Performance Management Dashboard Snapshot With Key Metrics. The topics discussed in this slide are Safety Team Performance, Management Dashboard, Key Metrics. This is an instantly available PowerPoint presentation that can be edited conveniently. Download it right away and captivate your audience.
-
 Financial Dashboard Snapshot For Business Scenario Analysis
This slide represents the key financial performance indicators of a business to analyze and plan its scenario. It includes KPIs such as cash conversion cycle, working capital and current ratio. Presenting our well structured Financial Dashboard For Business Scenario Analysis. The topics discussed in this slide are Current Assets, Current Liabilities, Financial Dashboard. This is an instantly available PowerPoint presentation that can be edited conveniently. Download it right away and captivate your audience.
-
 Data Quality Analysis And Measures Dashboard Snapshot
This slide defines the dashboard for analyzing and measuring the data quality. It includes information related to account, contacts and opportunities. Introducing our Data Quality Analysis And Measures Dashboard Snapshot set of slides. The topics discussed in these slides are Campaign Data, Quality Average, Opportunity Data. This is an immediately available PowerPoint presentation that can be conveniently customized. Download it and convince your audience.
-
 Performance KPI Dashboard Snapshot To Measure Financial Introduction To Corporate Financial Planning And Analysis
The following slide outlines a comprehensive key performance indicator KPI dashboard highlighting different financial metrics. The KPIs are quick and current ratio, cash balance, days sales outstanding etc. Present the topic in a bit more detail with this Performance KPI Dashboard Snapshot To Measure Financial Introduction To Corporate Financial Planning And Analysis. Use it as a tool for discussion and navigation on Quick Ratio, Current Ratio, Cash Balance. This template is free to edit as deemed fit for your organization. Therefore download it now.
-
 KPI Dashboard Snapshot Of Customer Service Delivery
This slide shows customer service delivery key performance indicators dashboard. It includes KPIs such as issues received, average time to close issues, first call resolution, top performers, etc. Introducing our KPI Dashboard Snapshot Of Customer Service Delivery set of slides. The topics discussed in these slides are Total Issues Received, Average Response Time, Issues By Channel. This is an immediately available PowerPoint presentation that can be conveniently customized. Download it and convince your audience.
-
 Dashboard Snapshot To Analyze City Ecological And Carbon Footprint
This slide illustrates the dashboard Snapshot to analyze ecological and carbon footprint of a city. The purpose of this template is to provide layout to analyze footprint data and define measures to protect environment. It includes metrics related to carbon emissions, usage of air, water and energy. Presenting our well structured Dashboard To Analyze City Ecological And Carbon Footprint. The topics discussed in this slide are Baseline Scenario, Behavioral Practices, Ecological And Carbon Footprint. This is an instantly available PowerPoint presentation that can be edited conveniently. Download it right away and captivate your audience.
-
 Internal Audit KPI Dashboard Snapshot And Status
This slide covers the key performance indicator dashboard snapshot and status for internal audit. It includes information related to the audit status and risk rating. Presenting our well structured Internal Audit KPI Dashboard And Status. The topics discussed in this slide are Auditable Entry, Risk Rating, Corrective Actions. This is an instantly available PowerPoint presentation that can be edited conveniently. Download it right away and captivate your audience.
-
 Dashboard Snapshot Depicting Procurement Cost Summary Report
This slide represents the procurement cost summary dashboard illustrating purchase order, cost reduction, savings, avoidance, return on investment, suppliers, procurement ROI etc. Presenting our well structured Dashboard Snapshot Depicting Procurement Cost Summary Report. The topics discussed in this slide are Purchase Order Cost, Cost Reduction, Cost Savings. This is an instantly available PowerPoint presentation that can be edited conveniently. Download it right away and captivate your audience.
-
 Business Expense Management With KPI Dashboard Snapshot
The following slide highlights the key metrics to assess the organizational expenses and meet financial goals. It includes KPIs such as quarterly and annual business expense details, expenditure breakdown etc. Presenting our well structured Business Expense Management With KPI DashboardSnapshot. The topics discussed in this slide are Annual Expenses, Expense Breakdown, Expense Details. This is an instantly available PowerPoint presentation that can be edited conveniently. Download it right away and captivate your audience.
-
 KPI Dashboard Snapshot Of Partnership Project Management
This slide shows project partnership management KPI dashboard. It includes key performance indicators such as planning, design, development, testing, workload, etc. Presenting our well structured KPI Dashboard Snapshot Of Partnership Project Management. The topics discussed in this slide are Planning, Design, Development, Testing, Overdue Task. This is an instantly available PowerPoint presentation that can be edited conveniently. Download it right away and captivate your audience.
-
 RPA Accelerator Executive KPI Dashboard Snapshot
This slide illustrates the KPI dashboard Snapshot for tracking automation program data. It also include metrics such as idea velocity, forecasted savings, benefits deployed, benefits in pipeline, etc. Introducing our RPA Accelerator Executive KPI Dashboard set of slides. The topics discussed in these slides are Forecasted Saving, Idea Velocity, Opportunities By Stage. This is an immediately available PowerPoint presentation that can be conveniently customized. Download it and convince your audience.
-
 Quality Key Performance Indicator Dashboard Snapshot For Procurement
This slide covers quality key performance indicator dashboard Snapshot for procurement process. It involves details such as supplier rating, rate of contract and average procurement cycle time. Presenting our well structured Quality Key Performance Indicator Dashboard For Procurement. The topics discussed in this slide are Supplier Details, Supplier Rating, Average Procurement Cycle Time. This is an instantly available PowerPoint presentation that can be edited conveniently. Download it right away and captivate your audience.
-
 Hotel Management System Dashboard Snapshot For Business Intelligence
This slide covers HMS dashboard. The purpose of this dashboard is to get an overview of hotel key metrics and to check financial status against targets. It includes elements such as reservations, check in guests, reservation type and housekeeping. Presenting our well structured Hotel Management System Dashboard Snapshot For Business Intelligence. The topics discussed in this slide are Hotel Management, System Dashboard, Business Intelligence. This is an instantly available PowerPoint presentation that can be edited conveniently. Download it right away and captivate your audience.
-
 Supplier Segmentation Dashboard Snapshot With Quality Trends Analysis
This slide defines the dashboard for analyzing the supplier segmentation along with the quality trends. It includes information related to the purchases, vendors and quality performance. Introducing our Supplier Segmentation Dashboard Snapshot With Quality Trends Analysis set of slides. The topics discussed in these slides are Purchase Value, Quality Performance, Product Wise Purchase Value. This is an immediately available PowerPoint presentation that can be conveniently customized. Download it and convince your audience.
-
 Effective Strategies For Retail Marketing Recent Trends And Snapshots Of Company
This slide highlights the insights of current traditional marketing campaign adopted by the company. It results in decline in customers, sales, and revenue. Deliver an outstanding presentation on the topic using this Effective Strategies For Retail Marketing Recent Trends And Snapshots Of Company. Dispense information and present a thorough explanation of Recent Trends, Snapshots Of Company, Forecasted Sales, Customers And Trends using the slides given. This template can be altered and personalized to fit your needs. It is also available for immediate download. So grab it now.
-
 Global Industrial Internet Of Things Market US Industrial Internet Of Things Market Snapshot
The following slide showcases overview of united state of Americas USA industrial internet of things sector. It provides details about growth drivers, government support, sensors, camera, industrial robotics, condition monitoring, etc. Deliver an outstanding presentation on the topic using this Global Industrial Internet Of Things Market US Industrial Internet Of Things Market Snapshot. Dispense information and present a thorough explanation of Sensors, Distributed Control Systems, Industrial Robotics, Condition Monitoring using the slides given. This template can be altered and personalized to fit your needs. It is also available for immediate download. So grab it now.
-
 Audience Demographic Analysis Snapshot Dashboard
This slide illustrates a snapshot of audience demographic analysis to make effective and efficient decision making. It includes elements such as gender, age, income, education and location. Introducing our Audience Demographic Analysis Snapshot Dashboard set of slides. The topics discussed in these slides are Analysis Snapshot Dashboard This is an immediately available PowerPoint presentation that can be conveniently customized. Download it and convince your audience.
-
 Dashboard Snapshot kpi for zero yield searches result searches presentation slide
Presenting dashboard snapshot kpi for zero yield searches result searches presentation slide. This presentation slide shows two Key Performance Indicators or KPIs in a Dashboard style design. The first KPI that can be shown is Percentage of Zero Yield Searches. The second KPI is Percentage of Zero Result Searches. These KPI Powerpoint graphics are all data driven, and the shape automatically adjusts according to your data. Just right click on the KPI graphic, enter the right value and the shape will adjust automatically. Make a visual impact with our KPI slides.
-
 Percentage dashboard snapshot kpi for canceled checkouts bounce rate powerpoint slide
Presenting percentage dashboard snapshot kpi for canceled checkouts bounce rate powerpoint slide. This presentation slide shows two Key Performance Indicators or KPIs in a Dashboard style design. The first KPI that can be shown is Percentage of Canceled Checkouts. The second KPI is Bounce Rate. These KPI Powerpoint graphics are all data driven, and the shape automatically adjusts according to your data. Just right click on the KPI graphic, enter the right value and the shape will adjust automatically. Make a visual impact with our KPI slides.
-
 Project Dashboard Snapshot With Kpi Status Risks Project Area Issues
Presenting this set of slides with name - Project Dashboard Snapshot With Kpi Status Risks Project Area Issues. This is a four stage process. The stages in this process are Project Review, Project Analysis, Project Performance management.
-
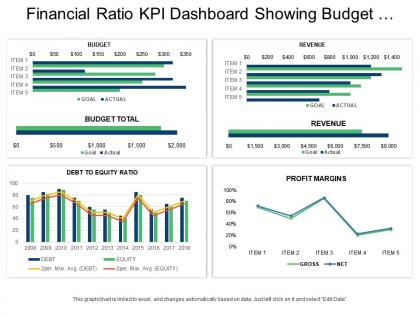 Financial ratio kpi dashboard snapshot showing budget revenue and profit margins
Presenting this set of slides with name - Financial Ratio Kpi Dashboard Snapshot Showing Budget Revenue And Profit Margins. This is a four stage process. The stages in this process are Accounting Ratio, Financial Statement, Financial Ratio.
-
 Financial ratio kpi dashboard snapshot showing delinquency charge offs and net worth ratio
Presenting this set of slides with name - Financial Ratio Kpi Dashboard Snapshot Showing Delinquency Charge Offs And Net Worth Ratio. This is a four stage process. The stages in this process are Accounting Ratio, Financial Statement, Financial Ratio.
-
 Financial ratio kpi dashboard snapshot showing liquidity ratio and profitability ratio
Presenting this set of slides with name - Financial Ratio Kpi Dashboard Snapshot Showing Liquidity Ratio And Profitability Ratio. This is a three stage process. The stages in this process are Accounting Ratio, Financial Statement, Financial Ratio.
-
 Marketing kpi dashboard snapshot showing lead funnel traffic sources key metrics
Presenting this set of slides with name - Marketing Kpi Dashboard Snapshot Showing Lead Funnel Traffic Sources Key Metrics. This is a three stage process. The stages in this process are Marketing, Branding, Promoting.
-
 Quality control kpi dashboard snapshot showing data quality
Presenting this set of slides with name - Quality Control Kpi Dashboard Snapshot Showing Data Quality. This is a six stage process. The stages in this process are Quality Management, Quality Control, Quality Assurance.
-
 Call center kpi dashboard snapshot showing key metrics customer satisfaction
Introducing call center kpi dashboard snapshot showing key metrics customer satisfaction presentation template. Slide designs quality does not deflect when opened on a wide screen show. Inconvenience free fuse of tweaked shading, content and illustrations. Slide incorporates instructional slides to give direction to change the graphical substance. Spare the presentation graphics in JPG or PDF organize. Successfully valuable for the systems administration experts, mediators and the procedure architects, it administrators, data innovation firms. Format slide with various stages or hubs are accessible. Simplicity of download.
-
 Maintenance kpi dashboard snapshot showing estimates awaiting approval
Presenting maintenance KPI dashboard snapshot showing estimates awaiting approval PPT slide. This layout is fully compatible with Google slides and data driven. User can edit the data in linked excel sheet and the design will change accordingly. Easy to put in company logo, trademark or name; accommodate words to support the key points. Images do no distort out even when they are projected on large screen. Adjust colors, text and fonts as per your business requirements.
-
 Project Status Kpi Dashboard Snapshot Showing Completed Tasks And Task In Progress
Presenting, project status kpi dashboard snapshot showing completed tasks and task in progress. This PowerPoint slide can be used by businesses experts for their business performance related presentations. The topics and the similar data shown in the flat design can be easily edited in terms of color, text, and fonts by just by heeding few steps. The color and orientation of the elements can also be changed easily. These PPT slides are cooperative with google slides.
-
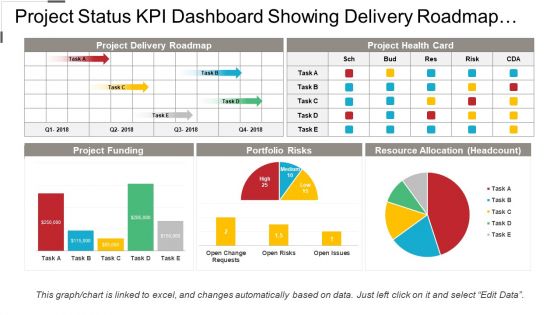 Project status kpi dashboard snapshot showing delivery roadmap and resource allocation
Presenting project status KPI dashboard snapshot showing delivery roadmap and resource allocation. Simple data input with linked Excel chart, just right click to input values. This PowerPoint theme is fully supported by Google slides. Picture quality of these slides does not change even when project on large screen. Fast downloading speed and formats can be easily changed to JPEG and PDF applications. This template is suitable for marketing, sales persons, business managers and entrepreneurs. Adjust PPT layout, font, text and color as per your necessity.
-
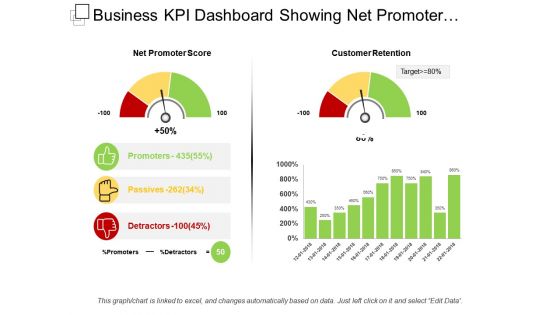 Business kpi dashboard snapshot showing net promoter score
Presenting this set of slides with name - Business Kpi Dashboard Snapshot Showing Net Promoter Score. This is a two stage process. The stages in this process are Business Dashboard, Business Kpi, Business Performance.
-
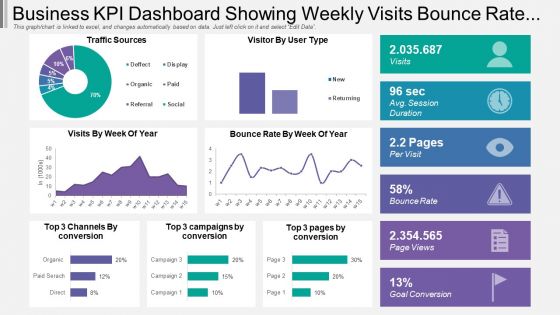 Business Kpi Dashboard Snapshot Showing Weekly Visits Bounce Rate And Traffic Source
Presentation graphic is totally compatible with Google slides. Multiple display options i.e. standard and widescreen. 100 percent editable designs to show your creativity. Similar designs available with different nodes and stages. Easy to download and convert into JPEG or PDF format. Alteration can be done in color, text and shape. Pre-designed PPT slide just download and insert it in the presentation. Quick download with easy to save. Choice to add company logo and replace text as required. High resolution quality ensures no pixilation.
-
 Hr dashboard snapshot recruitment performance key metrics
Presenting this set of slides with name - Hr Dashboard Snapshot Recruitment Performance Key Metrics. This is a four stage process. The stages in this process are Hr Dashboard, Human Resource Dashboard, Hr Kpi.
-
 Quality dashboard snapshot showing customer product data with data quality
SlideTeam feels immense pleasure in presenting to you its 100% customizable and user-friendly quality dashboard snapshot showing customer data with data quality. The business slides can be viewed in widescreen display ratio of 16:9 or standard size display ratio of 4:3 after being downloaded. The PPT presentation lets you insert or remove any given feature from the redesigned set of slides. You can also save the slideshow in format of PDF or JPG and also it is compatible with Google Slides. So hit download, edit it and present it.
-
 Executing reporting kpi dashboard snapshot showing income sales by product vendor expenses
Presenting this set of slides with name - Executing Reporting Kpi Dashboard Snapshot Showing Income Sales By Product Vendor Expenses. This is a four stage process. The stages in this process are Executive Reporting, Executive Analysis, Executive Performance.
-
 Professional and technical services kpi dashboard snapshot showing timesheet
Presenting this set of slides with name - Professional And Technical Services Kpi Dashboard Snapshot Showing Timesheet. This is a four stage process. The stages in this process are Professional And Technical Services, Services Management, Technical Management.
-
 Education and research kpi dashboard snapshot showing enrolment and sap
Presenting education and research KPI dashboard snapshot showing enrolment and SAP PPT slide. The enrolment and SAP analytic KPI dashboard PowerPoint template designed by the professional team of SlideTeam. The SAP package KPI report slide is fully editable in PowerPoint. The research SAP dashboard presentation slide is compatible with Google Slide so a user can share this SAP analytic dashboard slide with others. A user can make changes in the font size, font type, color as well as dimensions of the SAP analytics cloud business content dashboard PowerPoint template as per the requirement.
-
 Education and research kpi dashboard snapshot showing enrolment breakdown
Presenting education and research KPI dashboard snapshot showing enrolment breakdown PPT slide. The student enrolment dashboard PowerPoint slide designed by the professional team of SlideTeam. The enrolment page KPI report template is fully editable in PowerPoint. The research enrolment KPI report PPT template is compatible with Google Slide so a user can share this enrolment dashboard slide with others. A user can make changes in the font size, font type, color as well as dimensions of the campus and college dashboard slide as per the requirement. You may edit the value in the enrollment reporting system dashboard template as the slide gets linked with the Excel sheet.
-
 Education and research kpi dashboard Snapshot showing research outputs and amount
Presenting education and research KPI dashboard snapshot showing research outputs and amount PPT slide. The research data metric presentation slide designed by professional team of SlideTeam. The education and research report PPT slide is 100% customizable in PowerPoint. The research amount KPI dashboard slide is also compatible with Google Slide so a user can share this slide with others. A user can make changes in the font size, font type, color as well as dimensions of the research key measure PPT template as per the requirement. You may edit the value in the research key measure PPT template as the slide gets linked with the Excel sheet.
-
 Business performance dashboards snapshot with accounts and mrr growth
Presenting, our business performance dashboards snapshot with accounts and mr growth PPT layout. High pixel resolution of the designs. Easy to edit and save using google slides. 100% modification of the slides granted. Apply your company name, replacing the official trademark in the slides. Valuable for the Marketing Professionals, business managers, and the directors. Includes extensive text spaces to include a title and can be easily projected to a widescreen.
-
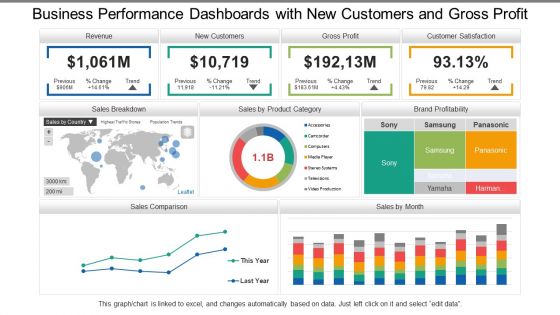 Business Performance Dashboards Snapshot With New Customers And Gross Profit
Presenting, business performance dashboards Snapshot with new customers and gross profit PowerPoint ideas for your ease. Information based slides, creating an impact on the viewer, can be used by specialists from any background, entrepreneurs, and scholars. Engaging and editable font style, type, text design and the content of the icons or the PPT slides. Full-screen view choice available and can be transformed into the desired format. Compatible with Google Slides. Open in widescreen size 16:9 after downloading.
-
 Transportation kpi dashboard snapshot showing fleet delivery status loading time and weight
Presenting transportation KPI dashboard snapshot showing fleet delivery status loading time and weight PPT slide. Simple data input with linked Excel chart, just right click to input values. This PowerPoint theme is fully supported by Google slides. Picture quality of these slides does not change even when project on large screen. Fast downloading speed and formats can be easily changed to JPEG and PDF applications. This template is suitable for marketing, sales persons, business managers and entrepreneurs.
-
 Transportation kpi dashboard snapshot showing revenue costs profit fleet status
Presenting KPI dashboard snapshot showing revenue costs profit fleet status slideshow. Change PowerPoint structure, font, text, color and design as per your requirements. Easy to input data with excel linked charts, just right to click to input data. This presentation theme is totally attuned with Google slides. Easy conversion to other software’s like JPG and PDF formats. Image quality of these PPT diagram remains the unchanged even when you resize the image or portray on large screens.
-
 Transportation kpi dashboard snapshot showing shipments ground vs air channel
Presenting our transportation KPI dashboard snapshot showing shipments ground vs. air channel PPT slide. This layout is compatible with Google slides and data can be updated with excel linked file. This template is Excel linked just right click to input your information. Images do no blur out even when they are projected on large screen.PPT template can be utilized by sales and marketing teams and business managers. Instantly downloadable slide and supports formats like JPEG and PDF.


