Powerpoint Templates and Google slides for Showing
Save Your Time and attract your audience with our fully editable PPT Templates and Slides.
-
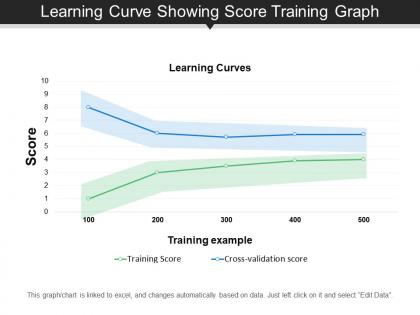 Learning curve showing score training graph
Presenting this set of slides with name - Learning Curve Showing Score Training Graph. This is a two stage process. The stages in this process are Experience Curve, Learning Curve.
-
 Mentoring program showing business man guiding his college
Presenting this set of slides with name - Mentoring Program Showing Business Man Guiding His College. This is a two stage process. The stages in this process are Mentoring Program, Advising Program, Guiding Program.
-
 Mentoring program showing coach or mentor with his student
Presenting this set of slides with name - Mentoring Program Showing Coach Or Mentor With His Student. This is a two stage process. The stages in this process are Mentoring Program, Advising Program, Guiding Program.
-
 Mentoring program showing group of colleagues working on
Presenting this set of slides with name - Mentoring Program Showing Group Of Colleagues Working On. This is a two stage process. The stages in this process are Mentoring Program, Advising Program, Guiding Program.
-
 Mentoring program showing man holding business card
Presenting this set of slides with name - Mentoring Program Showing Man Holding Business Card. This is a one stage process. The stages in this process are Mentoring Program, Advising Program, Guiding Program.
-
 Mentoring program showing meeting of colleagues presenting and taking notes
Presenting this set of slides with name - Mentoring Program Showing Meeting Of Colleagues Presenting And Taking Notes. This is a two stage process. The stages in this process are Mentoring Program, Advising Program, Guiding Program.
-
 Mentoring program showing two entrepreneurs joining hands or doing high five
Presenting this set of slides with name - Mentoring Program Showing Two Entrepreneurs Joining Hands Or Doing High Five. This is a two stage process. The stages in this process are Mentoring Program, Advising Program, Guiding Program.
-
 Mentoring program showing view of conference hall with man addressing the audience
Presenting this set of slides with name - Mentoring Program Showing View Of Conference Hall With Man Addressing The Audience. This is a three stage process. The stages in this process are Mentoring Program, Advising Program, Guiding Program.
-
 Mentoring program showing view of conference or public speaking
Presenting this set of slides with name - Mentoring Program Showing View Of Conference Or Public Speaking. This is a three stage process. The stages in this process are Mentoring Program, Advising Program, Guiding Program.
-
 Mentoring program showing view of discussion room with group of people
Presenting this set of slides with name - Mentoring Program Showing View Of Discussion Room With Group Of People. This is a three stage process. The stages in this process are Mentoring Program, Advising Program, Guiding Program.
-
 All hands meeting showing ethnicity
Presenting this set of slides with name - All Hands Meeting Showing Ethnicity. This is a three stage process. The stages in this process are All Hands Meeting, Unity, Group.
-
 All hands meeting showing unity
Presenting this set of slides with name - All Hands Meeting Showing Unity. This is a four stage process. The stages in this process are All Hands Meeting, Unity, Group.
-
 People showing unity by joining and meeting all hands
Presenting this set of slides with name - People Showing Unity By Joining And Meeting All Hands. This is a six stage process. The stages in this process are All Hands Meeting, Unity, Group.
-
 Learning organization showing discussion business collaboration
Presenting this set of slides with name - Learning Organization Showing Discussion Business Collaboration. This is a two stage process. The stages in this process are Knowledge Management, Learning Organization, Training Organization.
-
 Hands holding puzzle pieces showing partnership image
Presenting this set of slides with name - Hands Holding Puzzle Pieces Showing Partnership Image. This is a two stage process. The stages in this process are Relationship, Partnership, Handshake.
-
 Handshake showing partnership deal image
Presenting this set of slides with name - Handshake Showing Partnership Deal Image. This is a two stage process. The stages in this process are Relationship, Partnership, Handshake.
-
 Handshake showing partnership with building background image
Presenting this set of slides with name - Handshake Showing Partnership With Building Background Image. This is a two stage process. The stages in this process are Relationship, Partnership, Handshake.
-
 Transportation kpi dashboard showing cost and on time final delivery
Presenting transportation KPI dashboard showing cost and on time final delivery PPT slide. This deck offers you plenty of space to put in titles and sub titles. This template is Excel linked just right click to input your information. High resolution based layout, does not change the image even after resizing. This presentation icon is fully compatible with Google slides. Quick downloading speed and simple editing options in color text and fonts.PPT icons can easily be changed into JPEG and PDF applications.
-
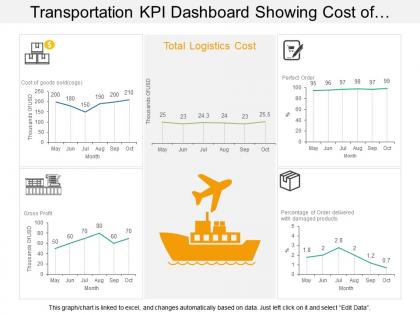 Transportation kpi dashboard showing cost of good sold logistics cost and gross profit
Presenting KPI dashboard showing cost of goods sold logistics cost and gross profit PPT slide. This layout is fully compatible with Google slides and data driven. User can edit the data in linked excel sheet and graphs and charts gets customized accordingly. Easy to put in company logo, trademark or name; accommodate words to support the key points. Images do no distort out even when they are projected on large screen. Adjust colors, text and fonts as per your business requirements
-
 Transportation kpi dashboard snapshot showing fleet delivery status loading time and weight
Presenting transportation KPI dashboard snapshot showing fleet delivery status loading time and weight PPT slide. Simple data input with linked Excel chart, just right click to input values. This PowerPoint theme is fully supported by Google slides. Picture quality of these slides does not change even when project on large screen. Fast downloading speed and formats can be easily changed to JPEG and PDF applications. This template is suitable for marketing, sales persons, business managers and entrepreneurs.
-
 Transportation kpi dashboard showing maintenance cost insurance cost available fleet
Presenting transportation KPI dashboard showing maintenance cost insurance cost available fleet PowerPoint slide. Simple data input with linked Excel chart, just right click to input values. This PowerPoint theme is fully supported by Google slides. Picture quality of these slides does not change even when project on large screen. Fast downloading speed and formats can be easily changed to JPEG and PDF applications. This template is suitable for marketing, sales persons, business managers and entrepreneurs. Adjust PPT layout, font, text and color as per your necessity.
-
 Transportation kpi dashboard snapshot showing revenue costs profit fleet status
Presenting KPI dashboard snapshot showing revenue costs profit fleet status slideshow. Change PowerPoint structure, font, text, color and design as per your requirements. Easy to input data with excel linked charts, just right to click to input data. This presentation theme is totally attuned with Google slides. Easy conversion to other software’s like JPG and PDF formats. Image quality of these PPT diagram remains the unchanged even when you resize the image or portray on large screens.
-
 Transportation kpi dashboard showing shipments by country and transit time
Presenting transportation KPI Dashboard showing shipments by country and transit time PPT slide. This deck offers you plenty of space to put in titles and subtitles. This template is Excel linked just right click to input your information. High resolution based layout, does not change the image even after resizing. This presentation icon is fully compatible with Google slides. Quick downloading speed and simple editing options in color text and fonts.PPT icons can easily be changed into JPEG and PDF applications
-
 Transportation kpi dashboard snapshot showing shipments ground vs air channel
Presenting our transportation KPI dashboard snapshot showing shipments ground vs. air channel PPT slide. This layout is compatible with Google slides and data can be updated with excel linked file. This template is Excel linked just right click to input your information. Images do no blur out even when they are projected on large screen.PPT template can be utilized by sales and marketing teams and business managers. Instantly downloadable slide and supports formats like JPEG and PDF.
-
 Transportation kpi dashboard showing shipping revenue and outbound shipping costs
Presenting transportation KPI dashboard showing shipping revenue and outbound shipping costs PPT slide. Simple data input like company logo, name or trademark. User can edit the data in linked excel sheet and graphs and charts gets customized accordingly .This PPT slide offers you plenty of space to put in titles and sub titles. High resolution based presentation layout, does not change the image even after resizing. This presentation icon is data driven and template can be downloaded via excel file to incorporate data.
-
 Transportation kpi dashboard snapshot showing warehouse operating cost distribution
Presenting transportation KPI dashboard snapshot showing warehouse operating cost distribution PPT slide. Simple data input like company logo, name or trademark. User can edit the data in linked excel sheet and graphs and charts gets customized accordingly. Picture quality of these slides does not change even when project on large screen. Fast downloading speed and formats can be easily changed to JPEG and PDF applications. This template is suitable for marketing, sales persons, business managers and entrepreneurs.
-
 Transportation kpi dashboard showing warehouse operating costs perfect order rate
Presenting transportation KPI dashboard showing warehouse operating costs perfect order rate PPT slide. This layout is fully compatible with Google slides and data driven. User can edit the data in linked excel sheet and graphs and charts gets customized accordingly. Easy to put in company logo, trademark or name; accommodate words to support the key points. Images do no distort out even when they are projected on large screen. Adjust colors, text and fonts as per your business requirements.
-
 Banking kpi dashboard showing accounts expenditures fundings
Presenting this set of slides with name - Banking Kpi Dashboard Showing Accounts Expenditures Fundings. This is a three stage process. The stages in this process are Banking, Finance, Money.
-
 Banking kpi dashboard showing income mix and loan spread
Presenting this set of slides with name - Banking Kpi Dashboard Showing Income Mix And Loan Spread. This is a four stage process. The stages in this process are Banking, Finance, Money.
-
 Banking kpi dashboard showing lead conversion and acquisition cost
Presenting this set of slides with name - Banking Kpi Dashboard Showing Lead Conversion And Acquisition Cost. This is a five stage process. The stages in this process are Banking, Finance, Money.
-
 Banking kpi dashboard showing personal checking and debit card penetration
Presenting this set of slides with name - Banking Kpi Dashboard Showing Personal Checking And Debit Card Penetration. This is a two stage process. The stages in this process are Banking, Finance, Money.
-
 Banking kpi dashboard showing profit revenue transaction size
Presenting this set of slides with name - Banking Kpi Dashboard Showing Profit Revenue Transaction Size. This is a five stage process. The stages in this process are Banking, Finance, Money.
-
 Banking kpi dashboard showing revenue vs expenses and returns
Presenting this set of slides with name - Banking Kpi Dashboard Showing Revenue Vs Expenses And Returns. This is a five stage process. The stages in this process are Banking, Finance, Money.
-
 Banking kpi dashboard showing sales funnel and overall revenue
Presenting this set of slides with name - Banking Kpi Dashboard Showing Sales Funnel And Overall Revenue. This is a six stage process. The stages in this process are Banking, Finance, Money.
-
 Banking kpi dashboard showing top contacts and client value
Presenting this set of slides with name - Banking Kpi Dashboard Showing Top Contacts And Client Value. This is a three stage process. The stages in this process are Banking, Finance, Money.
-
 Devops kpi dashboard showing activity by application and errors by app
Presenting this set of slides with name - Devops Kpi Dashboard Showing Activity By Application And Errors By App. This is a six stage process. The stages in this process are Development And Operations, Devops.
-
 Devops kpi dashboard showing api and site response time
Presenting this set of slides with name - Devops Kpi Dashboard Showing Api And Site Response Time. This is a four stage process. The stages in this process are Development And Operations, Devops.
-
 Devops kpi dashboard showing api status and uptime
Presenting this set of slides with name - Devops Kpi Dashboard Showing Api Status And Uptime. This is a four stage process. The stages in this process are Development And Operations, Devops.
-
 Devops kpi dashboard showing build and quality health
Presenting this set of slides with name - Devops Kpi Dashboard Showing Build And Quality Health. This is a four stage process. The stages in this process are Development And Operations, Devops.
-
 Devops kpi dashboard showing builds per day and code repo
Presenting this set of slides with name - Devops Kpi Dashboard Showing Builds Per Day And Code Repo. This is a three stage process. The stages in this process are Development And Operations, Devops.
-
 Devops kpi dashboard showing commits and defective files
Presenting this set of slides with name - Devops Kpi Dashboard Showing Commits And Defective Files. This is a six stage process. The stages in this process are Development And Operations, Devops.
-
 Devops kpi dashboard showing mean time to recover
Presenting this set of slides with name - Devops Kpi Dashboard Showing Mean Time To Recover. This is a six stage process. The stages in this process are Development And Operations, Devops.
-
 Devops kpi dashboard showing public interface and project burndown
Presenting this set of slides with name - Devops Kpi Dashboard Showing Public Interface And Project Burndown. This is a four stage process. The stages in this process are Development And Operations, Devops.
-
 Devops kpi dashboard showing runbook execution and command execution
Presenting this set of slides with name - Devops Kpi Dashboard Showing Runbook Execution And Command Execution. This is a six stage process. The stages in this process are Development And Operations, Devops.
-
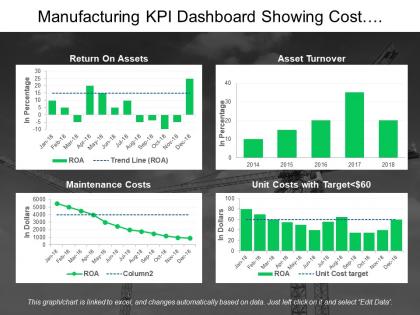 Manufacturing kpi dashboard showing cost management and asset turnover
Presenting this set of slides with name - Manufacturing Kpi Dashboard Showing Cost Management And Asset Turnover. This is a four stage process. The stages in this process are Manufacturing, Production, Manufacture.
-
 Manufacturing kpi dashboard showing defect density and rate of return
Presenting this set of slides with name - Manufacturing Kpi Dashboard Showing Defect Density And Rate Of Return. This is a four stage process. The stages in this process are Manufacturing, Production, Manufacture.
-
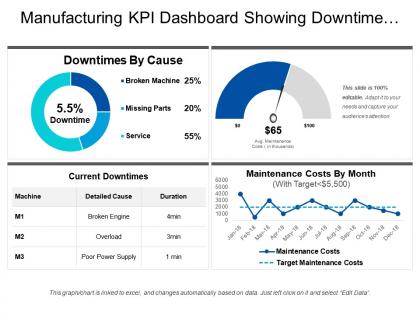 Manufacturing kpi dashboard showing downtime by cause and current downtimes
Presenting this set of slides with name - Manufacturing Kpi Dashboard Showing Downtime By Cause And Current Downtimes. This is a four stage process. The stages in this process are Manufacturing, Production, Manufacture.
-
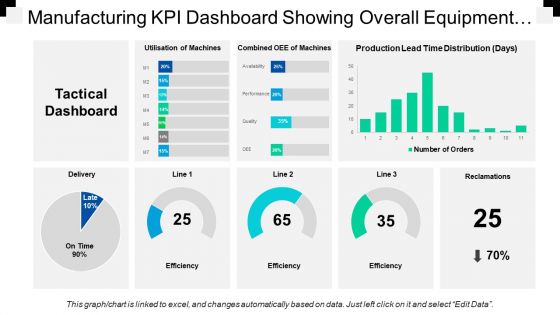 Manufacturing kpi dashboard showing overall equipment effectiveness
Presenting this set of slides with name - Manufacturing Kpi Dashboard Showing Overall Equipment Effectiveness. This is a eight stage process. The stages in this process are Manufacturing, Production, Manufacture.
-
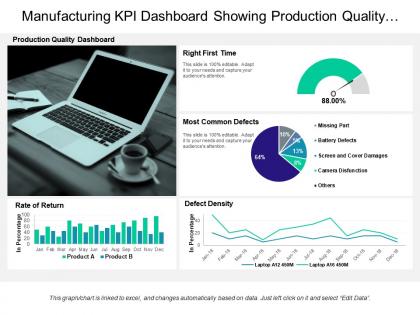 Manufacturing kpi dashboard showing production quality and defect density
Presenting this set of slides with name - Manufacturing Kpi Dashboard Showing Production Quality And Defect Density. This is a four stage process. The stages in this process are Manufacturing, Production, Manufacture.
-
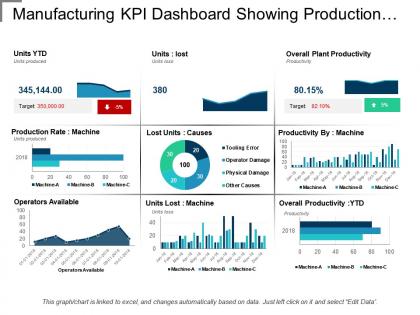 Manufacturing kpi dashboard showing production rate and lost units
Presenting manufacturing KPI dashboard showing production rate and lost units. This layout is compatible with Google slides and data can be updated with excel linked file. Easy to put in company logo, trademark or name; accommodate words to support the key points. Images do no blur out even when they are projected on large screen.PPT template can be utilized by sales and marketing teams and business managers. Instantly downloadable slide and supports formats like JPEG and PDF.
-
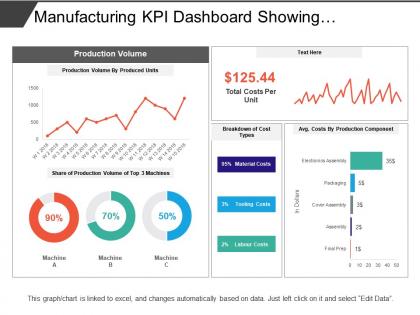 Manufacturing kpi dashboard showing production volume and cost breakdown
Presenting this set of slides with name - Manufacturing Kpi Dashboard Showing Production Volume And Cost Breakdown. This is a four stage process. The stages in this process are Manufacturing, Production, Manufacture.
-
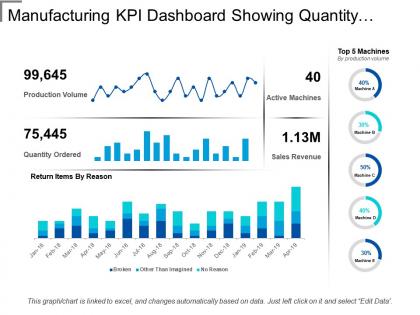 Manufacturing kpi dashboard showing quantity ordered and active machines
Presenting this set of slides with name - Manufacturing Kpi Dashboard Showing Quantity Ordered And Active Machines. This is a four stage process. The stages in this process are Manufacturing, Production, Manufacture.
-
 Technology kpi dashboard showing app users and disk usage
Presenting this set of slides with name - Technology Kpi Dashboard Showing App Users And Disk Usage. This is a nine stage process. The stages in this process are Technology, IT, IOT.
-
 Technology kpi dashboard showing application and compute availability
Presenting this set of slides with name - Technology Kpi Dashboard Showing Application And Compute Availability. This is a seven stage process. The stages in this process are Technology, IT, IOT.
-
 Technology kpi dashboard showing defects by type and severity
Presenting this set of slides with name - Technology Kpi Dashboard Showing Defects By Type And Severity. This is a six stage process. The stages in this process are Technology, IT, IOT.
-
 Technology kpi dashboard showing network activities and device usage
Introducing Technology KPI dashboard showing network activities PPT design. Quick download and simple to convert into JPEG and PDF document. High quality presentation slide comes with editing options as color, text and font can be edited at any stage. Preference to display PowerPoint template in standard and widescreen display view. Presentation graphic is accessible with different nodes and stages. Easy to present with large audience. Amend the design with corporate name and icon.
-
 Technology kpi dashboard showing new product release
Delivering technology KPI dashboard new product release PowerPoint design. Presentation template goes well with Google slides. PPT slide is adaptable with maximum number of software i.e. JPG and PDF. Great picture quality PowerPoint graphic comes with high resolution picture as pixels never break even on wide screen. Choice includes business information such as name, logo and tagline. Fully amendable Presentation diagram comes with editable options. PPT design is easy to download and save for later use.
-
 Technology kpi dashboard showing percent availability and performance
Displaying Technology KPI dashboard percent availability PowerPoint design. Colors and text can be easily changed as the PPT slide is completely editable. Modify the design with brand name and logo. Presentation diagram is available both Standard and Widescreen slide. Fast and easy download with saving options. Adaptable with other software’s such as PDF or JPG formats. PowerPoint graphic is fully compatible with Google slides as can be merged with them accordingly.
-
 Technology kpi dashboard showing servers online backup and city monitor
Sharing technology KPI dashboard server’s online backup presentation template.PPT design is adjustable with Google slides. Quick to download and can be shared into JPG and PDF format. Fully amendable as color, text and font as elements can be modified. Sharing can be possible on both standard and widescreen. Matching designs are available with different nodes and stages. Ready to use PowerPoint slide are compatible with Google slides and can be merged easily.
-
 Technology kpi dashboard snapshot showing site visitors and server control panel
Showcasing technology KPI dashboard presentation slide that comes with editing options. PowerPoint design can be downloaded with different nodes and stages. Completely modifiable design as fonts, text, colors can be edited. Customize the presentation by adding trade information i.e. name, logo, icon and tagline. Simple and fast download. Easy convert into PDF or JPG formats. Works well with Google slides. PPT template is easy to share among large set of audience.


