Powerpoint Templates and Google slides for Segment
Save Your Time and attract your audience with our fully editable PPT Templates and Slides.
-
 Asahi group holdings ltd statistic 1 alcohol beverages business segment
This is a professionally designed visual chart for Asahi Group Holdings Ltd Statistic 1 Alcohol Beverages Business Segment. This is part of our Data and Statistics products selection, and you will need a Paid account to download the actual report with accurate data and sources. Downloaded report will contain the editable graph with accurate data, an excel table with the actual data, the exact source of the data and the release date. This slide provides a graph of revenue split of Alcohol Beverages Business Segment by container type bottle, can, keg of Asahi Group Holdings, Ltd for the years 2014 to 18. Download it immediately and use it for your business.
-
 Asahi group holdings ltd statistic 1 food business segment
This is a professionally designed visual chart for Asahi Group Holdings Ltd Statistic 1 Food Business Segment. This is part of our Data and Statistics products selection, and you will need a Paid account to download the actual report with accurate data and sources. Downloaded report will contain the editable graph with accurate data, an excel table with the actual data, the exact source of the data and the release date. This slide provides the graph of market share candy tablet market, baby food market, instant miso soup of Asahi Group Holdings, Ltd in Japanese market for the year 2018. Download it immediately and use it for your business.
-
 Asahi group holdings ltd statistic 2 alcohol beverages business segment
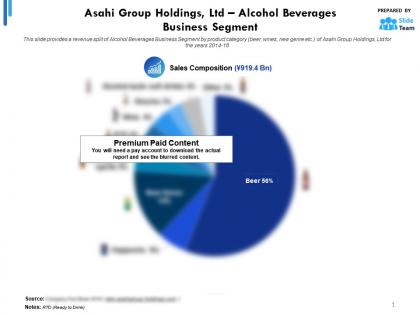
This is a professionally designed visual chart for Asahi Group Holdings Ltd Statistic 2 Alcohol Beverages Business Segment. This is part of our Data and Statistics products selection, and you will need a Paid account to download the actual report with accurate data and sources. Downloaded report will contain the editable graph with accurate data, an excel table with the actual data, the exact source of the data and the release date. This slide provides a revenue split of Alcohol Beverages Business Segment by product category beer, wines, new genre etc. of Asahi Group Holdings, Ltd for the years 2014 to 18. Download it immediately and use it for your business.
-
 Asahi group holdings ltd statistic 2 food business segment
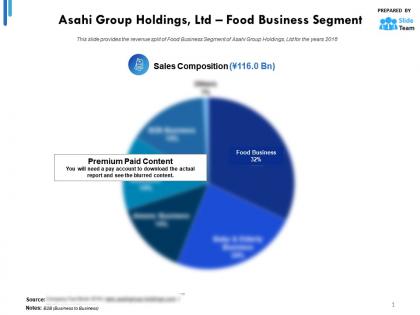
This is a professionally designed visual chart for Asahi Group Holdings Ltd Statistic 2 Food Business Segment. This is part of our Data and Statistics products selection, and you will need a Paid account to download the actual report with accurate data and sources. Downloaded report will contain the editable graph with accurate data, an excel table with the actual data, the exact source of the data and the release date. Asahi Group Holdings Ltd Statistic 3 Food Business Segment This slide provides the revenue split of Food Business Segment of Asahi Group Holdings, Ltd for the years 2018. Download it immediately and use it for your business.
-
 Asahi group holdings ltd statistic 3 alcohol beverages business segment
This is a professionally designed visual chart for Asahi Group Holdings Ltd Statistic 3 Alcohol Beverages Business Segment. This is part of our Data and Statistics products selection, and you will need a Paid account to download the actual report with accurate data and sources. Downloaded report will contain the editable graph with accurate data, an excel table with the actual data, the exact source of the data and the release date. This slide provides a graph of revenue in JPY Bn and core operating profit margin of Alcohol Beverages Business Segment of Asahi Group Holdings, Ltd for the years 2014 to 18. Download it immediately and use it for your business.
-
 Asahi group holdings ltd statistic 3 food business segment
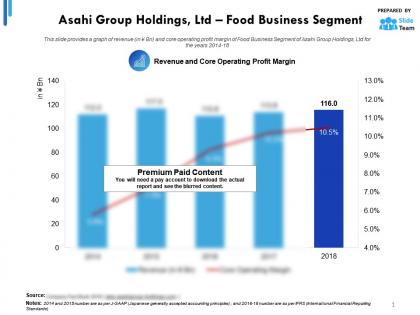
This is a professionally designed visual chart for Asahi Group Holdings Ltd Statistic 3 Food Business Segment. This is part of our Data and Statistics products selection, and you will need a Paid account to download the actual report with accurate data and sources. Downloaded report will contain the editable graph with accurate data, an excel table with the actual data, the exact source of the data and the release date. This slide provides a graph of revenue in JPY Bn and core operating profit margin of Food Business Segment of Asahi Group Holdings, Ltd for the years 2014 to 18. Download it immediately and use it for your business.
-
 Asahi group holdings ltd operating profit by business segments 2016-2018
This is a professionally designed visual chart for Asahi Group Holdings Ltd Operating Profit By Business Segments 2016 to 2018. This is part of our Data and Statistics products selection, and you will need a Paid account to download the actual report with accurate data and sources. Downloaded report will contain the editable graph with accurate data, an excel table with the actual data, the exact source of the data and the release date. This slide provides a graph of operating Income of business segments Alcohol beverages, Soft Drinks, Food, and Overseas of Asahi Group Holdings, Ltd for the years 2016 to 18. Download it immediately and use it for your business.
-
 Asahi group holdings ltd overseas business segment southeast asia business
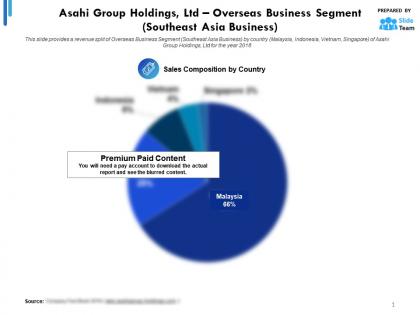
This is a professionally designed visual chart for Asahi Group Holdings Ltd Overseas Business Segment Southeast Asia Business. This is part of our Data and Statistics products selection, and you will need a Paid account to download the actual report with accurate data and sources. Downloaded report will contain the editable graph with accurate data, an excel table with the actual data, the exact source of the data and the release date. This slide provides a revenue split of Overseas Business Segment Southeast Asia Business by country Malaysia, Indonesia, Vietnam, Singapore of Asahi Group Holdings, Ltd for the year 2018. Download it immediately and use it for your business.
-
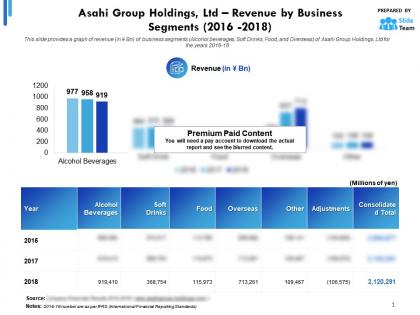 Asahi group holdings ltd revenue by business segments 2016-2018
This is a professionally designed visual chart for Asahi Group Holdings Ltd Revenue By Business Segments 2016 to 2018. This is part of our Data and Statistics products selection, and you will need a Paid account to download the actual report with accurate data and sources. Downloaded report will contain the editable graph with accurate data, an excel table with the actual data, the exact source of the data and the release date. This slide provides a graph of revenue in JPY Bn of business segments Alcohol beverages, Soft Drinks, Food and Overseas of Asahi Group Holdings, Ltd for the years 2016 to 18. Download it immediately and use it for your business.
-
 Asahi group holdings ltd soft drinks business segment
This is a professionally designed visual chart for Asahi Group Holdings Ltd Soft Drinks Business Segment. This is part of our Data and Statistics products selection, and you will need a Paid account to download the actual report with accurate data and sources. Downloaded report will contain the editable graph with accurate data, an excel table with the actual data, the exact source of the data and the release date. This slide provides a sales volume of Soft Drinks Business Segment by container type Can, PET bottles, Glass Bottles etc. of Asahi Group Holdings, Ltd for the years 2014 to 18. Download it immediately and use it for your business.
-
 Asahi group holdings ltd statistic 1 soft drinks business segment
This is a professionally designed visual chart for Asahi Group Holdings Ltd Statistic 1 Soft Drinks Business Segment. This is part of our Data and Statistics products selection, and you will need a Paid account to download the actual report with accurate data and sources. Downloaded report will contain the editable graph with accurate data, an excel table with the actual data, the exact source of the data and the release date. This slide provides a sales volume of Soft Drinks Business Segment by marketing channel vending machines, Convenience stores, supermarkets etc. of Asahi Group Holdings, Ltd for the years 2014 to 18. Download it immediately and use it for your business.
-
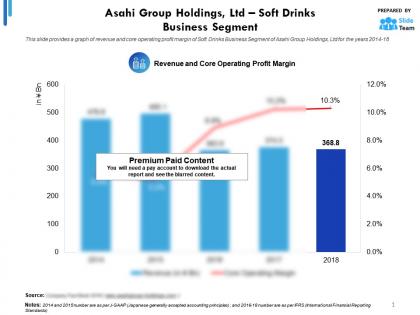 Asahi group holdings ltd statistic 2 soft drinks business segment
This is a professionally designed visual chart for Asahi Group Holdings Ltd Statistic 2 Soft Drinks Business Segment. This is part of our Data and Statistics products selection, and you will need a Paid account to download the actual report with accurate data and sources. Downloaded report will contain the editable graph with accurate data, an excel table with the actual data, the exact source of the data and the release date. This slide provides a graph of revenue and core operating profit margin of Soft Drinks Business Segment of Asahi Group Holdings, Ltd for the years 2014 to 18. Download it immediately and use it for your business.
-
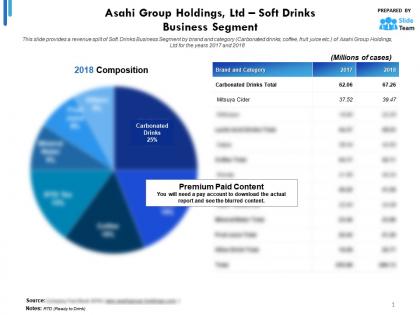 Asahi group holdings ltd statistic 3 soft drinks business segment
This is a professionally designed visual chart for Asahi Group Holdings Ltd Statistic 3 Soft Drinks Business Segment. This is part of our Data and Statistics products selection, and you will need a Paid account to download the actual report with accurate data and sources. Downloaded report will contain the editable graph with accurate data, an excel table with the actual data, the exact source of the data and the release date. This slide provides a revenue split of Soft Drinks Business Segment by brand and category Carbonated drinks, coffee, fruit juice etc. of Asahi Group Holdings, Ltd for the years 2017 to 2018. Download it immediately and use it for your business.
-
 Cott corporation gross profit split by segment 2017-2018
This is a professionally designed visual chart for Cott Corporation Gross Profit Split By Segment 2017 to 2018. This is part of our Data and Statistics products selection, and you will need a Paid account to download the actual report with accurate data. Downloaded report will contain the editable graph with accurate data, an excel table with the actual data, the exact source of the data and the release date. This slide shows the Gross Profit Split by Segments of Cott Corporation for the years 2017 to 2018. Download it immediately and use it for your business.
-
 Cott corporation revenue by reporting segment 2017-2018
This is a professionally designed visual chart for Cott Corporation Revenue By Reporting Segment 2017 to 2018. This is part of our Data and Statistics products selection, and you will need a Paid account to download the actual report with accurate data. Downloaded report will contain the editable graph with accurate data, an excel table with the actual data, the exact source of the data and the release date. This slide shows the Revenue Split by Segment of Cott Corporation for the years 2017 to 2018. Download it immediately and use it for your business.
-
 Bmw group automotive segment deliveries 2014-18
This is a professionally designed visual chart for BMW Group Automotive Segment Deliveries 2014 to 18. This is part of our Data and Statistics products selection, and you will need a Paid account to download the actual report with accurate data and sources. Downloaded report will contain the editable graph with accurate data, an excel table with the actual data, the exact source of the data and the release date. This slide provides a graph of Automotive Segment Deliveries in millions of the company BMW Group from the years 2014 to 18. Download it immediately and use it for your business.
-
 Bmw group automotive segment ebit 2014-18
This is a professionally designed visual chart for BMW Group Automotive Segment EBIT 2014 to 18. This is part of our Data and Statistics products selection, and you will need a Paid account to download the actual report with accurate data and sources. Downloaded report will contain the editable graph with accurate data, an excel table with the actual data, the exact source of the data and the release date. This slide provides a graph of Automotive Segment EBIT in JPY millions along with margin in Percentage of the company BMW Group from the years 2014 to 18. Download it immediately and use it for your business.
-
 Bmw group automotive segment fleet emissions 2014-18
This is a professionally designed visual chart for BMW Group Automotive Segment Fleet Emissions 2014 to 18. This is part of our Data and Statistics products selection, and you will need a Paid account to download the actual report with accurate data and sources. Downloaded report will contain the editable graph with accurate data, an excel table with the actual data, the exact source of the data and the release date. This slide provides a graph of Automotive Segment Fleet Emissions in g CO2 km of the company BMW Group from the years 2014 to 18. Download it immediately and use it for your business.
-
 Bmw group automotive segment production forecast 2018-2022
This is a professionally designed visual chart for BMW Group Automotive Segment Production Forecast 2018 to 2022. This is part of our Data and Statistics products selection, and you will need a Paid account to download the actual report with accurate data and sources. Downloaded report will contain the editable graph with accurate data, an excel table with the actual data, the exact source of the data and the release date. This slide provides a graph of Automotive Segment Production in millions and showing the forecast for the year 2022 of the company BMW Group. Download it immediately and use it for your business.
-
 Bmw group automotive segment production volume 2014-18
This is a professionally designed visual chart for BMW Group Automotive Segment Production Volume 2014 to 18. This is part of our Data and Statistics products selection, and you will need a Paid account to download the actual report with accurate data and sources. Downloaded report will contain the editable graph with accurate data, an excel table with the actual data, the exact source of the data and the release date. This slide provides a stack chart showing the Automotive Segment Production Volume categorized by BMW, MINI and Rolls-Royce of the company BMW Group from the years 2014 to 18. Download it immediately and use it for your business.
-
 Bmw group automotive segment revenue 2014-18
This is a professionally designed visual chart for BMW Group Automotive Segment Revenue 2014 to 18. This is part of our Data and Statistics products selection, and you will need a Paid account to download the actual report with accurate data and sources. Downloaded report will contain the editable graph with accurate data, an excel table with the actual data, the exact source of the data and the release date. This slide provides a graph of Automotive Segment Revenue in JPY millions of the company BMW Group from the years 2014 to 18. Download it immediately and use it for your business.
-
 Bmw group automotive segment roce 2014-18
This is a professionally designed visual chart for BMW Group Automotive Segment ROCE 2014 to 18. This is part of our Data and Statistics products selection, and you will need a Paid account to download the actual report with accurate data and sources. Downloaded report will contain the editable graph with accurate data, an excel table with the actual data, the exact source of the data and the release date. This slide provides a graph of Automotive Segment RoCE in Percentage of the company BMW Group from the years 2014 to 18. Download it immediately and use it for your business.
-
 Bmw group automotive segment sales volume 2014-18
This is a professionally designed visual chart for BMW Group Automotive Segment Sales Volume 2014 to 18. This is part of our Data and Statistics products selection, and you will need a Paid account to download the actual report with accurate data and sources. Downloaded report will contain the editable graph with accurate data, an excel table with the actual data, the exact source of the data and the release date. This slide provides a stack chart showing the Automotive Segment Sales Volume categorized by BMW, MINI and Rolls-Royce of the company BMW Group from the years 2014 to 18. Download it immediately and use it for your business.
-
 Bmw group automotive segment sales volume by region 2017-2018
This is a professionally designed visual chart for BMW Group Automotive Segment Sales Volume By Region 2017 to 2018. This is part of our Data and Statistics products selection, and you will need a Paid account to download the actual report with accurate data and sources. Downloaded report will contain the editable graph with accurate data, an excel table with the actual data, the exact source of the data and the release date. This slide provides a pie chart showing the Automotive Segment Sales Volume by Region including Americas, Europe, Mainland China etc. in Percentage of the company BMW Group for the years 2017 to 2018. Download it immediately and use it for your business.
-
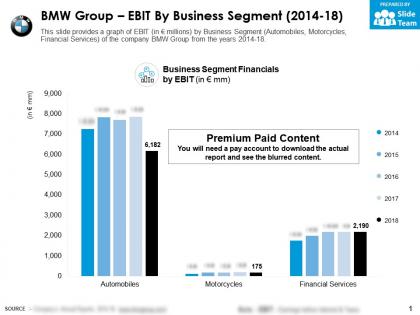 Bmw group ebit by business segment 2014-18
This is a professionally designed visual chart for BMW Group EBIT By Business Segment 2014 to 18. This is part of our Data and Statistics products selection, and you will need a Paid account to download the actual report with accurate data and sources. Downloaded report will contain the editable graph with accurate data, an excel table with the actual data, the exact source of the data and the release date. This slide provides a graph of EBIT in JPY millions by Business Segment Automobiles, Motorcycles, Financial Services of the company BMW Group from the years 2014 to 18. Download it immediately and use it for your business.
-
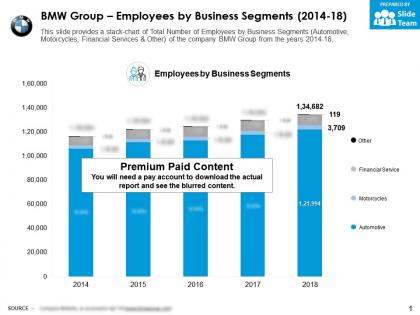 Bmw group employees by business segments 2014-18
This is a professionally designed visual chart for BMW Group Employees By Business Segments 2014 to 18. This is part of our Data and Statistics products selection, and you will need a Paid account to download the actual report with accurate data and sources. Downloaded report will contain the editable graph with accurate data, an excel table with the actual data, the exact source of the data and the release date. This slide provides a stack chart of Total Number of Employees by Business Segments Automotive, Motorcycles, Financial Services and Other of the company BMW Group from the years 2014 to 18. Download it immediately and use it for your business.
-
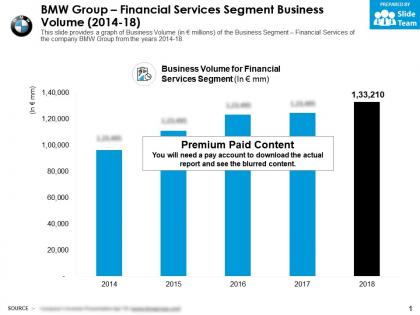 Bmw group financial services segment business volume 2014-18
This is a professionally designed visual chart for BMW Group Financial Services Segment Business Volume 2014 to 18. This is part of our Data and Statistics products selection, and you will need a Paid account to download the actual report with accurate data and sources. Downloaded report will contain the editable graph with accurate data, an excel table with the actual data, the exact source of the data and the release date. This slide provides a graph of Business Volume in JPY millions of the Business Segment Financial Services of the company BMW Group from the years 2014 to 18. Download it immediately and use it for your business.
-
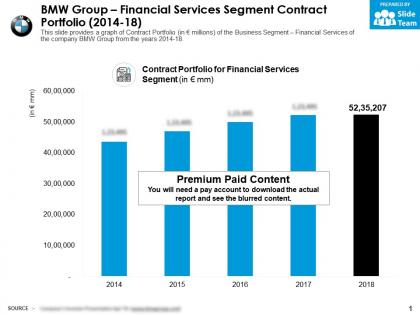 Bmw group financial services segment contract portfolio 2014-18
This is a professionally designed visual chart for BMW Group Financial Services Segment Contract Portfolio 2014 to 18. This is part of our Data and Statistics products selection, and you will need a Paid account to download the actual report with accurate data and sources. Downloaded report will contain the editable graph with accurate data, an excel table with the actual data, the exact source of the data and the release date. This slide provides a graph of Contract Portfolio in JPY millions of the Business Segment Financial Services of the company BMW Group from the years 2014 to 18. Download it immediately and use it for your business.
-
 Bmw group financial services segment credit loss ratio 2014-18
This is a professionally designed visual chart for BMW Group Financial Services Segment Credit Loss Ratio 2014 to 18. This is part of our Data and Statistics products selection, and you will need a Paid account to download the actual report with accurate data and sources. Downloaded report will contain the editable graph with accurate data, an excel table with the actual data, the exact source of the data and the release date. This slide provides a graph of Credit Loss Ratio in Percentage of the Business Segment Financial Services of the company BMW Group from the years 2014 to 18. Download it immediately and use it for your business.
-
 Bmw group financial services segment penetration rate 2014-18
This is a professionally designed visual chart for BMW Group Financial Services Segment Penetration Rate 2014 to 18. This is part of our Data and Statistics products selection, and you will need a Paid account to download the actual report with accurate data and sources. Downloaded report will contain the editable graph with accurate data, an excel table with the actual data, the exact source of the data and the release date. This slide provides a graph of Penetration Rate in Percentage of the Business Segment Financial Services of the company BMW Group from the years 2014 to 18. Download it immediately and use it for your business.
-
 Bmw group financial services segment roe 2014-18
This is a professionally designed visual chart for BMW Group Financial Services Segment Roe 2014 to 18. This is part of our Data and Statistics products selection, and you will need a Paid account to download the actual report with accurate data and sources. Downloaded report will contain the editable graph with accurate data, an excel table with the actual data, the exact source of the data and the release date. This slide provides a graph of ROE in Percentage of the Business Segment Financial Services of the company BMW Group from the years 2014 to 18. Download it immediately and use it for your business.
-
 Bmw group financials services segment by revenue and ebit 2014-18
This is a professionally designed visual chart for BMW Group Financials Services Segment By Revenue And EBIT 2014 to 18. This is part of our Data and Statistics products selection, and you will need a Paid account to download the actual report with accurate data and sources. Downloaded report will contain the editable graph with accurate data, an excel table with the actual data, the exact source of the data and the release date. This slide provides a graph of Revenue and EBIT in JPY millions of the Business Segment Financial Services of the company BMW Group from the years 2014 to 18. Download it immediately and use it for your business.
-
 Bmw group motorcycle segment roce 2014-18
This is a professionally designed visual chart for BMW Group Motorcycle Segment ROCE 2014 to 18. This is part of our Data and Statistics products selection, and you will need a Paid account to download the actual report with accurate data and sources. Downloaded report will contain the editable graph with accurate data, an excel table with the actual data, the exact source of the data and the release date. This slide provides a graph of Motorcycles Segment ROCE in Percentage of the company BMW Group from the years 2014 to 18. Download it immediately and use it for your business.
-
 Bmw group motorcycles segment deliveries 2014-18
This is a professionally designed visual chart for BMW Group Motorcycles Segment Deliveries 2014 to 18. This is part of our Data and Statistics products selection, and you will need a Paid account to download the actual report with accurate data and sources. Downloaded report will contain the editable graph with accurate data, an excel table with the actual data, the exact source of the data and the release date. This slide provides a graph of Motorcycles Segment Deliveries of the company BMW Group from the years 2014 to 18. Download it immediately and use it for your business.
-
 Bmw group motorcycles segment ebit 2014-18
This is a professionally designed visual chart for BMW Group Motorcycles Segment EBIT 2014 to 18. This is part of our Data and Statistics products selection, and you will need a Paid account to download the actual report with accurate data and sources. Downloaded report will contain the editable graph with accurate data, an excel table with the actual data, the exact source of the data and the release date. This slide provides a graph of Motorcycles Segment EBIT in JPY millions along with margin in Percentage of the company BMW Group from the years 2014 to 18. Download it immediately and use it for your business.
-
 Bmw group motorcycles segment production 2014-18
This is a professionally designed visual chart for BMW Group Motorcycles Segment Production 2014 to 18. This is part of our Data and Statistics products selection, and you will need a Paid account to download the actual report with accurate data and sources. Downloaded report will contain the editable graph with accurate data, an excel table with the actual data, the exact source of the data and the release date. This slide provides a graph of Motorcycles Segment Production of the company BMW Group from the years 2014 to 18. Download it immediately and use it for your business.
-
 Bmw group motorcycles segment revenue 2014-18
This is a professionally designed visual chart for BMW Group Motorcycles Segment Revenue 2014 to 18. This is part of our Data and Statistics products selection, and you will need a Paid account to download the actual report with accurate data and sources. Downloaded report will contain the editable graph with accurate data, an excel table with the actual data, the exact source of the data and the release date. This slide provides a graph of Motorcycles Segment Revenue in JPY millions of the company BMW Group from the years 2014 to 18. Download it immediately and use it for your business.
-
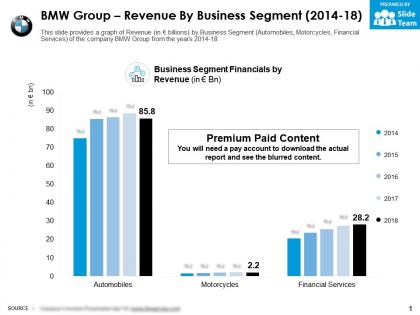 Bmw group revenue by business segment 2014-18
This is a professionally designed visual chart for BMW Group Revenue By Business Segment 2014 to 18. This is part of our Data and Statistics products selection, and you will need a Paid account to download the actual report with accurate data and sources. Downloaded report will contain the editable graph with accurate data, an excel table with the actual data, the exact source of the data and the release date. This slide provides a graph of Revenue in JPY billions by Business Segment Automobiles, Motorcycles, Financial Services of the company BMW Group from the years 2014 to 18 . Download it immediately and use it for your business.
-
 Revenue Split By Product Segment One Pager Sample Example Document
This is a One Pager titled Revenue Split By Product Segment One Pager Sample Example Document featuring A4 size content and graphics. It is designed in PowerPoint by an expert and is 100 percent editable. You can also access it with Google Slides.
-
 Prudential products and services by business segments 2018
The information presented in this slide has been researched by our team of professional business analysts. This is part of our Company Profiles products selection, and you will need a Paid account to download the actual report with accurate data and sources. Downloaded report will be in Powerpoint and will contain the actual editable slides with the actual data and sources for each data. This slide shows the Products PGIM, Retirement, Group Insurance Segment of Prudential Financial Inc. for the year 2018. Download it immediately and use it for your business.
-
 Prudential group insurance segment earning contribution and premium 2017-2018
This is a professionally designed visual chart for Prudential Group Insurance Segment Earning Contribution And Premium 2017 to 2018. This is part of our Data and Statistics products selection, and you will need a Paid account to download the actual report with accurate data and sources. Downloaded report will contain the editable graph with accurate data, an excel table with the actual data, the exact source of the data and the release date. This slide shows the earning contribution to prudential and earned premiums and fees of Group Insurance segment of Prudential Financial Inc. for the year 2017 to 2018. Download it immediately and use it for your business.
-
 Prudential individual annuities segment earning contribution and return on assets 2017-2018
This is a professionally designed visual chart for Prudential Individual Annuities Segment Earning Contribution And Return On Assets 2017 to 2018. This is part of our Data and Statistics products selection, and you will need a Paid account to download the actual report with accurate data and sources. Downloaded report will contain the editable graph with accurate data, an excel table with the actual data, the exact source of the data and the release date. This slide shows the earning contribution to prudential and Return on Assets of Individual Annuities segment of Prudential Financial Inc. for the year 2017 to 2018. Download it immediately and use it for your business.
-
 Prudential individual life segment earning contribution and sales 2017-2018
This is a professionally designed visual chart for Prudential Individual Life Segment Earning Contribution And Sales 2017 to 2018. This is part of our Data and Statistics products selection, and you will need a Paid account to download the actual report with accurate data and sources. Downloaded report will contain the editable graph with accurate data, an excel table with the actual data, the exact source of the data and the release date. This slide shows the earning contribution to prudential and Sales of Individual Life segment of Prudential Financial Inc. for the year 2017 to 2018. Download it immediately and use it for your business.
-
 Prudential international segment earning contribution and sales 2017-2018
This is a professionally designed visual chart for Prudential International Segment Earning Contribution And Sales 2017 to 2018. This is part of our Data and Statistics products selection, and you will need a Paid account to download the actual report with accurate data and sources. Downloaded report will contain the editable graph with accurate data, an excel table with the actual data, the exact source of the data and the release date. This slide shows the earning contribution to prudential and sales of International segment of Prudential Financial Inc. for the year 2017 to 2018. Download it immediately and use it for your business.
-
 Prudential pgim segment earning contribution and net flows 2017-2018
This is a professionally designed visual chart for Prudential PGIM Segment Earning Contribution And Net Flows 2017 to 2018. This is part of our Data and Statistics products selection, and you will need a Paid account to download the actual report with accurate data and sources. Downloaded report will contain the editable graph with accurate data, an excel table with the actual data, the exact source of the data and the release date. This slide shows the earning contribution to prudential and Net Flows of PGIM segment of Prudential Financial Inc. for the year 2017 to 2018. Download it immediately and use it for your business.
-
 Prudential retirement segment earning contribution and net flows 2017-2018
This is a professionally designed visual chart for Prudential Retirement Segment Earning Contribution And Net Flows 2017 to 2018. This is part of our Data and Statistics products selection, and you will need a Paid account to download the actual report with accurate data and sources. Downloaded report will contain the editable graph with accurate data, an excel table with the actual data, the exact source of the data and the release date. This slide shows the earning contribution to prudential and net flows of Retirement segment of Prudential Financial Inc. for the year 2017 to 2018. Download it immediately and use it for your business.
-
 Honda motor co ltd total number of employees full time by segment 2018
This is a professionally designed visual chart for Honda Motor Co Ltd Total Number Of Employees Full Time By Segment 2018. This is part of our Data and Statistics products selection, and you will need a Paid account to download the actual report with accurate data and sources. Downloaded report will contain the editable graph with accurate data, an excel table with the actual data, the exact source of the data and the release date. This slide covers the Full time Employees by segment of Honda company Worldwide in 2018. Download it immediately and use it for your business.
-
 Honda motor co ltd unit sales by segments 2014-2018
This is a professionally designed visual chart for Honda Motor Co Ltd Unit Sales By Segments 2014 to 2018. This is part of our Data and Statistics products selection, and you will need a Paid account to download the actual report with accurate data and sources. Downloaded report will contain the editable graph with accurate data, an excel table with the actual data, the exact source of the data and the release date. This slide covers the Unit sales by Motorcycle, Automobiles and Power Products segments from 2014 to 2018 In Thousands. Download it immediately and use it for your business.
-
 Tesla inc automotive segment revenue 2014-2018
This is a professionally designed visual chart for Tesla Inc Automotive Segment Revenue 2014 to 2018. This is part of our Data and Statistics products selection, and you will need a Paid account to download the actual report with accurate data and sources. Downloaded report will contain the editable graph with accurate data, an excel table with the actual data, the exact source of the data and the release date. This slide shows Automotive Segment Revenue of Tesla Inc from the years 2014 to 2018. Download it immediately and use it for your business.
-
 Tesla inc energy storage segment revenue 2014-2018
This is a professionally designed visual chart for Tesla Inc Energy Storage Segment Revenue 2014 to 2018. This is part of our Data and Statistics products selection, and you will need a Paid account to download the actual report with accurate data and sources. Downloaded report will contain the editable graph with accurate data, an excel table with the actual data, the exact source of the data and the release date. This slide shows Energy storage Segment Revenue of Tesla Inc from the years 2014 to 2018. Download it immediately and use it for your business.
-
 Tesla inc revenue by segments 2014-2018
This is a professionally designed visual chart for Tesla Inc Revenue By Segments 2014 to 2018. This is part of our Data and Statistics products selection, and you will need a Paid account to download the actual report with accurate data and sources. Downloaded report will contain the editable graph with accurate data, an excel table with the actual data, the exact source of the data and the release date. This slide shows Revenue by Segments of Tesla Inc from the years 2014 to 2018. Download it immediately and use it for your business.
-
 Fiat chrysler automobiles apac segment revenues 2014-2018
This is a professionally designed visual chart for Fiat Chrysler Automobiles APAC Segment Revenues 2014 to 2018. This is part of our Data and Statistics products selection, and you will need a Paid account to download the actual report with accurate data and sources. Downloaded report will contain the editable graph with accurate data, an excel table with the actual data, the exact source of the data and the release date. This slide provides the APAC segment revenues of Fiat Chrysler Automobiles for the year 2014 to 18. Download it immediately and use it for your business.
-
 Fiat chrysler automobiles emea segment revenues 2014-2018
This is a professionally designed visual chart for Fiat Chrysler Automobiles EMEA Segment Revenues 2014 to 2018. This is part of our Data and Statistics products selection, and you will need a Paid account to download the actual report with accurate data and sources. Downloaded report will contain the editable graph with accurate data, an excel table with the actual data, the exact source of the data and the release date. This slide provides the EMEA segment revenues of Fiat Chrysler Automobiles for the year 2014 to 18. Download it immediately and use it for your business.
-
 Fiat chrysler automobiles latam segment revenues 2014-2018
This is a professionally designed visual chart for Fiat Chrysler Automobiles LATAM Segment Revenues 2014 to 2018. This is part of our Data and Statistics products selection, and you will need a Paid account to download the actual report with accurate data and sources. Downloaded report will contain the editable graph with accurate data, an excel table with the actual data, the exact source of the data and the release date. This slide provides the LATAM segment revenues of Fiat Chrysler Automobiles, for the year 2014 to 18. Download it immediately and use it for your business.
-
 Fiat chrysler automobiles maserati segment revenues 2014-2018
This is a professionally designed visual chart for Fiat Chrysler Automobiles Maserati Segment Revenues 2014 to 2018. This is part of our Data and Statistics products selection, and you will need a Paid account to download the actual report with accurate data and sources. Downloaded report will contain the editable graph with accurate data, an excel table with the actual data, the exact source of the data and the release date. This slide provides the Maserati segment revenues of Fiat Chrysler Automobiles, for the year 2014 to 18. Download it immediately and use it for your business.
-
 Fiat chrysler automobiles maserati segment stats 2017-2018
This is a professionally designed visual chart for Fiat Chrysler Automobiles Maserati Segment Stats 2017 to 2018. This is part of our Data and Statistics products selection, and you will need a Paid account to download the actual report with accurate data and sources. Downloaded report will contain the editable graph with accurate data, an excel table with the actual data, the exact source of the data and the release date. This slide provides the Maserati segment stats revenues, shipment, sales volume, adjusted EBIT etc. of Fiat Chrysler Automobiles, for the year 2017 to 2018. Download it immediately and use it for your business.
-
 Fiat chrysler automobiles nafta segment revenues 2014-2018
This is a professionally designed visual chart for Fiat Chrysler Automobiles NAFTA Segment Revenues 2014 to 2018. This is part of our Data and Statistics products selection, and you will need a Paid account to download the actual report with accurate data and sources. Downloaded report will contain the editable graph with accurate data, an excel table with the actual data, the exact source of the data and the release date. This slide provides the NAFTA segment revenues of Fiat Chrysler Automobiles, for the year 2014 to 18. Download it immediately and use it for your business.
-
 Fiat chrysler automobiles segment ebit 2016-2018
This is a professionally designed visual chart for Fiat Chrysler Automobiles Segment EBIT 2016 to 2018. This is part of our Data and Statistics products selection, and you will need a Paid account to download the actual report with accurate data and sources. Downloaded report will contain the editable graph with accurate data, an excel table with the actual data, the exact source of the data and the release date. This slide provides the Adjusted EBIT Earning Before Interest and Tax of all the segment NAFTA, LATAM, APAC, EMEA, and Maserati of Fiat Chrysler Automobiles for the year 2016 to 18. Download it immediately and use it for your business.
-
 Fiat chrysler automobiles segment revenues 2016-2018
This is a professionally designed visual chart for Fiat Chrysler Automobiles Segment Revenues 2016 to 2018. This is part of our Data and Statistics products selection, and you will need a Paid account to download the actual report with accurate data and sources. Downloaded report will contain the editable graph with accurate data, an excel table with the actual data, the exact source of the data and the release date. This slide provides the revenues of all the segment NAFTA, LATAM, APAC, EMEA and Maserati of Fiat Chrysler Automobiles for the year 2016 to 18. Download it immediately and use it for your business.
-
 Fiat chrysler automobiles vehicle shipped by segments 2014-2018
This is a professionally designed visual chart for Fiat Chrysler Automobiles Vehicle Shipped By Segments 2014 to 2018. This is part of our Data and Statistics products selection, and you will need a Paid account to download the actual report with accurate data and sources. Downloaded report will contain the editable graph with accurate data, an excel table with the actual data, the exact source of the data and the release date. This slide provides the total volume of vehicle shipped by Segments NAFTA, LATAM, APAC, EMEA, and Maserati of Fiat Chrysler Automobiles, for the year 2014 to 18. Download it immediately and use it for your business.


