Powerpoint Templates and Google slides for Sales Graph
Save Your Time and attract your audience with our fully editable PPT Templates and Slides.
-
 Business powerpoint templates puzzle question mark graphics sales ppt slides
We are proud to present our business powerpoint templates puzzle question mark graphics sales ppt slides. This Graphical PowerPoint Template consists of Question Mark made of Colorful Puzzle Pieces. This is an Animated Template useful to explain the Process from the beginning, defining its path and the Destination.
-
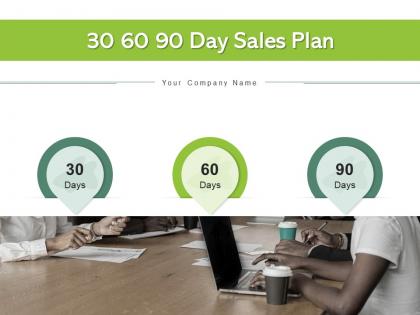 30 60 90 Day Sales Plan Revenue Generation Business Process Modeling Graphics Illustration
If you require a professional template with great design, then this 30 60 90 Day Sales Plan Revenue Generation Business Process Modeling Graphics Illustration is an ideal fit for you. Deploy it to enthrall your audience and increase your presentation threshold with the right graphics, images, and structure. Portray your ideas and vision using thirteen slides included in this complete deck. This template is suitable for expert discussion meetings presenting your views on the topic. With a variety of slides having the same thematic representation, this template can be regarded as a complete package. It employs some of the best design practices, so everything is well-structured. Not only this, it responds to all your needs and requirements by quickly adapting itself to the changes you make. This PPT slideshow is available for immediate download in PNG, JPG, and PDF formats, further enhancing its usability. Grab it by clicking the download button.
-
 Graphs and charts illustrating organizational marketing process sale
Engage buyer personas and boost brand awareness by pitching yourself using this prefabricated set. This Graphs And Charts Illustrating Organizational Marketing Process Sale is a great tool to connect with your audience as it contains high-quality content and graphics. This helps in conveying your thoughts in a well-structured manner. It also helps you attain a competitive advantage because of its unique design and aesthetics. In addition to this, you can use this PPT design to portray information and educate your audience on various topics. With twelve slides, this is a great design to use for your upcoming presentations. Not only is it cost-effective but also easily pliable depending on your needs and requirements. As such color, font, or any other design component can be altered. It is also available for immediate download in different formats such as PNG, JPG, etc. So, without any further ado, download it now.
-
 Market graph sales volume banking contribution consumer goods
Introduce your topic and host expert discussion sessions with this Market Graph Sales Volume Banking Contribution Consumer Goods. This template is designed using high-quality visuals, images, graphics, etc, that can be used to showcase your expertise. Different topics can be tackled using the twelve slides included in this template. You can present each topic on a different slide to help your audience interpret the information more effectively. Apart from this, this PPT slideshow is available in two screen sizes, standard and widescreen making its delivery more impactful. This will not only help in presenting a birds-eye view of the topic but also keep your audience engaged. Since this PPT slideshow utilizes well-researched content, it induces strategic thinking and helps you convey your message in the best possible manner. The biggest feature of this design is that it comes with a host of editable features like color, font, background, etc. So, grab it now to deliver a unique presentation every time.
-
 Mb eight staged bar graph with icons sales planning powerpoint template slide
Presenting mb eight staged bar graph with icons sales planning powerpoint template slide. Eight staged bar graph and icons has been used to craft this power point template diagram. This PPT diagram contains the concept of sales planning. Use this PPT diagram for sales and business related presentation.
-
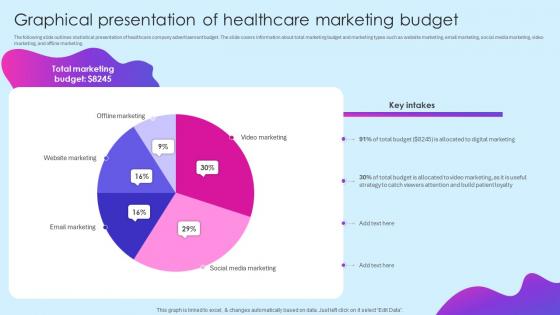 Graphical Presentation Of Budget Healthcare Marketing Ideas To Boost Sales Strategy SS V
The following slide outlines statistical presentation of healthcare company advertisement budget. The slide covers information about total marketing budget and marketing types such as website marketing, email marketing, social media marketing, video marketing, and offline marketing. Present the topic in a bit more detail with this Graphical Presentation Of Budget Healthcare Marketing Ideas To Boost Sales Strategy SS V. Use it as a tool for discussion and navigation on Graphical, Presentation, Marketing. This template is free to edit as deemed fit for your organization. Therefore download it now.
-
 Statistical Graph Illustrating Global Retail E Commerce Sales
This slide showcases the graphical presentations of worldwide retail E commerce sales which helps an organization to gain insights over meaningful data and ensures minimal downtime. It include details such as consumer satisfaction surveys, search engine optimization, targeted marketing, etc. Presenting our well structured Statistical Graph Illustrating Global Retail E Commerce Sales. The topics discussed in this slide are Expected, Satisfaction, Marketing. This is an instantly available PowerPoint presentation that can be edited conveniently. Download it right away and captivate your audience.
-
 Enhancing Retail Store Sales Budget For Digital Marketing Activities Ppt Ideas Graphics
The following slide displays the budget of the organization for marketing activities, the provided table highlights the expenses quarter wise. These expenses can be content marketing, social media marketing and online marketing etc. Present the topic in a bit more detail with this Enhancing Retail Store Sales Budget For Digital Marketing Activities Ppt Ideas Graphics. Use it as a tool for discussion and navigation on Budget Of The Organization, Marketing Activities, Expenses Quarter Wise, Content Marketing, Social Media Marketing, Online Marketing. This template is free to edit as deemed fit for your organization. Therefore download it now.
-
 Enhancing Retail Store Sales Dashboard For Retail Sector Ppt Icon Graphics Download
The following slide displays the KPI dashboard for the retail sector as it displays key metrics such as Sales by division, sales by each city, Out of stock item and top 5 items sold. Deliver an outstanding presentation on the topic using this Enhancing Retail Store Sales Dashboard For Retail Sector Ppt Icon Graphics Download. Dispense information and present a thorough explanation of Dashboard For Retail Sector, KPI Dashboard, Sales By Division using the slides given. This template can be altered and personalized to fit your needs. It is also available for immediate download. So grab it now.
-
 Highlighting Graphical Sales Growth Of Restaurant Digital And Offline Restaurant
This slide shows the current revenue growth chart of the restaurant business. The purpose of this slide is to compare the sales growth of pervious year with current year. Present the topic in a bit more detail with this Highlighting Graphical Sales Growth Of Restaurant Digital And Offline Restaurant Use it as a tool for discussion and navigation on Graphical Sales, Growth Of Restaurant This template is free to edit as deemed fit for your organization. Therefore download it now.
-
 Bayer Company Profile Net Sales Split By Geographical Area Ppt Graphics CP SS
This slide represents the net sales split for Bayer company by geographical area Europe, North America, Asia, and Latin America for years 2022 and 2021. Present the topic in a bit more detail with this Bayer Company Profile Net Sales Split By Geographical Area Ppt Graphics CP SS. Use it as a tool for discussion and navigation on Net Sales Split, Geographical Area. This template is free to edit as deemed fit for your organization. Therefore download it now.
-
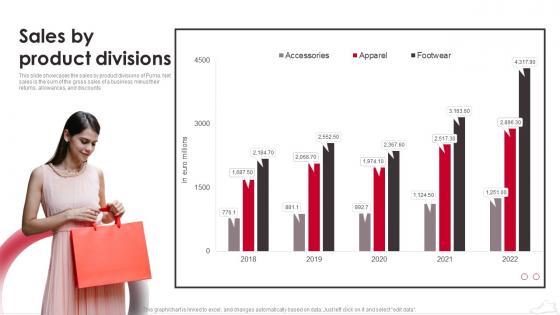 Puma Company Profile Sales By Product Divisions Ppt Graphics CP SS
This slide showcases the sales by product divisions of Puma. Net sales is the sum of the gross sales of a business minus their returns, allowances, and discounts. Deliver an outstanding presentation on the topic using this . Dispense information and present a thorough explanation of Sales By Product Divisions using the slides given. This template can be altered and personalized to fit your needs. It is also available for immediate download. So grab it now.
-
 Graphical Evaluation Of Sales And CX Team DEI Training
This slide graphically represents evaluation of DEI training for sales and CX team including parameters such as customer satisfaction, lead conversion, etc. Introducing our Graphical Evaluation Of Sales And CX Team DEI Training set of slides. The topics discussed in these slides are Graphical Evaluation, Sales And CX Team This is an immediately available PowerPoint presentation that can be conveniently customized. Download it and convince your audience.
-
 Graphic Rating Scale For Employee Sales Performance
This slide showcases key elements, including achieving targets, performance scores, improvement, and customer management, within a graphic rating scale for assessing employee sales performance. It aids in comprehensive performance evaluation, optimizing sales strategies, and decision making. Presenting our well structured Graphic Rating Scale For Employee Sales Performance The topics discussed in this slide are Employee Name, Review Period, Department This is an instantly available PowerPoint presentation that can be edited conveniently. Download it right away and captivate your audience.
-
 Quarterly Employee Business Sales Performance Graph
This slide shows graph that can be used by organizations to highlight monthly sales performance of company. It includes sales made by different employee through out the quarter. Presenting our well structured Quarterly Employee Business Sales Performance Graph. The topics discussed in this slide are Key Insights, Highest Sales, New Regions. This is an instantly available PowerPoint presentation that can be edited conveniently. Download it right away and captivate your audience.
-
 Business powerpoint templates linear flow graphical description sales ppt slides 5 stages
This PowerPoint Diagram can be used to show a progression or a sequence of stages, tasks, or events in a linear flow. Emphasizes the interconnected pieces. This diagram provides an overview of the interactions of different factors in a company. You can easily collaborate this PowerPoint diagram with colleagues to create detailed process diagrams and use them as a key element in streamlining your processes.
-
 Business powerpoint templates linear flow process graph sales ppt slides 5 stages
With these pre-designed process arrows you can visualize almost any type of concept, chronological process or steps of your strategies. Use these upright arrows to make your presentation more attractive. The structure of our Diagrams allows you to effectively highlight the key issues concerning the growth of your business.
-
 Point sale retail banking ppt powerpoint presentation file graphics download cpb
Presenting Point Sale Retail Banking Ppt Powerpoint Presentation File Graphics Download Cpb slide which is completely adaptable. The graphics in this PowerPoint slide showcase four stages that will help you succinctly convey the information. In addition, you can alternate the color, font size, font type, and shapes of this PPT layout according to your content. This PPT presentation can be accessed with Google Slides and is available in both standard screen and widescreen aspect ratios. It is also a useful set to elucidate topics like Point Sale Retail Banking. This well-structured design can be downloaded in different formats like PDF, JPG, and PNG. So, without any delay, click on the download button now.
-
 Point sale system business ppt powerpoint presentation slides graphics pictures cpb
Presenting our Point Sale System Business Ppt Powerpoint Presentation Slides Graphics Pictures Cpb PowerPoint template design. This PowerPoint slide showcases five stages. It is useful to share insightful information on Point Sale System Business This PPT slide can be easily accessed in standard screen and widescreen aspect ratios. It is also available in various formats like PDF, PNG, and JPG. Not only this, the PowerPoint slideshow is completely editable and you can effortlessly modify the font size, font type, and shapes according to your wish. Our PPT layout is compatible with Google Slides as well, so download and edit it as per your knowledge.
-
 Sales management consulting ppt powerpoint presentation infographic template graphic images cpb
Presenting Sales Management Consulting Ppt Powerpoint Presentation Infographic Template Graphic Images Cpb slide which is completely adaptable. The graphics in this PowerPoint slide showcase five stages that will help you succinctly convey the information. In addition, you can alternate the color, font size, font type, and shapes of this PPT layout according to your content. This PPT presentation can be accessed with Google Slides and is available in both standard screen and widescreen aspect ratios. It is also a useful set to elucidate topics like Sales Management Consulting. This well structured design can be downloaded in different formats like PDF, JPG, and PNG. So, without any delay, click on the download button now.
-
 Tactics improve ecommerce sales ppt powerpoint presentation gallery graphic cpb
Presenting our Tactics Improve Ecommerce Sales Ppt Powerpoint Presentation Gallery Graphic Cpb PowerPoint template design. This PowerPoint slide showcases six stages. It is useful to share insightful information on Tactics Improve Ecommerce Sales This PPT slide can be easily accessed in standard screen and widescreen aspect ratios. It is also available in various formats like PDF, PNG, and JPG. Not only this, the PowerPoint slideshow is completely editable and you can effortlessly modify the font size, font type, and shapes according to your wish. Our PPT layout is compatible with Google Slides as well, so download and edit it as per your knowledge.
-
 Course sales marketing ppt powerpoint presentation slides graphic tips cpb
Presenting Course Sales Marketing Ppt Powerpoint Presentation Slides Graphic Tips Cpb slide which is completely adaptable. The graphics in this PowerPoint slide showcase four stages that will help you succinctly convey the information. In addition, you can alternate the color, font size, font type, and shapes of this PPT layout according to your content. This PPT presentation can be accessed with Google Slides and is available in both standard screen and widescreen aspect ratios. It is also a useful set to elucidate topics like Course Sales Marketing. This well-structured design can be downloaded in different formats like PDF, JPG, and PNG. So, without any delay, click on the download button now.
-
 Indirect sales tax write offs ppt powerpoint presentation model graphic tips cpb
Presenting Indirect Sales Tax Write Offs Ppt Powerpoint Presentation Model Graphic Tips Cpb slide which is completely adaptable. The graphics in this PowerPoint slide showcase four stages that will help you succinctly convey the information. In addition, you can alternate the color, font size, font type, and shapes of this PPT layout according to your content. This PPT presentation can be accessed with Google Slides and is available in both standard screen and widescreen aspect ratios. It is also a useful set to elucidate topics like Indirect Sales Tax Write offs. This well structured design can be downloaded in different formats like PDF, JPG, and PNG. So, without any delay, click on the download button now.
-
 Icons Slide For Sales Growth Strategies For Online Shopping Website Ppt Icon Graphics
Presenting our well crafted Icons Slide For Sales Growth Strategies For Online Shopping Website Ppt Icon Graphics set of slides. The slides include icons that are innovatively designed by our team of experts. The icons are easy to edit so you can conveniently increase or decrease their size without any loss in resolution. Therefore, grab them instantly.
-
 Coca Cola Sales Graph In Powerpoint And Google Slides Cpb
Presenting our Coca Cola Sales Graph In Powerpoint And Google Slides Cpb PowerPoint template design. This PowerPoint slide showcases five stages. It is useful to share insightful information on Coca Cola Sales Graph. This PPT slide can be easily accessed in standard screen and widescreen aspect ratios. It is also available in various formats like PDF, PNG, and JPG. Not only this, the PowerPoint slideshow is completely editable and you can effortlessly modify the font size, font type, and shapes according to your wish. Our PPT layout is compatible with Google Slides as well, so download and edit it as per your knowledge.
-
 State Sales Taxes Ranked Graph In Powerpoint And Google Slides Cpb
Presenting State Sales Taxes Ranked Graph In Powerpoint And Google Slides Cpb slide which is completely adaptable. The graphics in this PowerPoint slide showcase six stages that will help you succinctly convey the information. In addition, you can alternate the color, font size, font type, and shapes of this PPT layout according to your content. This PPT presentation can be accessed with Google Slides and is available in both standard screen and widescreen aspect ratios. It is also a useful set to elucidate topics like State Sales Taxes Ranked Graph. This well-structured design can be downloaded in different formats like PDF, JPG, and PNG. So, without any delay, click on the download button now.
-
 Enhancing Retail Store Sales Defining Our Customer Journey Ppt Icon Graphics Template
The following slide displays the customer journey of the organization as it highlights the various stage of the process which are Awareness, Consideration, purchase, service and loyalty. The following also highlights the various touch points. Increase audience engagement and knowledge by dispensing information using Enhancing Retail Store Sales Defining Our Customer Journey Ppt Icon Graphics Template. This template helps you present information on five stages. You can also present information on Awareness, Consideration, Loyalty, Defining Our Customer Journey using this PPT design. This layout is completely editable so personaize it now to meet your audiences expectations.
-
 Graphic Design Business Plan Graphic Design Company Marketing And Sales Funnel BP SS
This slide highlights customer journey mapping to track users actions and key touch points across levels such as awareness, conversion, activation, loyalty, and growth. These insights allow the company to invest in suitable marketing activities. Introducing Graphic Design Business Plan Graphic Design Company Marketing And Sales Funnel BP SS to increase your presentation threshold. Encompassed with five stages, this template is a great option to educate and entice your audience. Dispence information on Awareness, Consideration, Conversion, Loyalty, using this template. Grab it now to reap its full benefits.
-
 Graphic Design Business Plan Sales Strategies For Graphic Design Company BP SS
This slide highlights the top pricing strategies for auto repair shop which includes offer value-added services, offer special promotions and upselling the products. Introducing Graphic Design Business Plan Sales Strategies For Graphic Design Company BP SS to increase your presentation threshold. Encompassed with three stages, this template is a great option to educate and entice your audience. Dispence information on Offer Value Added Services, Offer Special Promotions, Upselling, using this template. Grab it now to reap its full benefits.
-
 Graphic Rating Scale For Employee Sales Performance Icon
Introducing our Graphic Rating Scale For Employee Sales Performance Icon set of slides. The topics discussed in these slides are Graphic Rating Scale, Employee Sales Performance Icon This is an immediately available PowerPoint presentation that can be conveniently customized. Download it and convince your audience.
-
 Branding And Design Studio Business Plan Sales Strategies For Graphic Design Company BP SS V
This slide highlights the top pricing strategies for auto repair shop which includes offer value-added services, offer special promotions and upselling the products. Introducing Branding And Design Studio Business Plan Sales Strategies For Graphic Design Company BP SS V to increase your presentation threshold. Encompassed with Three stages, this template is a great option to educate and entice your audience. Dispence information on Offer Value-Added Services, Offer Special Promotions, Upselling, using this template. Grab it now to reap its full benefits.
-
 Digital Design Studio Business Plan Sales Strategies For Graphic Design Company BP SS V
This slide highlights the top pricing strategies for auto repair shop which includes offer value-added services, offer special promotions and upselling the products. Introducing Digital Design Studio Business Plan Sales Strategies For Graphic Design Company BP SS V to increase your presentation threshold. Encompassed with Three stages, this template is a great option to educate and entice your audience. Dispence information on Offer Special Promotions, Offer Value-Added Services, Upselling, using this template. Grab it now to reap its full benefits.
-
 Business powerpoint templates graphics arrows numbered process diagram sales ppt slides 4 stages
Use this Interconnected PowerPoint Diagram to represent hierarchical relationship. It Consists of four steps to reach the Destination. This Diagram can be used for presentations on ancestry, birth, bourgeoisie, breed, caliber, caste, circle, company, condition, connection, coterie, cultural level, degree, derivation, extraction etc. You can apply other 3D Styles and shapes to the slide to enhance your presentations.
-
 Business powerpoint templates arrow multi slide numbers graphic layout sales ppt slides
We present our Business PowerPoint Templates arrow multi slide numbers graphic layout Sales PPT Slides PowerPoint templates. This is a Process Arrows layout image. Use This PPT to show multiple groups of information or steps and sub-steps in a task, process, or workflow
-
 Ai blue cube in silver cubes graphics for sales planning powerpoint template slide
We are proud to present our blue cube in silver cubes graphics for sales planning powerpoint template slide . This power point template diagram has been crafted with graphic of blue cube among silver cubes. Use this PPT diagram contains the concept of sales planning. Use this PPT diagram for business and sales related presentations.
-
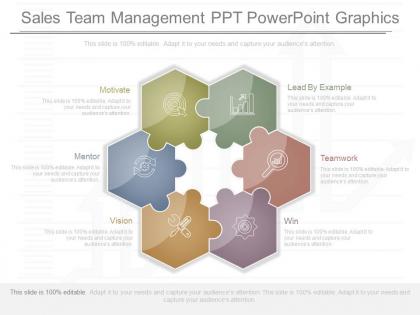 Download sales team management ppt powerpoint graphics
PowerPoint slides accessible in standard and widescreen view. PPT designs are well-suited with Google slides. PowerPoint templates can be easily modified as required. Instant download and sharing is easy. Design can be transformed into JPEG and PDF document. Suitable for sales management and leadersThe stages in this process are motivate, mentor, vision, win, teamwork, lead by example.
-
 Pptx sample of sales promotion techniques diagram presentation graphics
Presenting pptx sample of sales promotion techniques diagram presentation graphics. Presenting pptx sample of sales promotion techniques diagram presentation graphics. This is a sample of sales promotion techniques diagram presentation graphics. This is a thirteen stage process. The stages in this process are discounts, refunds, gifts, quantity deal, samples, contest, instant draws, lucky draw, usable benefits, full finance, packaged premium, container premium, rebate.
-
 Different conversion in sales sample diagram powerpoint graphics
Presenting different conversion in sales sample diagram powerpoint graphics. This is a conversion in sales sample diagram powerpoint graphics. This is five stage process. The stages in this proces are aware, consider, convert, become loyal, advocate.
-
 Original sales strategy services ppt powerpoint graphics
PowerPoint slides are compatible with Google slides. Multiple display options available such as standard and widescreen. 100% editable designs for you to show your creativity. Similar designs available with different nodes and stages. Easy to convert into JPEG or PDF format. Perfect for sales management and sales executives.The stages in this process are sales management, sales talent management, sales force structure and size, sales process, lead generation, account segmentation, primolut.
-
 App strategic account sales skills process ppt presentation graphics
Presenting app strategic account sales skills process ppt presentation graphics. This is a strategic account sales skills process ppt presentation graphics. This is a five stage process. The stages in this process are strategy, research, action plan, execution, review, sales.
-
 Different sales management strategy layout powerpoint slide graphics
Presenting different sales management strategy layout powerpoint slide graphics. This is a sales management strategy layout powerpoint slide graphics. This is a four stage process. The stages in this process are sales performance insight, sales channel effectiveness, strategy, results, execution, behaviors, sales strategy enablement, sales force motivation.
-
 Unique new sales funnel model ppt presentation graphics
Presenting unique new sales funnel model ppt presentation graphics. Presenting unique new sales funnel model ppt presentation graphics. This is a new sales funnel model ppt presentation graphics. This is a six stage process. The stages in this process are interest, evaluation, intent, purchase, consideration, awareness.
-
 Use sample of sales account plan presentation graphics
Hassle free download and sharing is easy. Ease of displaying the Presentation design in standard and widescreen view. Choice to insert or delete any element as per the requirement. Easily transformable into JPG and PDF format. PPT slides goes well with Google slides. Similar designs available with different nodes and stages. Suitable for sales management team and industry experts. The stages in this process are swot analysis, marketing plan, timeline, competition analysis, strategy, mission.
-
 View stages in sales graph ppt sample
Presenting view stages in sales graph ppt sample. This is a stages in sales graph ppt sample. This is a five stage process. The stages in this process are decision, consideration, interest, awareness, pre purchase.
-
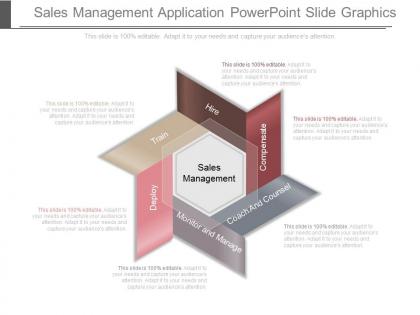 Sales management application powerpoint slide graphics
Presenting sales management application powerpoint slide graphics. This is a sales management application powerpoint slide graphics. This is a six stage process. The stages in this process are train, hire, compensate, coach and counsel, monitor and manage, deploy, sales management.
-
 Finance and sales management presentation graphics
User friendly high resolution PPT templates. Fit in widescreen. Compatible with Google slides. Goes well with varied format options. Additional template with dashboard needle graphic for highlighting progress. Customization of each graphic and icon possible. Trouble inclusion and exclusion of data according to need and want. Vibrant graphic representation each concept. Beneficial for business managers, financiers, stakeholders, realtors, marketers, investors, teachers, students.The stages in this process are customer relationship management, sales management and much more.
-
 Tracking sales performance diagram ppt background graphics
Presenting tracking sales performance diagram ppt background graphics. This is a tracking sales performance diagram ppt background graphics. This is a three stage process. The stages in this process are efficiency, profits, effectiveness, cost per sale, profit sale, percentage convert to sale, cost contact, conversion, conversion percentage, contacts.
-
 Example of sales management learning outcomes diagram powerpoint graphics
Presenting example of sales management learning outcomes diagram powerpoint graphics. This is a example of sales management learning outcomes diagram powerpoint graphics. This is a nine stage process. The stages in this process are analyze pipeline, review opportunity, identify opp issue, update crm, coach opp issue, follow up, coach skill issue, identify skill issue, diagnose, coach.
-
 Overall sales resource diagram powerpoint graphics
Presenting overall sales resource diagram powerpoint graphics. This is a overall sales resource diagram powerpoint graphics. This is a six stage process. The stages in this process are sales operations, sales planning, growth, earning, advertisement, progress.
-
 Sales performance wheel ppt powerpoint graphics
Presenting sales performance wheel ppt powerpoint graphics. This is a sales performance wheel ppt powerpoint graphics. This is a six stage process. The stages in this process are strategy and operations, accountability, motivation, staffing, capability, execution enablement.
-
 Sales process improvement techniques ppt powerpoint graphics
Presenting sales process improvement techniques ppt powerpoint graphics. Presenting sales process improvement techniques ppt powerpoint graphics. This is a sales process improvement techniques ppt powerpoint graphics. This is a six stage process. The stages in this process are understand your specific needs, sign off, review, agree improvements, assess current competencies, implement improvements.
-
 Factors to improve online sales diagram powerpoint graphics
Presenting factors to improve online sales diagram powerpoint graphics. This is a factors to improve online sales diagram powerpoint graphics. This is a five stage process. The stages in this process are search engine copywriting, social networking, content marketing, conversion optimization, blogging.
-
 Marketing analytics sales automation powerpoint graphics
Presenting marketing analytics sales automation powerpoint graphics. Presenting marketing analytics sales automation powerpoint graphics. Presenting marketing analytics sales automation powerpoint graphics. This is a marketing analytics sales automation powerpoint graphics. This is a five stage process. The stages in this process are social media marketing, sales automation, email marketing, marketing analytics, content management.
-
 B2b sales success template powerpoint graphics
Presenting b2b sales success template powerpoint graphics. This is a b2b sales success template powerpoint graphics. This is a seven stage process. The stages in this process are goal, initiatives, information, productivity, customer satisfaction, supply chain excellence, cost saving.
-
 Sales actions for banking presentation graphics
Presenting sales actions for banking presentation graphics. This is a sales actions for banking presentation graphics. This is a eight stage process. The stages in this process are expending,growing,building,payment,acquiring,risk oversight and management,financial stability,monetary policy.
-
 Partner sales powerpoint graphics
Presenting partner sales powerpoint graphics. This is a partner sales powerpoint graphics. This is six stage process. The stages in this process are marketing literature, sales tools, channel incentives, product promotions, deal registration, news and events.
-
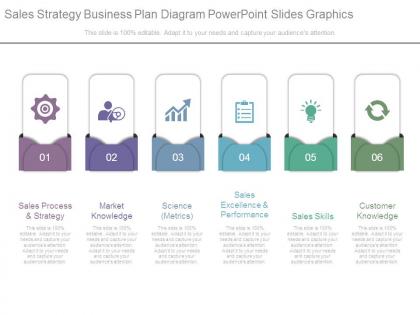 Sales strategy business plan diagram powerpoint slides graphics
Presenting sales strategy business plan diagram powerpoint slides graphics. Presenting sales strategy business plan diagram powerpoint slides graphics. This is a sales strategy business plan diagram powerpoint slides graphics. This is six stage process. The stages in this process are sales process and strategy, market knowledge, science metrics, sales excellence and performance, sales skills, customer knowledge.
-
 Key sales initiatives powerpoint slide graphics
Presenting key sales initiatives powerpoint slide graphics. This is a key sales initiatives powerpoint slide graphics. This is a five stage process. The stages in this process are Marketing Leads, Lead, Lead Nurturing, Sales Leads, Opportunities, Sales, Digital Marketing Sources, Traditional Marketing Sources, Inquiries, Registrations, Customer And Contact Pool.
-
 Weekly quarterly sales summary review ppt background graphics
Presenting weekly quarterly sales summary review ppt background graphics. This is a weekly quarterly sales summary review ppt background graphics. This is a four stage process. The stages in this process are business, management, marketing, icon, timeline.
-
 Sales and marketing plan powerpoint slide graphics
Presenting sales and marketing plan powerpoint slide graphics. This is a sales and marketing plan powerpoint slide graphics. This is three stage process. The stages in this process are online, blog, website, mobile app, mobile alerts, advertising, print, outdoor, radio, television, market research, surveys, impact studies.


