Powerpoint Templates and Google slides for Sales Dashboard
Save Your Time and attract your audience with our fully editable PPT Templates and Slides.
-
 Vendor kpi dashboard showing sales by day sales person analysis top 10 customers by order value
Presenting this set of slides with name - Vendor Kpi Dashboard Showing Sales By Day Sales Person Analysis Top 10 Customers By Order Value. This is a six stage process. The stages in this process are Vendor, Supplier, Retailer.
-
 Vendor kpi dashboard showing store analytics sales by product and product stats
Presenting this set of slides with name - Vendor Kpi Dashboard Showing Store Analytics Sales By Product And Product Stats. This is a four stage process. The stages in this process are Vendor, Supplier, Retailer.
-
 Environmental sustainability kpi dashboard showing total consumption sales energy sources
Presenting this set of slides with name - Environmental Sustainability Kpi Dashboard Showing Total Consumption Sales Energy Sources. This is a six stage process. The stages in this process are Environment Sustainability, Environment Continual, Environment Feasibility.
-
 Wholesale and retail kpi dashboard showing inventory level by category sales revenue month
Presenting the retail business slide for PowerPoint. This presentation template is 100% modifiable in PowerPoint and is designed by professionals. You can edit the objects in the slide like font size and font color very easily. This presentation slide is fully compatible with Google Slide and can be saved in JPG or PDF file format without any fuss. Click on the download button to download this template in no time.
-
 Wholesale and retail kpi dashboard showing sales revenue customers and out of stock items
Presenting the KPI dashboard presentation template. This PPT template is 100% customizable in MS PowerPoint and is designed under the strict supervision of professionals. The user can edit the objects in the slide like font size and font color without any hassle. This presentation template is 100% compatible with Google Slide and can be saved in JPG or PDF file format easily. Click on the download tab to download this presentation template.
-
 Wholesale and retail kpi dashboard showing shopify total amount sold percentage sales by product category
Presenting the retail business presentation template for PowerPoint. This PowerPoint template is 100% editable in PowerPoint and is professionally designed. You can edit the objects in the slide like font size and font color very easily. This presentation template is 100% compatible with Google Slide and can be saved in JPG or PDF file format without any fuss. Fast download this at the click of the button.
-
 Wholesale and retail kpi dashboard showing total sales per labor hour sales by unit area
Presenting the KPI dashboard template for PowerPoint. This PPT template is 100% customizable in MS PowerPoint and is professionally designed. You can edit the objects in the slide like font size and font color very easily. This presentation template is 100% compatible with Google Slide and can be saved in JPG or PDF file format without any fuss. Click on the download button to download this presentation template.
-
 Executing reporting kpi dashboard snapshot showing income sales by product vendor expenses
Presenting this set of slides with name - Executing Reporting Kpi Dashboard Snapshot Showing Income Sales By Product Vendor Expenses. This is a four stage process. The stages in this process are Executive Reporting, Executive Analysis, Executive Performance.
-
 Executing reporting kpi dashboard showing sales opportunity and sales booking
Presenting this set of slides with name - Executing Reporting Kpi Dashboard Showing Sales Opportunity And Sales Booking. This is a four stage process. The stages in this process are Executive Reporting, Executive Analysis, Executive Performance.
-
 Executing reporting kpi dashboard showing total accounts marketing sales finance
Presenting this set of slides with name - Executing Reporting Kpi Dashboard Showing Total Accounts Marketing Sales Finance. This is a four stage process. The stages in this process are Executive Reporting, Executive Analysis, Executive Performance.
-
 Executing reporting kpi dashboard showing trading summary performance summary and sales ratio
Presenting this set of slides with name - Executing Reporting Kpi Dashboard Showing Trading Summary Performance Summary And Sales Ratio. This is a four stage process. The stages in this process are Executive Reporting, Executive Analysis, Executive Performance.
-
 Professional and technical services kpi dashboard showing department sales
Presenting this set of slides with name - Professional And Technical Services Kpi Dashboard Showing Department Sales. This is a six stage process. The stages in this process are Professional And Technical Services, Services Management, Technical Management.
-
 Professional and technical services kpi dashboard showing sales by region
Presenting this set of slides with name - Professional And Technical Services Kpi Dashboard Showing Sales By Region. This is a three stage process. The stages in this process are Professional And Technical Services, Services Management, Technical Management.
-
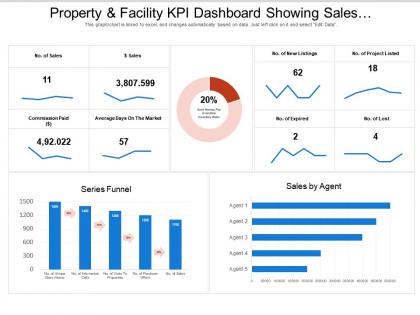 Property and facility kpi dashboard showing sales and properties listed
Presenting, property and facility KPI dashboard showing sales and properties listed PowerPoint Presentation Slide. This Presentation has been designed under the strict supervision of professionals and is fully editable. You can have access to play with the font size, font type, colors, and even the background. This Template is manageable with Google Slide and can be saved in JPG or PDF format without any hassle created during the saving process. Fast download at the click of the button shown below.
-
 Property and facility kpi dashboard showing sales trend and sales performance
Grab an opportunity to see, property and facility KPI dashboard showing sales trend and sales performance PowerPoint Presentation Slide. This Presentation has been designed under the strict supervision of professionals and is fully editable. You can have access to play with the font size, font type, colors, and even the background. This Template is achievable with Google Slide and can be saved in JPG or PDF format without any obstacles created during the saving process. Fast download at the click of the button.
-
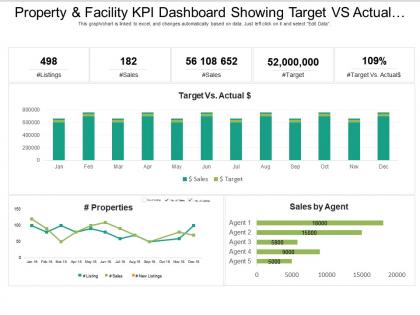 Property and facility kpi dashboard showing target vs actual cost and sales by agent
Get a chance to go through, property and facility KPI dashboard showing target-vs-actual cost and sales by agent PowerPoint Presentation Slide. This Presentation has been designed by professionals and is fully editable. You can have access to alter the font size, font type, colors, and even the background. This Template is amiable with Google Slide and can be saved in JPG or PDF format without any chaos created. Fast download at the click of the button.
-
 Logistics dashboard showing inventory to sales and inventory turnover
Presenting Logistics Dashboard Showing Inventory To Sales And Inventory Turnover PPT slide. The inventory to sale dashboard PowerPoint template designed professionally by the team of SlideTeam to present the annual report to clients and investors too. The different charts such as bar, line and many other, along with that the text in the inventory dashboard slide are customizable in PowerPoint. The logistics inventory dashboard slide is compatible with Google Slide. An individual can make changes in the font size, font type, color and dimensions of the different icons according to the requirement. This graphical inventory slide gets linked with Excel Data Sheet.
-
 Entertainment recreation and arts kpi dashboard distribution of video game sales
Presenting this set of slides with name - Entertainment Recreation And Arts Kpi Dashboard Distribution Of Video Game Sales. This is a four stage process. The stages in this process are Entertainment, Recreation And Arts, Attractions, Culture, Entertainment.
-
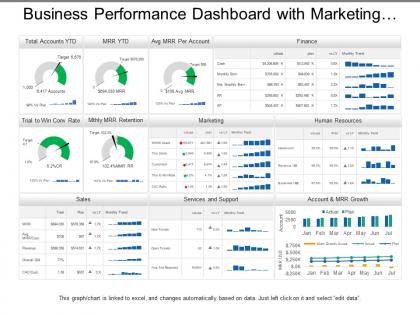 Business performance dashboard with marketing human resource and sales
Presenting, business performance dashboard with marketing human resource and sales PPT deck. This PPT deck focuses on one of the aspects of business marketing with content broadly researched by our business research team. Quickly editable color combinations, layout, text boxes, and font. Alluring graphs for illustration with relatable images to explain the concept. Transform into PDF and JPG format at ease. Predesigned content is adaptable and can be projected to widescreen for business meetings.
-
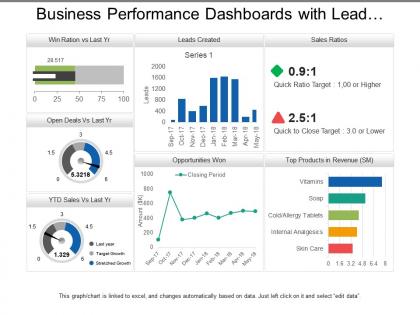 Business performance dashboards with lead creation and sales ratios
Presenting, business performance dashboards with lead creation and sales ratios for cost efficiency and performance indication PPT presentation. Bright and informative PowerPoint presentation slides. Gives regulations to achieve business success and targets. Produces error-free execution. Acts as a model for planning future assignments for marketing capabilities. Fully editable by any user at any point in time. Performs a clarity of marketing and presentation objectives without creating any confusions and misconceptions. Simple to be projected to widescreen without degradation in quality.
-
 Banking kpi dashboard showing sales funnel and overall revenue
Presenting this set of slides with name - Banking Kpi Dashboard Showing Sales Funnel And Overall Revenue. This is a six stage process. The stages in this process are Banking, Finance, Money.
-
 Month growth and sales e commerce dashboard
Presenting this set of slides with name - Month Growth And Sales E Commerce Dashboard. This is a seven stage process. The stages in this process are Mercantilism, Commercialism, Ecommerce.
-
 Sales by product and average product price e commerce dashboard
Presenting this set of slides with name - Sales By Product And Average Product Price E Commerce Dashboard. This is a eight stage process. The stages in this process are Mercantilism, Commercialism, Ecommerce.
-
 Total sales brands revenue and unsold stock e commerce dashboard
Presenting this set of slides with name - Total Sales Brands Revenue And Unsold Stock E Commerce Dashboard. This is a nine stage process. The stages in this process are Mercantilism, Commercialism, Ecommerce.
-
 Procurement inventory turnover and sales ratio dashboard
Presenting this set of slides with name - Procurement Inventory Turnover And Sales Ratio Dashboard. This is a five stage process. The stages in this process are Purchase, Procurement, Buy.
-
 Average cost per lead and monthly targeted calls sales dashboard
Presenting this set of slides with name - Average Cost Per Lead And Monthly Targeted Calls Sales Dashboard. This is a four stage process. The stages in this process are Sales Dashboard, Sales Kpis, Sales Performance.
-
 Customer lifetime value and total mrr sales dashboards
Presenting this set of slides with name - Customer Lifetime Value And Total Mrr Sales Dashboards. This is a three stage process. The stages in this process are Sales Dashboard, Sales Kpis, Sales Performance.
-
 Lead conversion and opportunity ratio sales dashboards
Presenting this set of slides with name - Lead Conversion And Opportunity Ratio Sales Dashboards. This is a four stage process. The stages in this process are Sales Dashboard, Sales Kpis, Sales Performance.
-
 Monthly mrr retention and sales value productivity dashboard
Presenting this set of slides with name - Monthly Mrr Retention And Sales Value Productivity Dashboard. This is a four stage process. The stages in this process are Sales Dashboard, Sales Kpis, Sales Performance.
-
 Monthly sales growth and net profit margin dashboard
Presenting this set of slides with name - Monthly Sales Growth And Net Profit Margin Dashboard. This is a four stage process. The stages in this process are Sales Dashboard, Sales Kpis, Sales Performance.
-
 Revenue debt to equity and net profit margin sales dashboard
Presenting this set of slides with name - Revenue Debt To Equity And Net Profit Margin Sales Dashboard. This is a five stage process. The stages in this process are Sales Dashboard, Sales Kpis, Sales Performance.
-
 Revenue from new products and average purchase value sales dashboards
Presenting this set of slides with name - Revenue From New Products And Average Purchase Value Sales Dashboards. This is a five stage process. The stages in this process are Sales Dashboard, Sales Kpis, Sales Performance.
-
 Sales growth ratio and booking this month dashboard
Presenting this set of slides with name - Sales Growth Ratio And Booking This Month Dashboard. This is a four stage process. The stages in this process are Sales Dashboard, Sales Kpis, Sales Performance.
-
 Sales performance and product revenue dashboard
Presenting this set of slides with name - Sales Performance And Product Revenue Dashboard. Amazing representation of content used in the PowerPoint slide. Good quality pixels used in the designing. High resolution presentation design does not affect the quality even when projected on wide screen. Easy convert into different formats such as JPG and PDF. Compatible with maximum number of software and Google slides. Easy to add and remove content as per business need. Totally modifiable PPT template as text, icons and graphics are editable. Insert Company’s personalized content and logo.
-
 Sales revenue and cumulative sales this year dashboards
Presenting this set of slides with name - Sales Revenue And Cumulative Sales This Year Dashboards. Completely amendable presentation design as some elements are editable. Ease to personalize the slide with your company name, logo and even tag line. PowerPoint slide can be downloaded easily and transform into JPG and PDF format. More designs can be accessed with different nodes and stages. PPT diagram can be projected in standard and widescreen view. Great use of colors and innovatively designed. PPT template is compatible with Google slides.
-
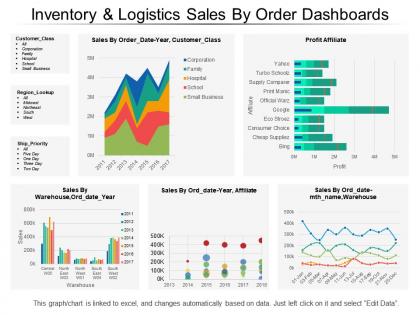 Inventory and logistics sales by order dashboards
Presenting this set of slides with name - Inventory And Logistics Sales By Order Dashboards. This is a five stage process. The stages in this process are Inventory And Logistics, Inventory Management, Warehousing And Inventory Management.
-
 Business analytics dashboard snapshot with net sales product inventory purchases and performance
This is a five stage process. The stages in this process are Business Analytics, BA, Organizations Data.
-
 Business analytics dashboard snapshot with online sales tracking and product profit per unit
This is a two stage process. The stages in this process are Business Analytics, BA, Organizations Data.
-
 Business analytics dashboard with supply chain overview and sales in unit price increase or decrease
This is a three stage process. The stages in this process are Business Analytics, BA, Organizations Data.
-
 Business analytics dashboard with total leads sales and new customers
This is a three stage process. The stages in this process are Business Analytics, BA, Organizations Data.
-
 Point of sale system dashboard for customer and merchant details
Presenting this set of slides with name - Point Of Sale System Dashboard For Customer And Merchant Details. This is a three stage process. The stages in this process are Point Of Sale System, POS, Point Of Purchase.
-
 Icon of sales pipeline review dashboard
Introducing our Icon Of Sales Pipeline Review Dashboard set of slides. The topics discussed in these slides are Icon Of Sales Pipeline Review Dashboard. This is an immediately available PowerPoint presentation that can be conveniently customized. Download it and convince your audience.
-
 Sales Rep Performance Measuring Dashboard Improving Planning Segmentation
This slide illustrates sales representative performance measurement dashboard with key metrics such as average first contact resolution rate, occupancy rate, NPS and top agents by solved tickets. Present the topic in a bit more detail with this Sales Rep Performance Measuring Dashboard Improving Planning Segmentation. Use it as a tool for discussion and navigation on Unassigned, Solved, Escalated, Open. This template is free to edit as deemed fit for your organization. Therefore download it now.
-
 Effective pipeline management sales customer deal tracking in dashboard
This slide covers information regarding dashboard for tracking various customer deals in sales pipeline. Increase audience engagement and knowledge by dispensing information using Effective Pipeline Management Sales Customer Deal Tracking In Dashboard. This template helps you present information on four stages. You can also present information on Qualified, Meeting Held, Proposal Sent, Terms Accepted using this PPT design. This layout is completely editable so personaize it now to meet your audiences expectations.
-
 Tracking sales pipeline lead activity dashboard effective pipeline management
This slide covers information regarding dashboard associated to tracking lead activity across sales pipeline. Present the topic in a bit more detail with this Tracking Sales Pipeline Lead Activity Dashboard Effective Pipeline Management. Use it as a tool for discussion and navigation on Active Opportunity, Late Stage Opportunities, Closed Won, Closed Lost. This template is free to edit as deemed fit for your organization. Therefore download it now.
-
 Point Of Sale System Dashboard Snapshot Depicting Restaurants Daily Performance
This Slide represents point of sale system dashboard snapshot depicting restaurants daily performance which can be beneficial for eateries to manage their regular sales. It includes information about sales, expenditure, menu, customer data, bookings and reports. Introducing our Point Of Sale System Dashboard Depicting Restaurants Daily Performance set of slides. The topics discussed in these slides are Dashboard, Performance, Expenditure. This is an immediately available PowerPoint presentation that can be conveniently customized. Download it and convince your audience.
-
 Retail Store Point Of Sale System Dashboard With Product Invoice
This Slide illustrates retail store point of sale system POS dashboard showing product bill which can be beneficial for shopkeepers who want to employ invoice system in their stores. It includes information about product, price, quantity, total amount, payment methods, etc. Presenting our well structured Retail Store Point Of Sale System Dashboard With Product Invoice. The topics discussed in this slide are System, Dashboard, Product. This is an instantly available PowerPoint presentation that can be edited conveniently. Download it right away and captivate your audience.
-
 Workforce Sales And Productivity Analytics Dashboard Icon
Presenting our set of slides with name Workforce Sales And Productivity Analytics Dashboard Icon. This exhibits information on four stages of the process. This is an easy to edit and innovatively designed PowerPoint template. So download immediately and highlight information on Workforce Sales And Productivity, Analytics Dashboard Icon.
-
 Monthly Sales Performance Monitoring Dashboard Icon
Presenting our set of slides with name Monthly Sales Performance Monitoring Dashboard Icon. This exhibits information on four stages of the process. This is an easy-to-edit and innovatively designed PowerPoint template. So download immediately and highlight information on Monthly Sales Performance Monitoring Dashboard Icon.
-
 Sales Dashboard Metrics In Powerpoint And Google Slides Cpb
Presenting Sales Dashboard Metrics In Powerpoint And Google Slides Cpb slide which is completely adaptable. The graphics in this PowerPoint slide showcase five stages that will help you succinctly convey the information. In addition, you can alternate the color, font size, font type, and shapes of this PPT layout according to your content. This PPT presentation can be accessed with Google Slides and is available in both standard screen and widescreen aspect ratios. It is also a useful set to elucidate topics like Sales Dashboard Metrics. This well structured design can be downloaded in different formats like PDF, JPG, and PNG. So, without any delay, click on the download button now.
-
 Sales Dashboard Templates In Powerpoint And Google Slides Cpb
Presenting our Sales Dashboard Templates In Powerpoint And Google Slides Cpb PowerPoint template design. This PowerPoint slide showcases five stages. It is useful to share insightful information on Sales Dashboard Templates This PPT slide can be easily accessed in standard screen and widescreen aspect ratios. It is also available in various formats like PDF, PNG, and JPG. Not only this, the PowerPoint slideshow is completely editable and you can effortlessly modify the font size, font type, and shapes according to your wish. Our PPT layout is compatible with Google Slides as well, so download and edit it as per your knowledge.
-
 Sales Funnel Management Dashboard Showing Effective Management Of Sales Pipeline
This slide shows the process steps followed by the company for the recruitment of new employees. It stars from Identifying the hiring needs and ends with employment offer. Deliver an outstanding presentation on the topic using this Sales Funnel Management Dashboard Showing Effective Management Of Sales Pipeline. Dispense information and present a thorough explanation of Sales Pipeline, Closed Business, Sales Activity, Sales Rep using the slides given. This template can be altered and personalized to fit your needs. It is also available for immediate download. So grab it now.
-
 Sales Funnel Management Dashboard Showing Sales Pipeline Opportunities
This slide shows the process steps followed by the company for the recruitment of new employees. It stars from Identifying the hiring needs and ends with employment offer. Present the topic in a bit more detail with this Sales Funnel Management Dashboard Showing Sales Pipeline Opportunities. Use it as a tool for discussion and navigation on Sales Funnel, Accounts Pie Chart, Opportunities. This template is free to edit as deemed fit for your organization. Therefore download it now.
-
 Sales Funnel Management Sales Pipeline Management Dashboard With Top Ten Customers
This slide shows the process steps followed by the company for the recruitment of new employees. It stars from Identifying the hiring needs and ends with employment offer. Present the topic in a bit more detail with this Sales Funnel Management Sales Pipeline Management Dashboard With Top Ten Customers. Use it as a tool for discussion and navigation on Won Lost Rate, Top 10 Customers, Opportunities Status. This template is free to edit as deemed fit for your organization. Therefore download it now.
-
 SLA Dashboard Snapshot With Sales And Product Report
Introducing our SLA Dashboard Snapshot With Sales And Product Report set of slides. The topics discussed in these slides are Marketing, Finance, Service And Supports. This is an immediately available PowerPoint presentation that can be conveniently customized. Download it and convince your audience.
-
 Leveraging Sales Pipeline To Improve Customer Deal Tracking In Sales Pipeline Dashboard
This slide covers information regarding dashboard for tracking various customer deals in sales pipeline. Introducing Leveraging Sales Pipeline To Improve Customer Deal Tracking In Sales Pipeline Dashboard to increase your presentation threshold. Encompassed with four stages, this template is a great option to educate and entice your audience. Dispence information on Average Deal Value, Meeting Held, Proposal Sent, Terms Accepted, using this template. Grab it now to reap its full benefits.
-
 Leveraging Sales Pipeline To Improve Customer Tracking Customer Sales Funnel Dashboard
This slide covers information regarding the customer sales funnel tracking with sales volume and total market. Increase audience engagement and knowledge by dispensing information using Leveraging Sales Pipeline To Improve Customer Tracking Customer Sales Funnel Dashboard. This template helps you present information on four stages. You can also present information on Total Market, Prospects, Leads, Sales using this PPT design. This layout is completely editable so personaize it now to meet your audiences expectations.
-
 Leveraging Sales Pipeline To Improve Customer Tracking Sales Pipeline And Lead Activity Dashboard
This slide covers information regarding dashboard associated to tracking lead activity across sales pipeline. Deliver an outstanding presentation on the topic using this Leveraging Sales Pipeline To Improve Customer Tracking Sales Pipeline And Lead Activity Dashboard. Dispense information and present a thorough explanation of Active Opportunity, Late Stage Opportunities, Closed Won using the slides given. This template can be altered and personalized to fit your needs. It is also available for immediate download. So grab it now.
-
 Customer Deal Tracking In Sales Pipeline Dashboard Optimizing Sales Channel For Enhanced Revenues
This slide covers information regarding dashboard for tracking various customer deals in sales pipeline. Deliver an outstanding presentation on the topic using this Customer Deal Tracking In Sales Pipeline Dashboard Optimizing Sales Channel For Enhanced Revenues. Dispense information and present a thorough explanation of Customer Deal Tracking, Sales Pipeline Dashboard, Terms Accepted using the slides given. This template can be altered and personalized to fit your needs. It is also available for immediate download. So grab it now.
-
 KPI Dashboard To Monitor Sales And Guide For Positioning Extended Brand Branding
Following slide displays sales and orders performance monitoring dashboard. Key performance indicators covered in the slide are return reasons, perfect order rate, total orders, top seller by orders.Deliver an outstanding presentation on the topic using this KPI Dashboard To Monitor Sales And Guide For Positioning Extended Brand Branding. Dispense information and present a thorough explanation of Brand Awareness, Advertising Awareness, Brand Commitment using the slides given. This template can be altered and personalized to fit your needs. It is also available for immediate download. So grab it now.


