Powerpoint Templates and Google slides for Revenue Dashboard
Save Your Time and attract your audience with our fully editable PPT Templates and Slides.
-
 Sales Manager Planning Revenues Dashboard Generation Business Product Development
Introduce your topic and host expert discussion sessions with this Sales Manager Planning Revenues Dashboard Generation Business Product Development. This template is designed using high-quality visuals, images, graphics, etc, that can be used to showcase your expertise. Different topics can be tackled using the twelve slides included in this template. You can present each topic on a different slide to help your audience interpret the information more effectively. Apart from this, this PPT slideshow is available in two screen sizes, standard and widescreen making its delivery more impactful. This will not only help in presenting a birds-eye view of the topic but also keep your audience engaged. Since this PPT slideshow utilizes well-researched content, it induces strategic thinking and helps you convey your message in the best possible manner. The biggest feature of this design is that it comes with a host of editable features like color, font, background, etc. So, grab it now to deliver a unique presentation every time.
-
 Monthly expenses representing revenues dashboard organization professional services
Deliver a credible and compelling presentation by deploying this Monthly Expenses Representing Revenues Dashboard Organization Professional Services. Intensify your message with the right graphics, images, icons, etc. presented in this complete deck. This PPT template is a great starting point to convey your messages and build a good collaboration. The twelve slides added to this PowerPoint slideshow helps you present a thorough explanation of the topic. You can use it to study and present various kinds of information in the form of stats, figures, data charts, and many more. This Monthly Expenses Representing Revenues Dashboard Organization Professional Services PPT slideshow is available for use in standard and widescreen aspects ratios. So, you can use it as per your convenience. Apart from this, it can be downloaded in PNG, JPG, and PDF formats, all completely editable and modifiable. The most profound feature of this PPT design is that it is fully compatible with Google Slides making it suitable for every industry and business domain.
-
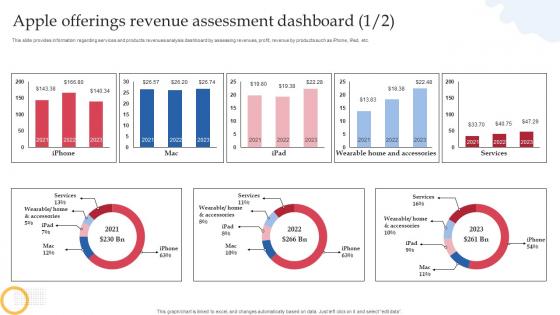 Apple Offerings Revenue Assessment Dashboard How Apple Connects With Potential Audience
This slide provides information regarding services and products revenues analysis dashboard by assessing revenues, profit, revenue by products such as iPhone, iPad, etc. Deliver an outstanding presentation on the topic using this Apple Offerings Revenue Assessment Dashboard How Apple Connects With Potential Audience. Dispense information and present a thorough explanation of Services, Mac using the slides given. This template can be altered and personalized to fit your needs. It is also available for immediate download. So grab it now.
-
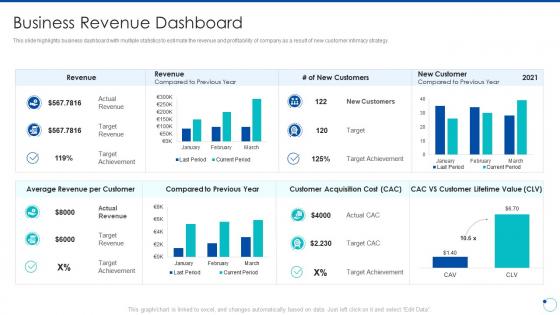 Action plan for improving consumer intimacy business revenue dashboard
Present the topic in a bit more detail with this Action Plan For Improving Consumer Intimacy Business Revenue Dashboard. Use it as a tool for discussion and navigation on Business Revenue Dashboard. This template is free to edit as deemed fit for your organization. Therefore download it now.
-
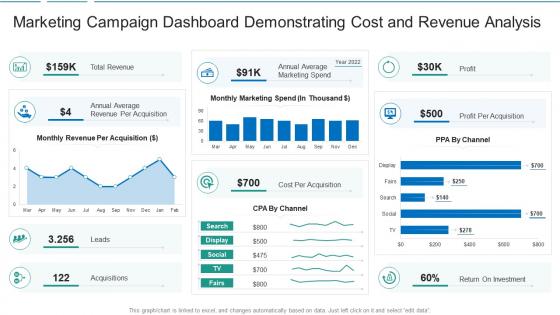 Marketing campaign dashboard demonstrating cost and revenue analysis
Introducing our Marketing Campaign Dashboard Demonstrating Cost And Revenue Analysis set of slides. The topics discussed in these slides are Revenue, Marketing, Annual Average. This is an immediately available PowerPoint presentation that can be conveniently customized. Download it and convince your audience.
-
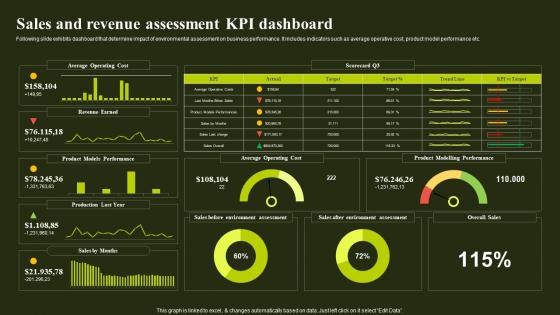 Sales And Revenue Assessment KPI Dashboard Environmental Analysis To Optimize
Following slide exhibits dashboard that determine impact of environmental assessment on business performance. It includes indicators such as average operative cost, product model performance etc.Deliver an outstanding presentation on the topic using this Sales And Revenue Assessment KPI Dashboard Environmental Analysis To Optimize. Dispense information and present a thorough explanation of Average Operating, Product Modelling Performance, Product Models Performance using the slides given. This template can be altered and personalized to fit your needs. It is also available for immediate download. So grab it now.
-
 Dashboard To Track Ecommerce Website Revenue And Traffic Sales Growth Strategies
This slide showcases dashboard that can help organization to track the traffic and revenue of ecommerce website. Its key elements are ecommerce conversion rate, average order value, performance by traffic source, top product, performance by device category. Present the topic in a bit more detail with this Dashboard To Track Ecommerce Website Revenue And Traffic Sales Growth Strategies. Use it as a tool for discussion and navigation on Dashboard To Track, Ecommerce Website Revenue And Traffic, Ecommerce Conversion Rate. This template is free to edit as deemed fit for your organization. Therefore download it now.
-
 Cross Border Approach Dashboard For Tracking Post Expansion Revenue By Product Strategy SS V
This slide covers the dashboard for analyzing fast food business sales by location.It includes KPIs such as the companys revenue by location, by type, top 5 expenses by account, top 5 expenses by department, cost of revenue year to date, etc. Present the topic in a bit more detail with this Cross Border Approach Dashboard For Tracking Post Expansion Revenue By Product Strategy SS V Use it as a tool for discussion and navigation on Expenses By Account, Revenue By Type, Expenses By Dept This template is free to edit as deemed fit for your organization. Therefore download it now.
-
 KPI Dashboard Tracking Revenue From Product Launch Event
This slide showcase KPI of product launch event. The main purpose of this dashboard is to keep track on revenue generated after event launch. This includes monthly revenue and no of product sold this quarter.Introducing our KPI Dashboard Tracking Revenue From Product Launch Event set of slides. The topics discussed in these slides are Monthly Revenue, Launch Event, Tracking Revenue. This is an immediately available PowerPoint presentation that can be conveniently customized. Download it and convince your audience.
-
 Network Marketing Software Dashboard Consumer Direct Marketing Strategies Sales Revenue MKT SS V
This slide represents metric dashboard for multi-level marketing software that helps marketers to track and monitor network participants progress. It covers details regarding training, sales etc. Deliver an outstanding presentation on the topic using this Network Marketing Software Dashboard Consumer Direct Marketing Strategies Sales Revenue MKT SS V. Dispense information and present a thorough explanation of Marketing, Software, Dashboard using the slides given. This template can be altered and personalized to fit your needs. It is also available for immediate download. So grab it now.
-
 Dashboard To Track Ecommerce Website Revenue And Traffic Ecommerce Marketing Ideas To Grow Online Sales
This slide showcases dashboard that can help organization to track the traffic and revenue of ecommerce website. Its key elements are ecommerce conversion rate, average order value, performance by traffic source, top product, performance by device category. Deliver an outstanding presentation on the topic using this Dashboard To Track Ecommerce Website Revenue And Traffic Ecommerce Marketing Ideas To Grow Online Sales. Dispense information and present a thorough explanation of Transactions, Revenue, Ecommerce Conversion Rate using the slides given. This template can be altered and personalized to fit your needs. It is also available for immediate download. So grab it now.
-
 Dashboard For EHR Implementation Plan Tracking Revenue Cycle
The following slide highlights EHR implementation plan dashboard for tracking revenue cycle. It includes components such as appointments, accounts receivable, patient payments, charges, adjustments, denials etc. Introducing our Dashboard For EHR Implementation Plan Tracking Revenue Cycle set of slides. The topics discussed in these slides are Implementation Plan, Tracking Revenue Cycle This is an immediately available PowerPoint presentation that can be conveniently customized. Download it and convince your audience.
-
 Bank Revenue Data Analysis And Management Dashboard
This slide consists of a dashboard that showcases bank revenue data analyses as it assist in the easy management of work done in banks. The points covered are revenue, expenses, profit by branch, trends, etc. Introducing our Bank Revenue Data Analysis And Management Dashboard set of slides. The topics discussed in these slides are Revenue By Branch, Expenses By Branch, Profit By Branch. This is an immediately available PowerPoint presentation that can be conveniently customized. Download it and convince your audience.
-
 Sales And Revenue Assessment KPI Dashboard Implementing Strategies For Business
Following slide exhibits dashboard that determine impact of environmental assessment on business performance. It includes indicators such as average operative cost, product model performance etc.Deliver an outstanding presentation on the topic using this Sales And Revenue Assessment KPI Dashboard Implementing Strategies For Business. Dispense information and present a thorough explanation of Environment Assessment, Product Models Performances, Average Operative using the slides given. This template can be altered and personalized to fit your needs. It is also available for immediate download. So grab it now.
-
 Deploying Techniques For Analyzing Sales And Revenue Assessment Kpi Dashboard
Following slide exhibits dashboard that determine impact of environmental assessment on business performance. It includes indicators such as average operative cost, product model performance etc. Present the topic in a bit more detail with this Deploying Techniques For Analyzing Sales And Revenue Assessment Kpi Dashboard. Use it as a tool for discussion and navigation on Average Operating Cost, Product Modelling Performance. This template is free to edit as deemed fit for your organization. Therefore download it now.
-
 Reducing Client Attrition Rate Measuring Net Retention And Revenue Churn With Kpi Dashboard
Mentioned slide outlines a comprehensive dashboard outlining the results of customer churn prevention strategies. The key performance indicators KPIs covered in the slide are net promoter score NPS, loyal customer rate, customer lifetime value CLV, revenue churn, net retention rate, etc. Present the topic in a bit more detail with this Reducing Client Attrition Rate Measuring Net Retention And Revenue Churn With Kpi Dashboard Use it as a tool for discussion and navigation on Customer Representatives, Our Products, Our Competitor This template is free to edit as deemed fit for your organization. Therefore download it now.
-
 Real Estate Development Financial Dashboard Showing Revenue
This slide showcases a financial dashboard for real estate development businesses. The purpose of this template is to provide businesses with details regarding top performance areas and the total revenue generated. It includes elements such as property referrals, latest sales, etc. Presenting our well structured Real Estate Development Financial Dashboard Showing Revenue. The topics discussed in this slide are Properties For Sale, Properties For Rent.This is an instantly available PowerPoint presentation that can be edited conveniently. Download it right away and captivate your audience.
-
 Property Leasing Revenue Evaluation Dashboard
This slide depicts dashboard for analysing revenue generation on monthly basis from property lease activities. It includes parameters such as property revenue summary, expiring leases, outstanding balances, last 30 days revenue and properties lease status. Introducing our Property Leasing Revenue Evaluation Dashboard set of slides. The topics discussed in these slides are Property Revenue Summary, Property Lease Status. This is an immediately available PowerPoint presentation that can be conveniently customized. Download it and convince your audience.
-
 Revenue Dashboard Of Omnichannel Marketing Data Collection Process For Omnichannel
This slide showcases dashboard capturing complete view of customers and store performance. This template focuses on allowing retailers to make more sales improving customer experiences. It includes information related to revenue by channels, cancellation rates, etc.Deliver an outstanding presentation on the topic using this Revenue Dashboard Of Omnichannel Marketing Data Collection Process For Omnichannel. Dispense information and present a thorough explanation of Revenue Growth, Revenue Channel, Cancellation Rate using the slides given. This template can be altered and personalized to fit your needs. It is also available for immediate download. So grab it now.
-
 Transnational Strategy Dashboard For Tracking Post Expansion Revenue By Product Type Strategy SS V
This slide covers the dashboard for analyzing fast food business sales by location. It includes KPIs such as the companys revenue by location, by type, top 5 expenses by account, top 5 expenses by department, cost of revenue year to date, etc. Deliver an outstanding presentation on the topic using this Transnational Strategy Dashboard For Tracking Post Expansion Revenue By Product Type Strategy SS V Dispense information and present a thorough explanation of Companys Revenue, Tracking Post Expansion, Product Type using the slides given. This template can be altered and personalized to fit your needs. It is also available for immediate download. So grab it now.
-
 Dashboard For Tracking Post Expansion Revenue By Product Type Worldwide Approach Strategy SS V
This slide covers the dashboard for analyzing fast food business sales by location. It includes KPIs such as the companys revenue by location, by type, top 5 expenses by account, top 5 expenses by department, cost of revenue year to date, etc. Deliver an outstanding presentation on the topic using this Dashboard For Tracking Post Expansion Revenue By Product Type Worldwide Approach Strategy SS V. Dispense information and present a thorough explanation of Expenses By Account, Dashboard using the slides given. This template can be altered and personalized to fit your needs. It is also available for immediate download. So grab it now.
-
 Sales And Revenue Assessment KPI Dashboard Understanding Factors Affecting
Following slide exhibits dashboard that determine impact of environmental assessment on business performance. It includes indicators such as average operative cost, product model performance etc. Present the topic in a bit more detail with this Sales And Revenue Assessment KPI Dashboard Understanding Factors Affecting. Use it as a tool for discussion and navigation on Environment Assessment, Product Modelling Performance, Revenue Earned. This template is free to edit as deemed fit for your organization. Therefore download it now.
-
 Dashboard For Tracking Post Expansion Revenue By Product Globalization Strategy To Expand Strategt SS V
This slide covers the dashboard for analyzing fast food business sales by location. It includes KPIs such as the companys revenue by location, by type, top 5 expenses by account, top 5 expenses by department, cost of revenue year to date, etc. Deliver an outstanding presentation on the topic using this Dashboard For Tracking Post Expansion Revenue By Product Globalization Strategy To Expand Strategt SS V. Dispense information and present a thorough explanation of Companys Revenue, Expenses By Account, Product Type using the slides given. This template can be altered and personalized to fit your needs. It is also available for immediate download. So grab it now.
-
 Retail Metaverse Dashboard For Tracking Revenue
This slide showcases dashboard for retail metaverse. The main purpose of this slide is tracking revenue earned by organizations by introducing metaverse. This includes total sales, customer satisfaction, and retention, net Revenue, etc. Introducing our Retail Metaverse Dashboard For Tracking Revenue set of slides. The topics discussed in these slides are Total Sales, Net Revenue. This is an immediately available PowerPoint presentation that can be conveniently customized. Download it and convince your audience.
-
 Developing An Effective Kpi Dashboard For Tracking Business Revenue Strategy SS V
This slide covers KPI dashboard for analysing metrices such as new customers, sales revenue, profit, monthly sales growth, average weekly sales revue, average revenue per unit, customer lifetime value, etc. Present the topic in a bit more detail with this Developing An Effective Kpi Dashboard For Tracking Business Revenue Strategy SS V Use it as a tool for discussion and navigation on Average Revenue Per Unit, Customer Lifetime Value, Customer Acquisition Cost This template is free to edit as deemed fit for your organization. Therefore download it now.
-
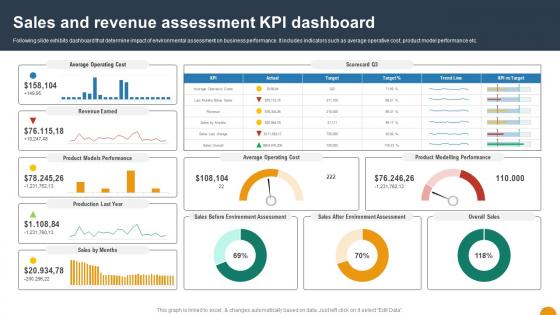 Sales And Revenue Assessment KPI Dashboard Using SWOT Analysis For Organizational
Following slide exhibits dashboard that determine impact of environmental assessment on business performance. It includes indicators such as average operative cost, product model performance etc. Deliver an outstanding presentation on the topic using this Sales And Revenue Assessment KPI Dashboard Using SWOT Analysis For Organizational. Dispense information and present a thorough explanation of Sales Before, Sales After using the slides given. This template can be altered and personalized to fit your needs. It is also available for immediate download. So grab it now.
-
 Sales And Revenue Assessment KPI Dashboard Environmental Scanning For Effective
Following slide exhibits dashboard that determine impact of environmental assessment on business performance. It includes indicators such as average operative cost, product model performance etc.Present the topic in a bit more detail with this Sales And Revenue Assessment KPI Dashboard Environmental Scanning For Effective. Use it as a tool for discussion and navigation on Determine Information, Authentic Sources, Environmental Factors. This template is free to edit as deemed fit for your organization. Therefore download it now.
-
 Revenue Generation Dashboard Of Restaurant Business Digital And Offline Restaurant
This slide shows the KPI dashboards of restaurant business revenue generation to generate more leads. It includes KPIs such as total sales, margin ,profit, etc. Present the topic in a bit more detail with this Revenue Generation Dashboard Of Restaurant Business Digital And Offline Restaurant Use it as a tool for discussion and navigation on Restaurant Evaluation, Revenue, Restaurant Business This template is free to edit as deemed fit for your organization. Therefore download it now.
-
 Retail Expansion Strategies To Grow Retail Sales Dashboard For Generating Higher Revenue
This slide showcases dashboard for retail expansion. This template focuses on tracking level of customer engagement and monthly conversions. It includes information related to sales by state, current and pending conversions of the month, etc. Deliver an outstanding presentation on the topic using this Retail Expansion Strategies To Grow Retail Sales Dashboard For Generating Higher Revenue. Dispense information and present a thorough explanation of Retail Sales Dashboard, Generating Higher Revenue, Customer Engagement, Monthly Conversions using the slides given. This template can be altered and personalized to fit your needs. It is also available for immediate download. So grab it now.
-
 Transforming From Traditional Dashboard Analytics Measuring Impact On User Metrics And Revenue DT SS
This slide analyzes the impact od digital business model innovation on user metrics and recurring revenue of business. It tracks KPIs such as monthly recurring revenue, revenue growth, active users, life time value, cost of customer acquisition, churn rate, growth by channel, subscription plan, etc. Present the topic in a bit more detail with this Transforming From Traditional Dashboard Analytics Measuring Impact On User Metrics And Revenue DT SS Use it as a tool for discussion and navigation on Monthly Recurring Revenue, Monthly Revenue Growth, Active Users This template is free to edit as deemed fit for your organization. Therefore download it now.
-
 Partner Performance Dashboard To Measure Revenue And Deals Nurturing Relationships
This slide examines the partner performance dashboard. It tracks key performance indicators such as revenue, pipeline forecast and actual pipeline close. Deliver an outstanding presentation on the topic using this Partner Performance Dashboard To Measure Revenue And Deals Nurturing Relationships Dispense information and present a thorough explanation of Revenue, Pipeline, Partner Performance using the slides given. This template can be altered and personalized to fit your needs. It is also available for immediate download. So grab it now.
-
 Dashboard For Monitoring Revenue In Sales Plan
This slide showcases the dashboard to evaluate revenue in sales plan. Its purpose is to understand customer satisfaction level and sales pipeline. It includes overall revenue, customer engagement and areas of development, etc. Introducing our Dashboard For Monitoring Revenue In Sales Plan set of slides. The topics discussed in these slides are Customer Satisfaction, Support. This is an immediately available PowerPoint presentation that can be conveniently customized. Download it and convince your audience.
-
 Online Gaming KPI Dashboard With Total Revenue Transforming Future Of Gaming IoT SS
The following slide showcases virtual gaming key performance indicator KPI dashboard. The major metrics mentioned in slide are total sales, high rated games, gamers gender breakdown, gamers age groups, average time spent gaming per week, game market in different regions, etc. Present the topic in a bit more detail with this Online Gaming KPI Dashboard With Total Revenue Transforming Future Of Gaming IoT SS. Use it as a tool for discussion and navigation on Gamer Age Groups, Game Development Countries Revenue. This template is free to edit as deemed fit for your organization. Therefore download it now.
-
 Dashboard For Tracking Post Expansion Revenue Global Business Strategies Strategy SS V
This slide covers the dashboard for analyzing fast food business sales by location. It includes KPIs such as the companys revenue by location, by type, top 5 expenses by account, top 5 expenses by department, cost of revenue year to date, etc. Deliver an outstanding presentation on the topic using this Dashboard For Tracking Post Expansion Revenue Global Business Strategies Strategy SS V. Dispense information and present a thorough explanation of Health Department Reports, Competitor Analysis, Market Research using the slides given. This template can be altered and personalized to fit your needs. It is also available for immediate download. So grab it now.
-
 Monthly Sales Dashboard With Revenue B2B Outside Sales Strategy Development SA SS
This slide showcases a sales dashboard that provides the team with real time view of their performance by displaying key metrics such as total accounts, orders per month, average contract, growth rate, sales growth by market segment, etc. Present the topic in a bit more detail with this Monthly Sales Dashboard With Revenue B2B Outside Sales Strategy Development SA SS. Use it as a tool for discussion and navigation on Market Segment, Average Contract, Growth Rate. This template is free to edit as deemed fit for your organization. Therefore download it now.
-
 Revenue Manufacturing Analysis Process Dashboard
This slide consists of manufacturing analysis dashboard. Its purpose is to show production volume, quantity. This slide includes active equipment, quantity ordered, revenue, returned items.Introducing our Revenue Manufacturing Analysis Process Dashboard set of slides. The topics discussed in these slides are Production Volume, Quantity Ordered, Returned Items Reason. This is an immediately available PowerPoint presentation that can be conveniently customized. Download it and convince your audience.
-
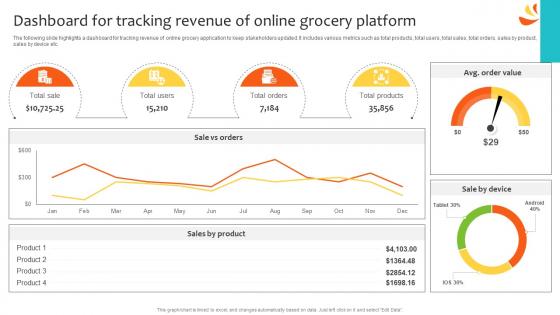 Dashboard For Tracking Revenue Of Online Navigating Landscape Of Online Grocery Shopping
The following slide highlights a dashboard for tracking revenue of online grocery application to keep stakeholders updated. It includes various metrics such as total products, total users, total sales, total orders, sales by product, sales by device etc. Present the topic in a bit more detail with this Dashboard For Tracking Revenue Of Online Navigating Landscape Of Online Grocery Shopping. Use it as a tool for discussion and navigation on Dashboard, Tracking Revenue, Online Grocery Platform. This template is free to edit as deemed fit for your organization. Therefore download it now.
-
 Customer Service Performance Analysis Dashboard Effective Revenue Optimization Strategy SS
The following slide showcases key performance analysis dashboard for customer services. It includes elements such as number of request answered, total revenue, costs per support, customer retention, time to solve issue, etc. Deliver an outstanding presentation on the topic using this Customer Service Performance Analysis Dashboard Effective Revenue Optimization Strategy SS. Dispense information and present a thorough explanation of Requests Answered, Requests, Costs To Revenue using the slides given. This template can be altered and personalized to fit your needs. It is also available for immediate download. So grab it now.
-
 Retail Store Total Revenue Assessment Dashboard Effective Revenue Optimization Strategy SS
The following slide depicts key performance indicators of revenue dashboard to monitor results. It includes elements such as maintenance, products, services, actual, budgeted, variance, etc. Present the topic in a bit more detail with this Retail Store Total Revenue Assessment Dashboard Effective Revenue Optimization Strategy SS. Use it as a tool for discussion and navigation on Retail Store, Revenue Assessment Dashboard. This template is free to edit as deemed fit for your organization. Therefore download it now.
-
 Sales Order Summary KPI Dashboard Of E Commerce Store Effective Revenue Optimization Strategy SS
The following slide showcases monthly and half-yearly order summary. It includes elements such as revenue days, refund, transaction status, paid, unpaid, subscriptions, current and previous details, etc. Present the topic in a bit more detail with this Sales Order Summary KPI Dashboard Of E Commerce Store Effective Revenue Optimization Strategy SS. Use it as a tool for discussion and navigation on Sales Order Summary, KPI Dashboard, E Commerce Store. This template is free to edit as deemed fit for your organization. Therefore download it now.
-
 Revenue And Cost Evaluation Dashboard For Effective Business Strategy
This slide depicts a dashboard for analysing revenue and cost transactions of businesses to make make efficient and effective cost optimization strategy. It includes key metrics such as current revenue, last years revenue, customer acquisition cost, and customer lifetime value etc., Introducing our Revenue And Cost Evaluation Dashboard For Effective Business Strategy set of slides. The topics discussed in these slides are Revenue, Cost Evaluation Dashboard, Effective Business Strategy This is an immediately available PowerPoint presentation that can be conveniently customized. Download it and convince your audience.
-
 Financial Planning Analytical Dashboard With Revenue Variance
This slide shows the dashboard representing financial planning of an organization. It highlights the set revenue targets and actual revenue with the help of graphs. Presenting our well structured Financial Planning Analytical Dashboard With Revenue Variance. The topics discussed in this slide are Revenue Detail, Revenue Variance, Revenue Delta. This is an instantly available PowerPoint presentation that can be edited conveniently. Download it right away and captivate your audience.
-
 SaaS Revenue Dashboard Showing MRR Breakdown
This slide showcases MRR division in SaaS profit dashboard. The purpose of this template is to assist businesses in understanding revenue sources and trends for effective business planning and growth. It includes elements such as net MRR change, upgrades MRR, etc. Introducing our SaaS Revenue Dashboard Showing MRR Breakdown set of slides. The topics discussed in these slides are Net MRR Change, New Subscribers, Abandonment MRR. This is an immediately available PowerPoint presentation that can be conveniently customized. Download it and convince your audience.
-
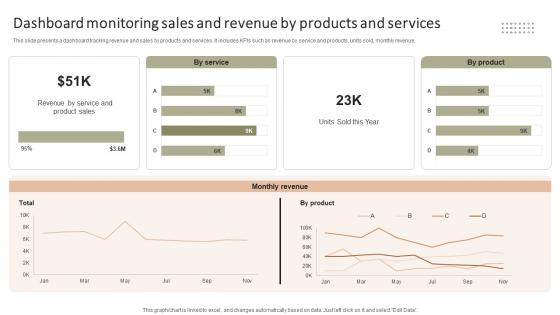 Dashboard Monitoring Sales And Revenue By Improving Client Experience And Sales Strategy SS V
This slide presents a dashboard tracking revenue and sales by products and services. It includes KPIs such as revenue by service and products, units sold, monthly revenue. Deliver an outstanding presentation on the topic using this Dashboard Monitoring Sales And Revenue By Improving Client Experience And Sales Strategy SS V. Dispense information and present a thorough explanation of Monthly Revenue, By Service, By Product using the slides given. This template can be altered and personalized to fit your needs. It is also available for immediate download. So grab it now.
-
 Omnichannel Revenue Dashboard To Track Performance
This slide showcases dashboard capturing the complete view of customers and store performance. This template focuses on allowing retailers to make more sales And improve customer experiences. It includes information related to revenue by channels, cancellation rates, etc. Presenting our well structured Omnichannel Revenue Dashboard To Track Performance The topics discussed in this slide are Strategies Opted, Impact, Challenges Faced By OrganisationThis is an instantly available PowerPoint presentation that can be edited conveniently. Download it right away and captivate your audience.
-
 E Commerce Strategy Dashboard For Revenue Growth
The purpose of this slide is enhance e-commerce revenue growth with strategic insights from a comprehensive strategy dashboard, optimizing sales channels, and enhancing customer experiences. Introducing our E Commerce Strategy Dashboard For Revenue Growth set of slides. The topics discussed in these slides are Strategy, Dashboard, Growth. This is an immediately available PowerPoint presentation that can be conveniently customized. Download it and convince your audience.
-
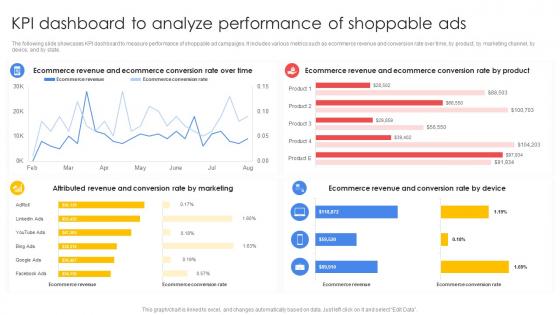 Improving E Commerce Revenue KPI Dashboard To Analyze Performance
The following slide showcases KPI dashboard to measure performance of shoppable ad campaigns. It includes various metrics such as ecommerce revenue and conversion rate over time, by product, by marketing channel, by device, and by state. Present the topic in a bit more detail with this Improving E Commerce Revenue KPI Dashboard To Analyze Performance. Use it as a tool for discussion and navigation on Ecommerce Revenue, Ecommerce Conversion Rate Over Time. This template is free to edit as deemed fit for your organization. Therefore download it now.
-
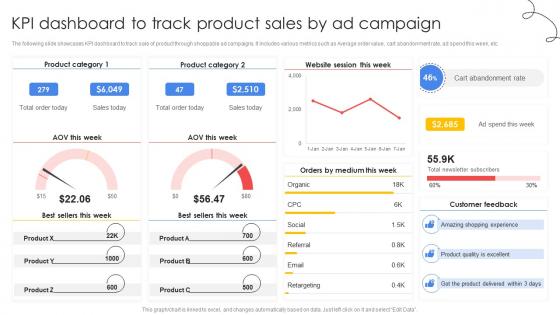 Improving E Commerce Revenue KPI Dashboard To Track Product Sales By Ad
The following slide showcases KPI dashboard to track sale of product through shoppable ad campaigns. It includes various metrics such as Average order value, cart abandonment rate, ad spend this week, etc. Present the topic in a bit more detail with this Improving E Commerce Revenue KPI Dashboard To Track Product Sales By Ad. Use it as a tool for discussion and navigation on Amazing Shopping Experience, Product Quality Is Excellent, Cart Abandonment Rate. This template is free to edit as deemed fit for your organization. Therefore download it now.
-
 Marketing Kpi Dashboard With Sales Revenue Driving Company Retail Sales SA SS
The purpose of this slide is to evaluate performance of implementing online and offline marketing strategies in the form of analytical dashboard. Present the topic in a bit more detail with this Marketing Kpi Dashboard With Sales Revenue Driving Company Retail Sales SA SS. Use it as a tool for discussion and navigation on Marketing KPI Dashboard, Sales Revenue, Analytical Dashboard, Evaluate Performance. This template is free to edit as deemed fit for your organization. Therefore download it now.
-
 Developing Customer Centric Retention Customer Retention Dashboard To Track Revenue Growth SA SS
This slide includes dashboard to track impact of potential campaign or program on specific KPIs such as monthly recurring revenue, monthly revenue growth, churn rate, cost of customer acquisition, active users, etc. Present the topic in a bit more detail with this Developing Customer Centric Retention Customer Retention Dashboard To Track Revenue Growth SA SS. Use it as a tool for discussion and navigation on Customer Retention Dashboard, Track Revenue Growth, Churn Rate, Cost Of Customer Acquisition. This template is free to edit as deemed fit for your organization. Therefore download it now.
-
 Monthly Recurring Revenue Breakdown Dashboard
This slide carries the financial dashboard to analyze various types of MRR generated or lost in a year. Various types of MRR calculated are changes in net MRR and MRR from upgrades, cancellations, downgrades, etc. Introducing our Monthly Recurring Revenue Breakdown Dashboard set of slides. The topics discussed in these slides are Downgrades MRR, Reactivations MRR, Cancellations MRR. This is an immediately available PowerPoint presentation that can be conveniently customized. Download it and convince your audience.
-
 Performance Tracking Dashboard For Saas Recurring Revenue Model
This slide demonstrates the financial dashboard to measure the performance of a company using the SaaS Subscription-as-a-Service model. Various KPIs tracked are MRR, customer acquisition costs, runway, customers, etc. Presenting our well structured Performance Tracking Dashboard For Saas Recurring Revenue Model. The topics discussed in this slide are MRR, New MRR, Customer Acquisition Cost. This is an instantly available PowerPoint presentation that can be edited conveniently. Download it right away and captivate your audience.
-
 Recurring Revenue Monitoring Dashboard For Startup Business
This slide mentions the dashboard used by startup businesses to track their monthly recurring revenue. Various KPIs involved are MRR, ARPU, annual run rate, Churn, live stream, and lifetime value. Presenting our well structured Recurring Revenue Monitoring Dashboard For Startup Business. The topics discussed in this slide are Annual Run Rate, Live Stream, Churn. This is an instantly available PowerPoint presentation that can be edited conveniently. Download it right away and captivate your audience.
-
 Saas Company Dashboard To Track Monthly Recurring Revenue
This slide illustrates the dashboard to monitor the recurring revenue generated in a month. It includes KPIs Key Performance Indicators such as cumulative MRR, changes in MRR, total MRR, daily active users, etc. Introducing our premium set of slides with Saas Company Dashboard To Track Monthly Recurring Revenue. Ellicudate the two stages and present information using this PPT slide. This is a completely adaptable PowerPoint template design that can be used to interpret topics like Changes MRR, Cumulative MRR, Daily Sign Ups. So download instantly and tailor it with your information.
-
 Content Monetization Revenue Analytics Dashboard
The below slide provides a content monetization dashboard analytics that keeps a track of revenue generated from different devices. It provides insights such as total revenue, paying device, etc. Introducing our Content Monetization Revenue Analytics Dashboard set of slides. The topics discussed in these slides are Revenue, Average Revenue Per Daily Active Device, Average Revenue Per Paying Device. This is an immediately available PowerPoint presentation that can be conveniently customized. Download it and convince your audience.
-
 Revenue Projection Dashboard For Sales Analysis
This slide depicts dashboard representing revenue projection analysis to highlight key headings which includes revenue forecast by type, units sold forecast, forecasting accuracy, sales type, average sales price trend and revenue trend. Introducing our Revenue Projection Dashboard For Sales Analysis set of slides. The topics discussed in these slides are Revenue Forecast By Type, Units Sold Forecast. This is an immediately available PowerPoint presentation that can be conveniently customized. Download it and convince your audience.
-
 Icon Highlighting SaaS Dashboard For Monitoring Revenue Growth
Presenting our set of slides with Icon Highlighting SaaS Dashboard For Monitoring Revenue Growth. This exhibits information on three stages of the process. This is an easy to edit and innovatively designed PowerPoint template. So download immediately and highlight information on Highlighting SaaS Dashboard, Monitoring Revenue Growth.
-
 Driver Tree Dashboard To Influence Company Revenue
This slide showcases representation and analysis of key drivers impacting company revenue through driver tree. It includes metrics such as number of sales transactions, average transaction value, number of clients, etc. Presenting our set of slides with Driver Tree Dashboard To Influence Company Revenue. This exhibits information on two stages of the process. This is an easy to edit and innovatively designed PowerPoint template. So download immediately and highlight information on Revenue, Dashboard, Transactions.
-
 Dashboard reporting for hotel with revenue per available room
Introducing our Dashboard Reporting For Hotel With Revenue Per Available Room set of slides. The topics discussed in these slides are Revenue, Average, Budget. This is an immediately available PowerPoint presentation that can be conveniently customized. Download it and convince your audience.


