Powerpoint Templates and Google slides for Reports And Dashboards
Save Your Time and attract your audience with our fully editable PPT Templates and Slides.
-
 Dashboard For Weekly Progress Report With Open Risks And Issues
This slide displays dashboard to analyze overall project health and keep a track of weekly progress. It includes details such as schedule, task, budget and resource. Presenting our well structured Dashboard For Weekly Progress Report With Open Risks And Issues. The topics discussed in this slide are Progress, Report, Issues. This is an instantly available PowerPoint presentation that can be edited conveniently. Download it right away and captivate your audience.
-
 Weekly Progress Dashboard With Project Report And Timeline
This slide showcases progress dashboard to track overall pace of operations in organization on weekly basis. It includes details about task status, budget, risks, issues, timeline, etc. Introducing our Weekly Progress Dashboard With Project Report And Timeline set of slides. The topics discussed in these slides are Progress, Report, Timeline. This is an immediately available PowerPoint presentation that can be conveniently customized. Download it and convince your audience.
-
 ESG Data Reporting And Management Dashboard Global Green Technology And Sustainability
The following slide showcases a dashboard for tracking and managing data of economic, social and global goals. It provides information about ESG score breakdown by region, MV weight and MTD return by sector, fund vs. sector ESG score, lowest rated companies with MV weight over 1, etc. Present the topic in a bit more detail with this ESG Data Reporting And Management Dashboard Global Green Technology And Sustainability Use it as a tool for discussion and navigation on Score Breakdown By Region, Return By Sector This template is free to edit as deemed fit for your organization. Therefore download it now.
-
 Dashboard For Monitoring And Reporting Financial Budgets
This slide brings forth dashboard for monitoring and reporting the financial budgets of various branches of an enterprise emphasis on income and expenditure by each branch. The key performing indicators are actual vs budgeted revenue, revenue distribution by branches etc. Introducing our Dashboard For Monitoring And Reporting Financial Budgets set of slides. The topics discussed in these slides are Current Revenue, Current Operating Income This is an immediately available PowerPoint presentation that can be conveniently customized. Download it and convince your audience.
-
 Farm Planning And Budgeting Based On Dashboard Report
Following slide presents a dashboard that will assist farmers in planning and budgeting based on the key performance indicators. The key performance indicators are crop name, area, last production, current temperature, etc. Introducing our Farm Planning And Budgeting Based On Dashboard Report set of slides. The topics discussed in these slides are Planning, Budgeting, Report. This is an immediately available PowerPoint presentation that can be conveniently customized. Download it and convince your audience.
-
 Quality control kpi dashboard showing reported issues and priority
Presenting this set of slides with name - Quality Control Kpi Dashboard Showing Reported Issues And Priority. This is a four stage process. The stages in this process are Quality Management, Quality Control, Quality Assurance.
-
 Audit kpi dashboard of operating systems manufacturer report and model report
Presenting this set of slides with name - Audit Kpi Dashboard Of Operating Systems Manufacturer Report And Model Report. This is a five stage process. The stages in this process are Audit, Examine, Survey.
-
 Vendor kpi dashboard showing gross sales earnings sold and sales report
Presenting this set of slides with name - Vendor Kpi Dashboard Showing Gross Sales Earnings Sold And Sales Report. This is a four stage process. The stages in this process are Vendor, Supplier, Retailer.
-
 Executing reporting kpi dashboard showing sales opportunity and sales booking
Presenting this set of slides with name - Executing Reporting Kpi Dashboard Showing Sales Opportunity And Sales Booking. This is a four stage process. The stages in this process are Executive Reporting, Executive Analysis, Executive Performance.
-
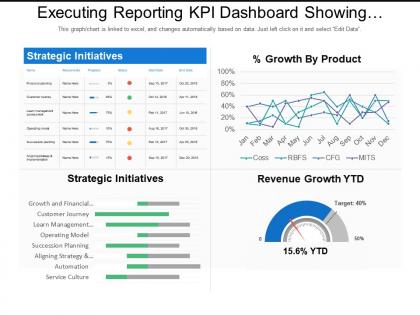
 Executing reporting kpi dashboard showing strategic initiatives and percentage growth by product
Presenting this set of slides with name - Executing Reporting Kpi Dashboard Showing Strategic Initiatives And Percentage Growth By Product. This is a four stage process. The stages in this process are Executive Reporting, Executive Analysis, Executive Performance.
-
 Executing reporting kpi dashboard showing trading summary performance summary and sales ratio
Presenting this set of slides with name - Executing Reporting Kpi Dashboard Showing Trading Summary Performance Summary And Sales Ratio. This is a four stage process. The stages in this process are Executive Reporting, Executive Analysis, Executive Performance.
-
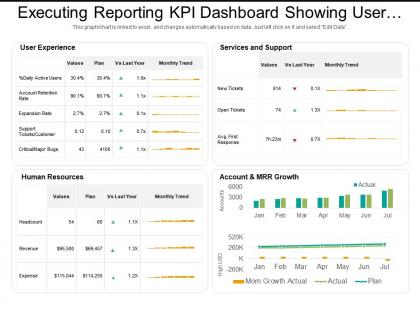
 Executing reporting kpi dashboard showing user experience and human resources
Presenting this set of slides with name - Executing Reporting Kpi Dashboard Showing User Experience And Human Resources. This is a five stage process. The stages in this process are Executive Reporting, Executive Analysis, Executive Performance.
-
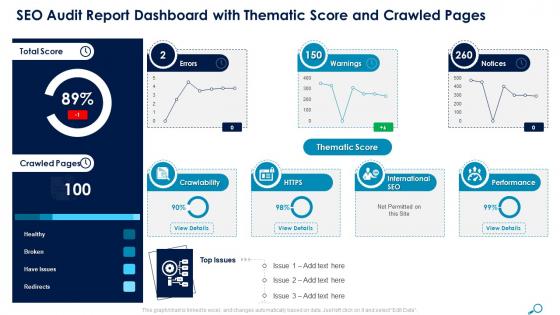
 Seo audit report dashboard with thematic score and crawled pages ppt infographics skills
The slide shows the SEO Audit Report factors and descriptions that must be kept in mind in order to resolve issues and improve organic results such as dead end pages, long URLs, page not found and duplicate content along with the relevant action plan of each description. Deliver an outstanding presentation on the topic using this Seo Audit Report Dashboard With Thematic Score And Crawled Pages Ppt Infographics Skills. Dispense information and present a thorough explanation of SEO Audit Report Descriptions Of The Company using the slides given. This template can be altered and personalized to fit your needs. It is also available for immediate download. So grab it now.
-
 Maintenance Dashboard For Monitoring And Reporting Operations
This slide focuses on dashboard to digitize production planning which includes order status, current status, advance warning, last backup, maintenance summary, invalid order with pending notifications, orders and redbox. Introducing our Maintenance Dashboard For Monitoring And Reporting Operations set of slides. The topics discussed in these slides are Dashboard, Advance Warning, Maintenance Technicians. This is an immediately available PowerPoint presentation that can be conveniently customized. Download it and convince your audience.
-
 SEO Audit Report Dashboard With Site Audit And Backlink Audit
Present the topic in a bit more detail with this SEO Audit Report Dashboard With Site Audit And Backlink Audit. Use it as a tool for discussion and navigation on Social Media Tracker, Brand Monitoring, Backlink Audit. This template is free to edit as deemed fit for your organization. Therefore download it now.
-
 Human Resources Monthly Report Dashboard Colored Icon In Powerpoint Pptx Png And Editable Eps Format
Make your presentation profoundly eye-catching leveraging our easily customizable Human resources monthly report dashboard colored icon in powerpoint pptx png and editable eps format. It is designed to draw the attention of your audience. Available in all editable formats, including PPTx, png, and eps, you can tweak it to deliver your message with ease.
-
 Human Resources Monthly Report Dashboard Monotone Icon In Powerpoint Pptx Png And Editable Eps Format
Give your next presentation a sophisticated, yet modern look with this 100 percent editable Human resources monthly report dashboard monotone icon in powerpoint pptx png and editable eps format. Choose from a variety of customizable formats such as PPTx, png, eps. You can use these icons for your presentations, banners, templates, One-pagers that suit your business needs.
-
 SLA Dashboard Snapshot With Sales And Product Report
Introducing our SLA Dashboard Snapshot With Sales And Product Report set of slides. The topics discussed in these slides are Marketing, Finance, Service And Supports. This is an immediately available PowerPoint presentation that can be conveniently customized. Download it and convince your audience.
-
 Dashboard Report Colored Icon In Powerpoint Pptx Png And Editable Eps Format
Give your next presentation a sophisticated, yet modern look with this 100 percent editable Dashboard report colored icon in powerpoint pptx png and editable eps format. Choose from a variety of customizable formats such as PPTx, png, eps. You can use these icons for your presentations, banners, templates, One-pagers that suit your business needs.
-
 Dashboard Report Monotone Icon In Powerpoint Pptx Png And Editable Eps Format
Make your presentation profoundly eye-catching leveraging our easily customizable Dashboard report monotone icon in powerpoint pptx png and editable eps format. It is designed to draw the attention of your audience. Available in all editable formats, including PPTx, png, and eps, you can tweak it to deliver your message with ease.
-
 Transportation Reporting And Analytics Dashboard Snapshot
The following slide highlights the transportation reporting and analytics dashboard snapshot illustrating total order on time pick up, on time delivery, delivery efficiency, shipment lead time, carrier details and address specific pick up, delivery and transit time reports. Presenting our well structured Transportation Reporting And Analytics Dashboard. The topics discussed in this slide are Analytics, Dashboard, Transportation. This is an instantly available PowerPoint presentation that can be edited conveniently. Download it right away and captivate your audience.
-
 Monthly Sales Reporting And Forecasting Dashboard Icon
Introducing our premium set of slides with name Monthly Sales Reporting And Forecasting Dashboard Icon. Ellicudate the three stages and present information using this PPT slide. This is a completely adaptable PowerPoint template design that can be used to interpret topics like Monthly Sales, Reporting, Forecasting, Dashboard Icon. So download instantly and tailor it with your information.
-
 Environmental Social And Governance Dashboard Report Icon
Introducing our premium set of slides with name Environmental Social And Governance Dashboard Report Icon. Ellicudate the three stages and present information using this PPT slide. This is a completely adaptable PowerPoint template design that can be used to interpret topics like Environmental, Social And Governance Dashboard Report Icon. So download instantly and tailor it with your information.
-
 0314 business reports and dashboards
High resolution PPT slides providing to all the needs related to achieving quick goals. We have prepared PowerPoint info graphics of smart goals. Related content with flexible data. Can be easily transformed to PDF and JPF format. Useful for students, researchers, business professional and corporative people. Excellent graphs for comparison and fascinating figures to illustrate the concept. Adjustable background with colour, layout, and font.
-
 Data warehouse with reporting budgeting and dashboards
Presenting this set of slides with name Data Warehouse With Reporting Budgeting And Dashboards. This is a six stage process. The stages in this process are Reporting, Budgeting, Dashboard, Data Ware House, CRM, ERP, Other File Source. This is a completely editable PowerPoint presentation and is available for immediate download. Download now and impress your audience.
-
 Individual health and activity report dashboard snapshot
Presenting this set of slides with name Individual Health And Activity Report Dashboard Snapshot. The topics discussed in these slide is Individual Health And Activity Report Dashboard. This is a completely editable PowerPoint presentation and is available for immediate download. Download now and impress your audience.
-
 Project and task tracker report dashboard snapshot
Presenting this set of slides with name Project And Task Tracker Report Dashboard Snapshot. The topics discussed in these slides are Cost, Progress, Workload. This is a completely editable PowerPoint presentation and is available for immediate download. Download now and impress your audience.
-
 Human resource reporting and analytics dashboard with employee performance kpi
Presenting our well structured Human Resource Reporting And Analytics Dashboard With Employee Performance KPI. The topics discussed in this slide are Human Resource Reporting, Analytics Dashboard, Employee Performance KPI. This is an instantly available PowerPoint presentation that can be edited conveniently. Download it right away and captivate your audience.
-
 Procurement cost savings planning and reporting dashboard snapshot
Presenting our well-structured Procurement Cost Savings Planning And Reporting Dashboard Snapshot . The topics discussed in this slide are Savings By Department, Savings By Year, Actual Vs Target, Savings By Category, Savings By Team Members, Savings By Business Unit. This is an instantly available PowerPoint presentation that can be edited conveniently. Download it right away and captivate your audience.
-
 Health and safety dashboard showing organization incident reports
Presenting our well structured Health And Safety Dashboard Showing Organization Incident Reports. The topics discussed in this slide are Reported Injuries, Serious Incidents, Lost Time Incidents. This is an instantly available PowerPoint presentation that can be edited conveniently. Download it right away and captivate your audience.
-
 Financial management reporting dashboard with debt and equity ratio
Presenting our well-structured Financial Management Reporting Dashboard With Debt And Equity Ratio. The topics discussed in this slide are Equity Ratio, Debt Equity, Gross Working Capital. This is an instantly available PowerPoint presentation that can be edited conveniently. Download it right away and captivate your audience.
-
 Project risk monitoring and reporting dashboard construction project risk landscape ppt professional
This slide shows dashboard covering overall progress report of construction project by tracking cost reduction, procurement ROI, and top suppliers. Present the topic in a bit more detail with this Project Risk Monitoring And Reporting Dashboard Construction Project Risk Landscape Ppt Professional. Use it as a tool for discussion and navigation on Cost Reduction, Procurement Roi, Cost Of Purchase, Cost Reduction, Cost Saving. This template is free to edit as deemed fit for your organization. Therefore download it now.
-
 Learning And Development Training Sessions Dashboard Report
This slide covers learning and development reports highly used by companies such as course rating report, learner grades report, course progress report etc. to identify which report provides insightful feedback and data to users. Presenting our well structured Learning And Development Training Sessions Dashboard Report The topics discussed in this slide are Satisfaction Levels, Latest Sessions. This is an instantly available PowerPoint presentation that can be edited conveniently. Download it right away and captivate your audience.
-
 Learning And Development Workforce Activities Dashboard Report
This slide depicts a dashboard of learning and development training session report analysis to monitor and optimize employee skill enhancement. It includes session satisfaction level, latest sessions, attendees score etc. Introducing our Learning And Development Workforce Activities Dashboard Report set of slides. The topics discussed in these slides are Current Course Status, Community Ranked, Completed Courses. This is an immediately available PowerPoint presentation that can be conveniently customized. Download it and convince your audience.
-
 Web Design Learning And Development Dashboard Report
This slide outlines categories of development and learning reports for organizations to assess and optimize employee growth through strategic insights. It involves reports such as learner progress report, learner participation report, learner satisfaction report etc. Introducing our Web Design Learning And Development Dashboard Report set of slides. The topics discussed in these slides are Hours Spent, Performance, Design Branding. This is an immediately available PowerPoint presentation that can be conveniently customized. Download it and convince your audience.


