Powerpoint Templates and Google slides for Reported Financial
Save Your Time and attract your audience with our fully editable PPT Templates and Slides.
-
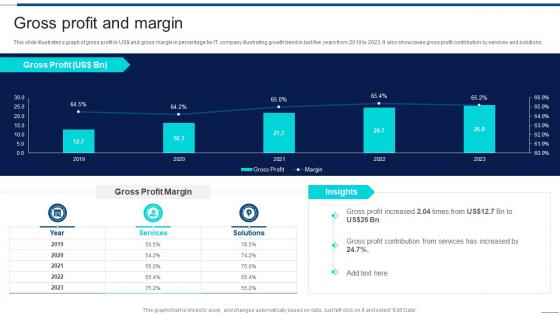 Gross Profit And Margin Information Technology Company Financial Report
This slide illustrates a graph of gross profit in US dollar and gross margin in percentage for IT company illustrating growth trend in last five years from 2019 to 2023. It also showcases gross profit contribution by services and solutions. Deliver an outstanding presentation on the topic using this Gross Profit And Margin Information Technology Company Financial Report. Dispense information and present a thorough explanation of Contribution, Services, Solutions using the slides given. This template can be altered and personalized to fit your needs. It is also available for immediate download. So grab it now.
-
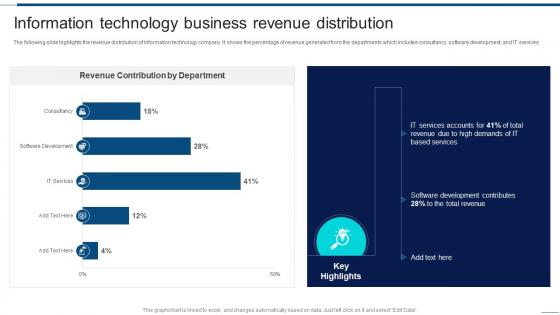 Information Technology Business Revenue Distribution Information Technology Company Financial Report
The following slide highlights the revenue distribution of information technology company. It shows the percentage of revenue generated from the departments which includes consultancy, software development, and IT services. Present the topic in a bit more detail with this Information Technology Business Revenue Distribution Information Technology Company Financial Report. Use it as a tool for discussion and navigation on Information, Technology, Business. This template is free to edit as deemed fit for your organization. Therefore download it now.
-
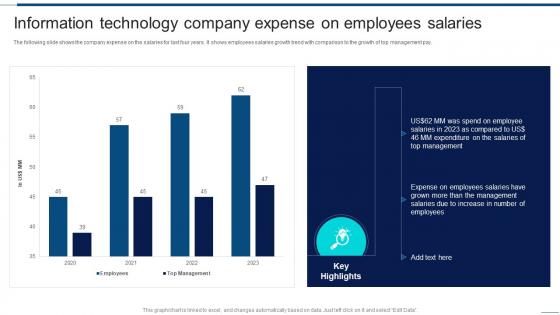 Information Technology Company Expense On Employees Information Technology Company Financial Report
The following slide shows the company expense on the salaries for last four years. It shows employees salaries growth trend with comparison to the growth of top management pay. Present the topic in a bit more detail with this Information Technology Company Expense On Employees Information Technology Company Financial Report. Use it as a tool for discussion and navigation on Information, Technology, Employees Salaries. This template is free to edit as deemed fit for your organization. Therefore download it now.
-
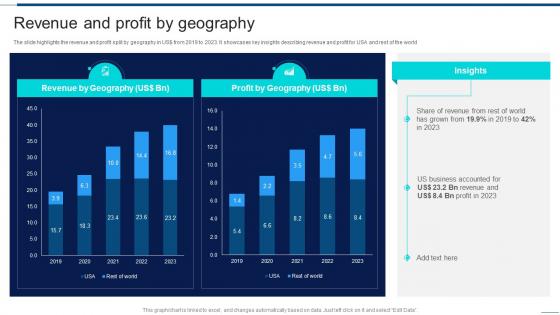 Information Technology Company Financial Report Revenue And Profit By Geography
The slide highlights the revenue and profit split by geography in US dollar from 2019 to 2023. It showcases key insights describing revenue and profit for USA and rest of the world Deliver an outstanding presentation on the topic using this Information Technology Company Financial Report Revenue And Profit By Geography. Dispense information and present a thorough explanation of Revenue, Geography, Business using the slides given. This template can be altered and personalized to fit your needs. It is also available for immediate download. So grab it now.
-
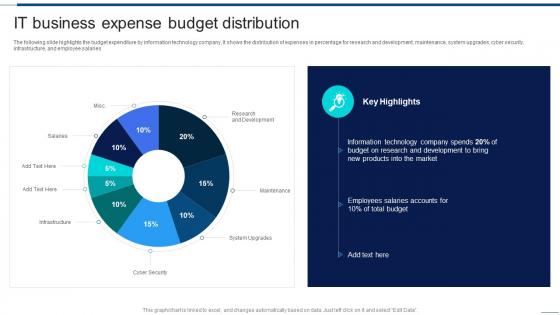 It Business Expense Budget Distribution Information Technology Company Financial Report
The following slide highlights the budget expenditure by information technology company, It shows the distribution of expenses in percentage for research and development, maintenance, system upgrades, cyber security, infrastructure, and employee salaries Deliver an outstanding presentation on the topic using this It Business Expense Budget Distribution Information Technology Company Financial Report. Dispense information and present a thorough explanation of Business, Distribution, Development using the slides given. This template can be altered and personalized to fit your needs. It is also available for immediate download. So grab it now.
-
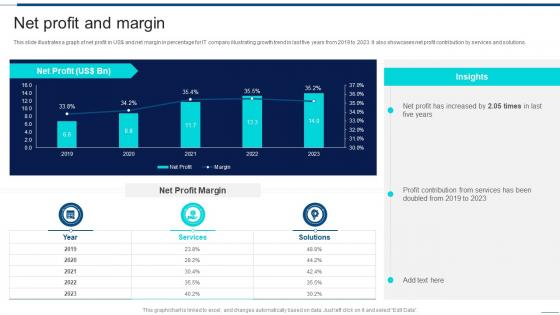 Net Profit And Margin Information Technology Company Financial Report
This slide illustrates a graph of net profit in US dollar and net margin in percentage for IT company illustrating growth trend in last five years from 2019 to 2023. It also showcases net profit contribution by services and solutions. Present the topic in a bit more detail with this Net Profit And Margin Information Technology Company Financial Report. Use it as a tool for discussion and navigation on Contribution, Services, Solutions. This template is free to edit as deemed fit for your organization. Therefore download it now.
-
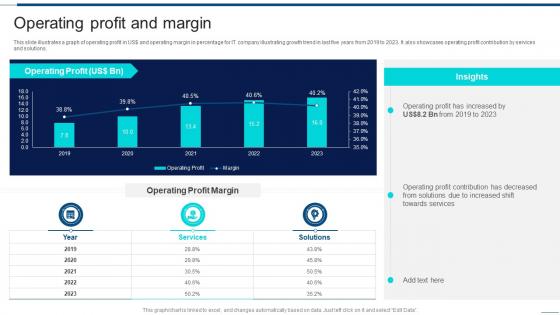 Operating Profit And Margin Information Technology Company Financial Report
This slide illustrates a graph of operating profit in US dollar and operating margin in percentage for IT company illustrating growth trend in last five years from 2019 to 2023. It also showcases operating profit contribution by services and solutions. Deliver an outstanding presentation on the topic using this Operating Profit And Margin Information Technology Company Financial Report. Dispense information and present a thorough explanation of Contribution, Solutions, Services using the slides given. This template can be altered and personalized to fit your needs. It is also available for immediate download. So grab it now.
-
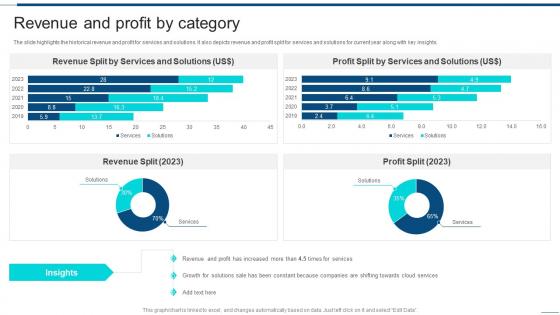 Revenue And Profit By Category Information Technology Company Financial Report
The slide highlights the historical revenue and profit for services and solutions. It also depicts revenue and profit split for services and solutions for current year along with key insights. Present the topic in a bit more detail with this Revenue And Profit By Category Information Technology Company Financial Report. Use it as a tool for discussion and navigation on Revenue, Services, Solutions. This template is free to edit as deemed fit for your organization. Therefore download it now.
-
 Table Of Contents Information Technology Company Financial Report
Introducing Table Of Contents Information Technology Company Financial Report to increase your presentation threshold. Encompassed with ten stages, this template is a great option to educate and entice your audience. Dispence information on Revenue, Geography, Company Financial Stats, using this template. Grab it now to reap its full benefits.
-
 Key Findings Of Financial Projection Report
The following slide showcases financial forecast of a business to let stakeholders know where the business is headed. The report covers projected revenue, website and blog traffic, churn rate, and customer retention rate. Introducing our Key Findings Of Financial Projection Report set of slides. The topics discussed in these slides are Website And Blog Traffic, Churn Rate, Growth Of Revenue. This is an immediately available PowerPoint presentation that can be conveniently customized. Download it and convince your audience.
-
 Construction Project Feasibility Report Project Feasibility Financial Ratios
Following slide covers project feasibility financial ratio along with graphical representation. Ratios included are net profit sales, quick ratio, debt equity ratio and gross profit sales. Present the topic in a bit more detail with this Construction Project Feasibility Report Project Feasibility Financial Ratios. Use it as a tool for discussion and navigation on Feasibility, Financial, Representation. This template is free to edit as deemed fit for your organization. Therefore download it now.
-
 Financial Services Corporate Governance Report
This slide covers report on governance of an investment company with corporate structure. It includes elements such as composition of board members, board expertise areas, governance structure, statistics of board diversity etc. Introducing our Financial Services Corporate Governance Report set of slides. The topics discussed in these slides are Corporate Governance Report, Gender Diversity, Racial Diversity. This is an immediately available PowerPoint presentation that can be conveniently customized. Download it and convince your audience.
-
 Business Segments Yearly Growth Comparison Healthcare Company Financial Report
The slide showcases the healthcare company business verticals and their revenue and profit comparison over the period of five years.Present the topic in a bit more detail with this Business Segments Yearly Growth Comparison Healthcare Company Financial Report. Use it as a tool for discussion and navigation on Comparative Profit, Profit Growth, Pharmacy. This template is free to edit as deemed fit for your organization. Therefore download it now.
-
 Comparative Analysis Of Revenue And Profit Distribution Healthcare Company Financial Report
The slide showcases the comparative analysis of revenue and profit distribution from six global regions. The regions included are south America, north America, Asia, Africa, Oceania, and Europe.Deliver an outstanding presentation on the topic using this Comparative Analysis Of Revenue And Profit Distribution Healthcare Company Financial Report. Dispense information and present a thorough explanation of Revenue Distribution, Profit Distribution, Region Contributes using the slides given. This template can be altered and personalized to fit your needs. It is also available for immediate download. So grab it now.
-
 Gross Profit And Margin Healthcare Company Financial Report
The slide describes gross profit share for FY23 from pharmacy, hospital and research business verticals and historical gross profit growth and margin along with description of statistical data.Present the topic in a bit more detail with this Gross Profit And Margin Healthcare Company Financial Report. Use it as a tool for discussion and navigation on Gross Profit, Business Units, Management Decision. This template is free to edit as deemed fit for your organization. Therefore download it now.
-
 Historical Revenue Healthcare Company Financial Report
The slide showcases company revenue for last five years, along with the revenue split by pharmacy, hospital and research business verticals for current year. It also depicts CAGR and key insights for revenue analysis.Deliver an outstanding presentation on the topic using this Historical Revenue Healthcare Company Financial Report. Dispense information and present a thorough explanation of Revenue Split, Company Revenue, Pandemic Induced using the slides given. This template can be altered and personalized to fit your needs. It is also available for immediate download. So grab it now.
-
 Hospital Business Annual Profit And Revenue Growth Healthcare Company Financial Report
The slide highlights the comparison of annual revenue and profit growth of the hospital business. It compares yearly profit and revenue change in percentage over the period of five years.Present the topic in a bit more detail with this Hospital Business Annual Profit And Revenue Growth Healthcare Company Financial Report. Use it as a tool for discussion and navigation on Revenue Growth, Profit Growth, Business Annual. This template is free to edit as deemed fit for your organization. Therefore download it now.
-
 Hospital Business Financials Healthcare Company Financial Report
The slide describes financial details for Hospital business vertical. It showcase revenue, gross profit, operating profit, EBIDTA and net profit along with margin.Deliver an outstanding presentation on the topic using this Hospital Business Financials Healthcare Company Financial Report. Dispense information and present a thorough explanation of Revenue Hospital, Business Increased, Hospitalization Rate using the slides given. This template can be altered and personalized to fit your needs. It is also available for immediate download. So grab it now.
-
 Hospital Business Profit Generation By Regions Healthcare Company Financial Report
The slide showcases the revenue earned by healthcare companies from different geographical regions. It shows south America, north America, Asia, Africa, Oceania, and Europe.Present the topic in a bit more detail with this Hospital Business Profit Generation By Regions Healthcare Company Financial Report. Use it as a tool for discussion and navigation on Historical Revenue, Hospital Business, Generation Regions. This template is free to edit as deemed fit for your organization. Therefore download it now.
-
 Hospital Business Revenue Generation By Healthcare Company Financial Report
The slide showcases the revenue earned by healthcare companies from different geographical regions. It shows south America, north America, Asia, Africa, Oceania, and Europe.Deliver an outstanding presentation on the topic using this Hospital Business Revenue Generation By Healthcare Company Financial Report. Dispense information and present a thorough explanation of Hospital Business, Revenue Generation, Regions Generation using the slides given. This template can be altered and personalized to fit your needs. It is also available for immediate download. So grab it now.
-
 Net Profit And Margin Healthcare Company Financial Report
The slide showcases the bottom line for healthcare group along with net profit margin for last five financial year. It also depict net profit share for FY22 from pharmacy, hospital and research business verticals.Present the topic in a bit more detail with this Net Profit And Margin Healthcare Company Financial Report. Use it as a tool for discussion and navigation on Profit Increased, Pharmacy Business, Major Contributor. This template is free to edit as deemed fit for your organization. Therefore download it now.
-
 Operating Profit And Margin Healthcare Company Financial Report
The slide showcases operating profit trend last five financial years along with profitability margin. It also showcases operating profit share for FY23 from pharmacy, hospital and research business verticals.Deliver an outstanding presentation on the topic using this Operating Profit And Margin Healthcare Company Financial Report. Dispense information and present a thorough explanation of Operating Profit, Increased Cost, Business Units using the slides given. This template can be altered and personalized to fit your needs. It is also available for immediate download. So grab it now.
-
 Monthly Financial Performance Result Reporting
This slide showcases a report showing monthly results financial performance to ensure constant revenue growth. It includes key components such as gross profit margin, operating expenses ratio, operating profit margin, net profit margin, earning before interest and taxes, etc. Introducing our Monthly Financial Performance Result Reporting set of slides. The topics discussed in these slides are Gross Profit Margin, Operating Expenses, Income Statement. This is an immediately available PowerPoint presentation that can be conveniently customized. Download it and convince your audience.
-
 Power Business Intelligence Report For Tracking Financial Performance
The following slide showcases financial performance using power business intelligence report. It includes components such as monthly economy, reduced engine hours, decrease in carbon dioxide, engine hours reduction by automobile, fuel savings. Presenting our well structured Power Business Intelligence Report For Tracking Financial Performance. The topics discussed in this slide are Consumption Trend, Expenditure Trend, Emission Trend. This is an instantly available PowerPoint presentation that can be edited conveniently. Download it right away and captivate your audience.
-
 SAP Analytics Cloud Dashboard For Financial Reporting Action Plan For Implementing BI
This slide illustrates the SAP Analytics Cloud dashboard for financial reporting in terms of net revenue, operating profit, cost of goods sold, profitability trend and net revenue by country. It also provides details of net worth of incoming order and order distribution by country. Deliver an outstanding presentation on the topic using this SAP Analytics Cloud Dashboard For Financial Reporting Action Plan For Implementing BI. Dispense information and present a thorough explanation of Profitability Trend, SAP Analytics, Cloud Dashboard, Financial Reporting using the slides given. This template can be altered and personalized to fit your needs. It is also available for immediate download. So grab it now.
-
 Business Financial Health Summary Report
The following slide depicts the financial summary overview to track and control actions. It also includes elements such as liquidity and growth ratios, asset utilization, key highlights, profitability, revenue growth etc. Presenting our well structured Business Financial Health Summary Report. The topics discussed in this slide are Profitability, Key Highlights, Amounts. This is an instantly available PowerPoint presentation that can be edited conveniently. Download it right away and captivate your audience.
-
 Business Executive Financial Summary Report
This slide showcase the executive financial summary report which includes the last four quarters EBITDA calculation and major expense budget variance. It includes elements such as cost of services, operating expenses, depreciation, advertisement, marketing etc.depreciation, advertisement, marketing etc. Presenting our well structured Business Executive Financial Summary Report. The topics discussed in this slide are Financial, Summary, Budget. This is an instantly available PowerPoint presentation that can be edited conveniently. Download it right away and captivate your audience.
-
 Business Income And Expense Financial Summary Report
This slide showcases financial summary report of organization in order to analyze amount of expenditure occurred and income generated. It includes elements such as account receivable, account payable current ratio, quick ratio etc. Introducing our Business Income And Expense Financial Summary Report set of slides. The topics discussed in these slides are Income, Expenses, Cash. This is an immediately available PowerPoint presentation that can be conveniently customized. Download it and convince your audience.
-
 Financial Accounts Management Summary Report
This slide illustrate financial summary of account receivable and payable along with sales, cost of goods sold and operating expense chart. It includes elements such as equity ratio, debt ratio, current ratio, quick ratio. Presenting our well structured Financial Accounts Management Summary Report. The topics discussed in this slide are Accounts, Current Ratio, Quick Ratio. This is an instantly available PowerPoint presentation that can be edited conveniently. Download it right away and captivate your audience.
-
 Investment Portfolio Financial Summary Report
This slide showcase individual investment portfolio financial summary that help in analyzing gains and losses from investment in bonds, stock, share. It includes elements such as portfolio value, yield cost ratio, total dividend, unrealized gains etc.unrealized gains etc. Presenting our well structured Investment Portfolio Financial Summary Report. The topics discussed in this slide are Financial, Portfolio, Investment. This is an instantly available PowerPoint presentation that can be edited conveniently. Download it right away and captivate your audience.
-
 Organization Financial Asset Structure Summary Report
This slide showcase companys financial structure which includes current asset, liabilities, asset structure, and key ratios. It includes long term receivables, intangible assets, goodwill, intellectual property, real estate etc. Introducing our Organization Financial Asset Structure Summary Report set of slides. The topics discussed in these slides are Financial Position, Assets Structure, Financial. This is an immediately available PowerPoint presentation that can be conveniently customized. Download it and convince your audience.
-
 Cloud Kitchen Business Financials Online Restaurant International Market Report
This slide presents a dashboard for tracking and managing business income and expenditure. It includes key components such as method of payment, voids, discounts, refunds, top menu items, cost by staff type and percentage of revenue. Present the topic in a bit more detail with this Cloud Kitchen Business Financials Online Restaurant International Market Report. Use it as a tool for discussion and navigation on Method Of Payment, Sales By Category, Revenue. This template is free to edit as deemed fit for your organization. Therefore download it now.
-
 Business Profit Generation By Global Regions Food Company Financial Report
The slide highlights the profit by geography in USdoller from 2019 to 2023. It showcases key insights describing profit for USA and rest of the world Present the topic in a bit more detail with this Business Profit Generation By Global Regions Food Company Financial Report Use it as a tool for discussion and navigation on Business Profit Generation, Global Regions This template is free to edit as deemed fit for your organization. Therefore download it now.
-
 Business Revenue Generation By Geographical Area Food Company Financial Report
The slide highlights the revenue generated from the USA and rest of the world in USdoller from 2019 to 2023. It showcases key insights describing revenue trend. Deliver an outstanding presentation on the topic using this Business Revenue Generation By Geographical Area Food Company Financial Report Dispense information and present a thorough explanation of Business Revenue Generation, Geographical Area using the slides given. This template can be altered and personalized to fit your needs. It is also available for immediate download. So grab it now.
-
 Food Company Export Partners Share Food Company Financial Report
The following slide highlights the percentage share of food and other food related products exported to different countries. The countries included are united states of America, Netherlands, France, Germany, Brazil, Belgium, Thailand, and India Present the topic in a bit more detail with this Food Company Export Partners Share Food Company Financial Report Use it as a tool for discussion and navigation on Food Company, Export Partners Share This template is free to edit as deemed fit for your organization. Therefore download it now.
-
 Food Product Annual Profit By Category Food Company Financial Report
The following slide shows the annual profit generated from product categories sold by company. The categories included are dairy, baked goods, processed meat, seafood, edible oils, baby foods and ready meals. Present the topic in a bit more detail with this Food Product Annual Profit By Category Food Company Financial Report Use it as a tool for discussion and navigation on Food Product, Annual Profit Category This template is free to edit as deemed fit for your organization. Therefore download it now.
-
 Gross Profit And Margin Food Company Financial Report
This slide illustrates a graph of gross profit and gross margin in percentage for food company. Additionally, it shows gross profit of all business lines of the company food, beverage and dairy products Deliver an outstanding presentation on the topic using this Gross Profit And Margin Food Company Financial Report Dispense information and present a thorough explanation of Gross Profit And Margin using the slides given. This template can be altered and personalized to fit your needs. It is also available for immediate download. So grab it now.
-
 Historical Food Product Sales Chart Food Company Financial Report
The following slide shows the comparative sales growth of agricultural products and processed foods. It shows the product sales from more than three decades to assess the change in demand of company products Present the topic in a bit more detail with this Historical Food Product Sales Chart Food Company Financial Report Use it as a tool for discussion and navigation on Historical Food Product, Sales Chart This template is free to edit as deemed fit for your organization. Therefore download it now.
-
 Historical Revenue 2019 2023 Food Company Financial Report
The slide shows annual revenue growth of the company with the CAGR for last five financial years from 2019 to 2023 along with key insights. Deliver an outstanding presentation on the topic using this Historical Revenue 2019 2023 Food Company Financial Report Dispense information and present a thorough explanation of Historical Revenue using the slides given. This template can be altered and personalized to fit your needs. It is also available for immediate download. So grab it now.
-
 Net Profit And Margin Food Company Financial Report
This slide illustrates a graph of net profit in USdoller and gross margin in percentage for food company. Additionally, it shows net profit of all business lines of the company food, beverage and dairy products Present the topic in a bit more detail with this Net Profit And Margin Food Company Financial Report Use it as a tool for discussion and navigation on Net Profit And Margin This template is free to edit as deemed fit for your organization. Therefore download it now.
-
 Operating Profit And Margin Food Company Financial Report
This slide illustrates a graph of operating profit in USdoller and gross margin in percentage for food company. Additionally, it shows operating profit of all business lines of the company food, beverage and dairy products Deliver an outstanding presentation on the topic using this Operating Profit And Margin Food Company Financial Report Dispense information and present a thorough explanation of Operating Profit And Margin using the slides given. This template can be altered and personalized to fit your needs. It is also available for immediate download. So grab it now.
-
 Revenue By Category Food Company Financial Report
The slide highlights the historical revenue for food products, beverage and dairy products revenue with CAGR. It showcases key insights for revenue describing growth trend for each category Present the topic in a bit more detail with this Revenue By Category Food Company Financial Report Use it as a tool for discussion and navigation on Revenue, Category This template is free to edit as deemed fit for your organization. Therefore download it now.
-
 Sales Contribution From Vegan Proteins Products Food Company Financial Report
The following slide highlights the comparative assessment of vegan protein and traditional sales for multiple products. The products included are packaged products, snacks, nutritional beverages, frozen meals, frozen snacks, and pizza Deliver an outstanding presentation on the topic using this Sales Contribution From Vegan Proteins Products Food Company Financial Report Dispense information and present a thorough explanation of Sales Contribution, Vegan Proteins Products using the slides given. This template can be altered and personalized to fit your needs. It is also available for immediate download. So grab it now.
-
 Project Feasibility Financial Ratios Project Feasibility Report Submission For Bank Loan
Following slide covers project feasibility financial ratio along with graphical representation. Ratios included are net profit sales, quick ratio, debt equity ratio and gross profit sales. Present the topic in a bit more detail with this Project Feasibility Financial Ratios Project Feasibility Report Submission For Bank Loan. Use it as a tool for discussion and navigation on Net Profit Sales, Quick Ratio This template is free to edit as deemed fit for your organization. Therefore download it now.
-
 Dashboard For Monitoring And Reporting Financial Budgets
This slide brings forth dashboard for monitoring and reporting the financial budgets of various branches of an enterprise emphasis on income and expenditure by each branch. The key performing indicators are actual vs budgeted revenue, revenue distribution by branches etc. Introducing our Dashboard For Monitoring And Reporting Financial Budgets set of slides. The topics discussed in these slides are Current Revenue, Current Operating Income This is an immediately available PowerPoint presentation that can be conveniently customized. Download it and convince your audience.
-
 Financial Kpi Dashboard To Report Cash Flow Of Company
This slide presents a financial dashboard of an enterprise which is being used to report the total spending power of a company. Key performing indicators include cash burn rate, monthly expenses, solvency etc. Presenting our well structured Financial Kpi Dashboard To Report Cash Flow Of Company The topics discussed in this slide are Cash Burn Rate, Monthly ExpensesThis is an instantly available PowerPoint presentation that can be edited conveniently. Download it right away and captivate your audience.
-
 SAP Analytics Cloud Dashboard For Financial Reporting Strategic Business Planning
This slide illustrates the SAP Analytics Cloud dashboard for financial reporting in terms of net revenue, operating profit, cost of goods sold, profitability trend and net revenue by country. It also provides details of net worth of incoming order and order distribution by country. Deliver an outstanding presentation on the topic using this SAP Analytics Cloud Dashboard For Financial Reporting Strategic Business Planning. Dispense information and present a thorough explanation of SAP Analytics, Cloud Dashboard, Financial Reporting, Operating Pro using the slides given. This template can be altered and personalized to fit your needs. It is also available for immediate download. So grab it now.
-
 Financial comparison business report data analytics
Presenting this set of slides with name - Financial Comparison Business Report Data Analytics. This is a one stage process. The stages in this process are Financial Comparison, Financial Analysis, Financial Statement.
-
 Financial comparison increasing business data report
Presenting this set of slides with name - Financial Comparison Increasing Business Data Report. This is a three stage process. The stages in this process are Financial Comparison, Financial Analysis, Financial Statement.
-
 0314 business reports and financial statements
Presentation design quickly downloadable. Easy to save into JPEG and PDF document. PPT diagrams are harmonious with Google slides. Flexible to share in widescreen view as amazing picture quality. Simple to alter color, text, font and shape. Similar designs accessible with different nodes and stages as required. Presentable and simple to comprehend into graphic format. Convenience to incorporate occupational label, design.
-
 0314 comparison of financial reports
Presentation design can be downloaded and saved into JPEG and PDF. Choice of insertion of logo and icons as per the business need. Adaptable to wide screen view without the problem of pixilation. Easy to comprehend info graphic format. Completely editable images, colors and text. Accessible with different nodes and stages as required. PPT slides are fully compatible with Google slides.
-
 0314 global financial report design
Transform the presentation with business information i.e. sign and design. Pre-designed PPT slide assist you in saving both your time and effort. Choice to add or remove content in the design. Text and font can be easily altered as the PowerPoint template is absolutely editable. Presentation layout exhibit in both standard and widescreen slide. Adaptable as can be adapted in JPEG or PDF documents. Perfect for finance analyst, global financial planning experts, accounts management team etc.
-
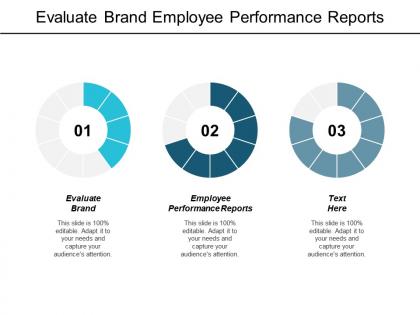 Evaluate brand employee performance reports financial managing marketing forces cpb
This is an editable three stages graphic that deals with topics like Evaluate Brand, Employee Performance Reports, Financial Managing, Marketing Forces to help convey your message better graphically. This product is a premium product available for immediate download, and is 100 percent editable in Powerpoint. Download this now and use it in your presentations to impress your audience.
-
 Consolidated financial reporting ppt powerpoint presentation model files cpb
Presenting this set of slides with name - Consolidated Financial Reporting Ppt Powerpoint Presentation Model Files Cpb. This is an editable four stages graphic that deals with topics like Consolidated Financial Reporting to help convey your message better graphically. This product is a premium product available for immediate download, and is 100 percent editable in Powerpoint. Download this now and use it in your presentations to impress your audience.
-
 Financial reporting advantages ppt powerpoint presentation ideas background image cpb
Presenting this set of slides with name - Financial Reporting Advantages Ppt Powerpoint Presentation Ideas Background Image Cpb. This is an editable four stages graphic that deals with topics like Financial Reporting Advantages to help convey your message better graphically. This product is a premium product available for immediate download, and is 100 percent editable in Powerpoint. Download this now and use it in your presentations to impress your audience.
-
 Financial management report for multiple projects
Introducing our Financial Management Report For Multiple Projects set of slides. The topics discussed in these slides are Financial Management Report For Multiple Projects. This is an immediately available PowerPoint presentation that can be conveniently customized. Download it and convince your audience.
-
 Icon showing financial report of project management
Introducing our premium set of slides with Icon Showing Financial Report Of Project Management. Ellicudate the three stages and present information using this PPT slide. This is a completely adaptable PowerPoint template design that can be used to interpret topics like Icon Showing Financial Report Of Project Management. So download instantly and tailor it with your information.
-
 Manager icon working on project financial management report
Presenting our set of slides with Manager Icon Working On Project Financial Management Report. This exhibits information on three stages of the process. This is an easy to edit and innovatively designed PowerPoint template. So download immediately and highlight information on Manager Icon Working On Project Financial Management Report.
-
 Project financial portfolio management report
Presenting our well structured Project Financial Portfolio Management Report. The topics discussed in this slide are Project, Planned Cost, Website Relaunch. This is an instantly available PowerPoint presentation that can be edited conveniently. Download it right away and captivate your audience.
-
 Businessman preparing statistics report of financial data
Presenting our set of slides with Businessman Preparing Statistics Report Of Financial Data. This exhibits information on four stages of the process. This is an easy-to-edit and innovatively designed PowerPoint template. So download immediately and highlight information on Businessman Preparing Statistics Report Of Financial Data.


