Powerpoint Templates and Google slides for Production Units
Save Your Time and attract your audience with our fully editable PPT Templates and Slides.
-
 Defining product leadership strategies measuring business unit performance dashboard
This slide covers dashboard that shows business unit performance such as new customers, average weekly sales revenue, sales revenues, profits, customer lifetime value, etc. Deliver an outstanding presentation on the topic using this Defining Product Leadership Strategies Measuring Business Unit Performance Dashboard. Dispense information and present a thorough explanation of Business, Performance, Dashboard using the slides given. This template can be altered and personalized to fit your needs. It is also available for immediate download. So grab it now.
-
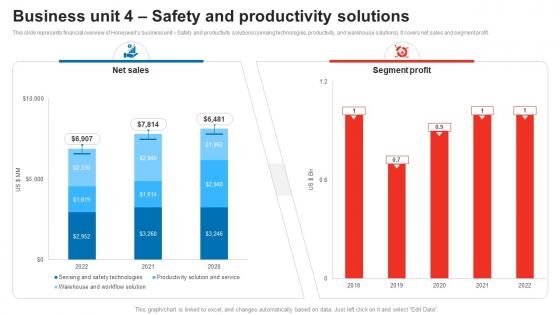 Business Unit 4 Safety And Productivity Solutions Honeywell Company Profile CP SS
This slide represents financial overview of Honeywells business unit Safety and productivity solutions sensing technologies, productivity, and warehouse solutions. It covers net sales and segment profit. Deliver an outstanding presentation on the topic using this Business Unit 4 Safety And Productivity Solutions Honeywell Company Profile CP SS Dispense information and present a thorough explanation of Investing, Financing, Operating using the slides given. This template can be altered and personalized to fit your needs. It is also available for immediate download. So grab it now.
-
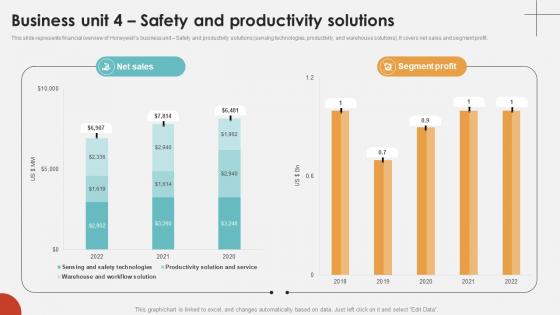 Business Unit 4 Safety And Productivity Solutions Industrial Technology Company Profile CP SS V
This slide represents financial overview of Honeywells business unit Safety and productivity solutions sensing technologies, productivity, and warehouse solutions. It covers net sales and segment profit. Deliver an outstanding presentation on the topic using this Business Unit 4 Safety And Productivity Solutions Industrial Technology Company Profile CP SS V. Dispense information and present a thorough explanation of Productivity, Solutions, Business using the slides given. This template can be altered and personalized to fit your needs. It is also available for immediate download. So grab it now.
-
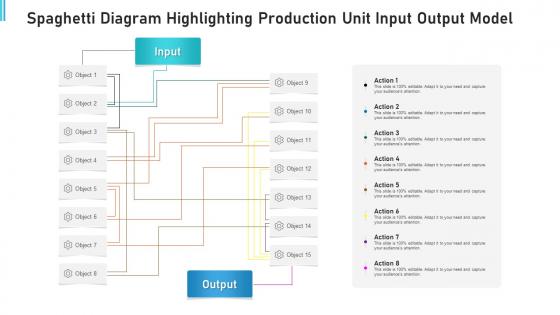 Spaghetti diagram highlighting production unit input output model
Introducing our spaghetti diagram highlighting production unit input output model set of slides. The topics discussed in these slides are Spaghetti Diagram Showing Production Unit Workflow. This is an immediately available PowerPoint presentation that can be conveniently customized. Download it and convince your audience.
-
 Product Cost Unit Formula In Powerpoint And Google Slides Cpb
Presenting Product Cost Unit Formula In Powerpoint And Google Slides Cpb slide which is completely adaptable. The graphics in this PowerPoint slide showcase four stages that will help you succinctly convey the information. In addition, you can alternate the color, font size, font type, and shapes of this PPT layout according to your content. This PPT presentation can be accessed with Google Slides and is available in both standard screen and widescreen aspect ratios. It is also a useful set to elucidate topics like Product Cost Unit Formula. This well structured design can be downloaded in different formats like PDF, JPG, and PNG. So, without any delay, click on the download button now.
-
 Unit Linked Product In Powerpoint And Google Slides Cpb
Presenting Unit Linked Product In Powerpoint And Google Slides Cpb slide which is completely adaptable. The graphics in this PowerPoint slide showcase three stages that will help you succinctly convey the information. In addition, you can alternate the color, font size, font type, and shapes of this PPT layout according to your content. This PPT presentation can be accessed with Google Slides and is available in both standard screen and widescreen aspect ratios. It is also a useful set to elucidate topics like Unit Linked Product. This well structured design can be downloaded in different formats like PDF, JPG, and PNG. So, without any delay, click on the download button now.
-
 Daily unit products covid 19 business survive adapt
This slide covers the volume and unit purchased of Apparel goods through offline sales channels during COVID 19 pandemic Deliver an outstanding presentation on the topic using this Daily Unit Products Covid 19 Business Survive Adapt. Dispense information and present a thorough explanation of Interested, Department, Suffering using the slides given. This template can be altered and personalized to fit your needs. It is also available for immediate download. So grab it now.
-
 Daily unit volume of fmcg products covid 19 business survive adapt
This slide covers the volume and unit purchased of FMCG goods in COVID 19 pandemic to avoid crowds at supermarkets, many people are choosing BOPIS buy-online pick up in store or delivery options. Present the topic in a bit more detail with this Daily Unit Volume Of Fmcg Products Covid 19 Business Survive Adapt. Use it as a tool for discussion and navigation on Daily Unit Volume Of FMCG Products. This template is free to edit as deemed fit for your organization. Therefore download it now.
-
 Total Number Of Units Sold By The Product New Commodity Market Feasibility Analysis
The following slide displays the total number of units sold by the organization, the provided bar graph displays the various months and total units in million sold in each. Present the topic in a bit more detail with this Total Number Of Units Sold By The Product New Commodity Market Feasibility Analysis. Use it as a tool for discussion and navigation on Total Number Of Units Sold By The Product. This template is free to edit as deemed fit for your organization. Therefore download it now.
-
 Ensuring Leadership Product Innovation Processes Measuring Business Unit Performance Dashboard
This slide covers dashboard that shows business unit performance such as new customers, average weekly sales revenue, sales revenues, profits, customer lifetime value, etc. Present the topic in a bit more detail with this Ensuring Leadership Product Innovation Processes Measuring Business Unit Performance Dashboard. Use it as a tool for discussion and navigation on Business, Performance, Dashboard. This template is free to edit as deemed fit for your organization. Therefore download it now.
-
 Total Number Of Units Sold By The Product Understanding New Product Impact On Market
The following slide displays the total number of units sold by the organization, the provided bar graph displays the various months and total units in million sold in each. Present the topic in a bit more detail with this Total Number Of Units Sold By The Product Understanding New Product Impact On Market. Use it as a tool for discussion and navigation on Unit Sold, Sale Product Increase, Organization. This template is free to edit as deemed fit for your organization. Therefore download it now.
-
 New product performance evaluation number of units sold by the product
The following slide displays the total number of units sold by the organization, the provided bar graph displays the various months and total units in million sold in each.Present the topic in a bit more detail with this New Product Performance Evaluation Number Of Units Sold By The Product. Use it as a tool for discussion and navigation on Total Number Of Units Sold By The Product. This template is free to edit as deemed fit for your organization. Therefore download it now.
-
 Delivering Efficiency By Innovating Product Measuring Business Unit Performance Dashboard
This slide covers dashboard that shows business unit performance such as new customers, average weekly sales revenue, sales revenues, profits, customer lifetime value, etc. Present the topic in a bit more detail with this Delivering Efficiency By Innovating Product Measuring Business Unit Performance Dashboard. Use it as a tool for discussion and navigation on Business, Performance, Dashboard. This template is free to edit as deemed fit for your organization. Therefore download it now.
-
 Managing And Innovating Product Management Measuring Business Unit Performance
This slide covers dashboard that shows business unit performance such as new customers, average weekly sales revenue, sales revenues, profits, customer lifetime value, etc. Deliver an outstanding presentation on the topic using this Managing And Innovating Product Management Measuring Business Unit Performance. Dispense information and present a thorough explanation of Business, Performance, Dashboard using the slides given. This template can be altered and personalized to fit your needs. It is also available for immediate download. So grab it now.
-
 Capsim scorecard capsim strategy balanced scorecard with production units
Deliver an outstanding presentation on the topic using this Capsim Scorecard Capsim Strategy Balanced Scorecard With Production Units. Dispense information and present a thorough explanation of Strategy, Balanced, Production using the slides given. This template can be altered and personalized to fit your needs. It is also available for immediate download. So grab it now.
-
 Doughnut Chart Highlighting Production Volume Of Multiple Manufacturing Units
Presenting our well-structured Doughnut Chart Highlighting Production Volume Of Multiple Manufacturing Units. The topics discussed in this slide are Doughnut Chart, Production Volume, Manufacturing Units. This is an instantly available PowerPoint presentation that can be edited conveniently. Download it right away and captivate your audience.
-
 Total Number Of Units Sold By The Product Annual Product Performance Report Ppt Topic
The following slide displays the total number of units sold by the organization, the provided bar graph displays the various months and total units in million sold in each. Present the topic in a bit more detail with this Total Number Of Units Sold By The Product Annual Product Performance Report Ppt Topic. Use it as a tool for discussion and navigation on Total Number Of Units Sold By The Product. This template is free to edit as deemed fit for your organization. Therefore download it now.
-
 Dual Branding Campaign For Product Increase In Units Sold Due To Dual Branding
This slide showcases graph which displays increase in units sold. It can help organizations to determine the revenue and sales generated by multiple products after launching dual branding campaign. Present the topic in a bit more detail with this Dual Branding Campaign For Product Increase In Units Sold Due To Dual Branding. Use it as a tool for discussion and navigation on Dual Branding, Campaign Launched, Product. This template is free to edit as deemed fit for your organization. Therefore download it now.
-
 Increase In Units Sold Due To Dual Branding Campaign To Increase Product Sales
This slide showcases graph which displays increase in units sold. It can help organizations to determine the revenue and sales generated by multiple products after launching dual branding campaign. Present the topic in a bit more detail with this Increase In Units Sold Due To Dual Branding Campaign To Increase Product Sales. Use it as a tool for discussion and navigation on Dual Branding Campaign Launched, Product. This template is free to edit as deemed fit for your organization. Therefore download it now.
-
 Company Production Units In Decade Line Chart
This slide depicts a number of production units in a decade to ensure demand and supply product. It includes parts such as years and production units. Presenting our well structured Company Production Units In Decade Line Chart. The topics discussed in this slide are Company Production, Units In Decade, Line Chart. This is an instantly available PowerPoint presentation that can be edited conveniently. Download it right away and captivate your audience.
-
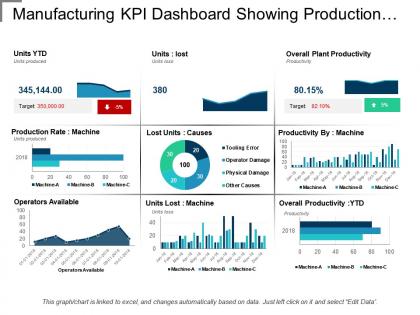 Manufacturing kpi dashboard showing production rate and lost units
Presenting manufacturing KPI dashboard showing production rate and lost units. This layout is compatible with Google slides and data can be updated with excel linked file. Easy to put in company logo, trademark or name; accommodate words to support the key points. Images do no blur out even when they are projected on large screen.PPT template can be utilized by sales and marketing teams and business managers. Instantly downloadable slide and supports formats like JPEG and PDF.
-
 Business analytics dashboard snapshot with online sales tracking and product profit per unit
This is a two stage process. The stages in this process are Business Analytics, BA, Organizations Data.
-
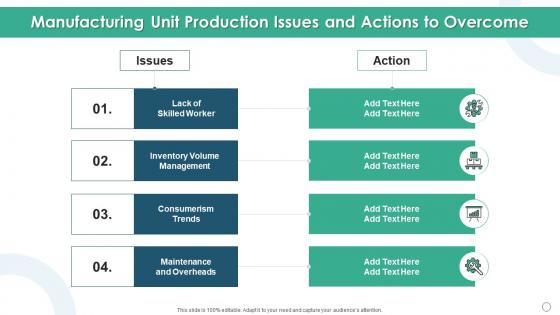 Manufacturing unit production issues and actions to overcome
Presenting our set of slides with Manufacturing Unit Production Issues And Actions To Overcome. This exhibits information on four stages of the process. This is an easy to edit and innovatively designed PowerPoint template. So download immediately and highlight information on Lack Of Skilled Worker, Inventory Volume Management, Consumerism Trends.
-
 Units production depreciation ppt powerpoint presentation summary good cpb
Presenting our Units Production Depreciation Ppt Powerpoint Presentation Summary Good Cpb PowerPoint template design. This PowerPoint slide showcases five stages. It is useful to share insightful information on Units Production Depreciation This PPT slide can be easily accessed in standard screen and widescreen aspect ratios. It is also available in various formats like PDF, PNG, and JPG. Not only this, the PowerPoint slideshow is completely editable and you can effortlessly modify the font size, font type, and shapes according to your wish. Our PPT layout is compatible with Google Slides as well, so download and edit it as per your knowledge.
-
 Quarterly Sales Revenue And Numbers Of Unit Sold By Products
Presenting our well structured Quarterly Sales Revenue And Numbers Of Unit Sold By Products. The topics discussed in this slide are Quarterly Sales Revenue And Numbers Of Unit Sold By Products. This is an instantly available PowerPoint presentation that can be edited conveniently. Download it right away and captivate your audience.
-
 Key Assumptions For Product Cost Per Unit Forecast
This slide covers the projected cost of per unit production of the product to know what will be the final cost of that product . It also includes required raw materials with their measurement units and the key assumptions while preparing the cost of product. Introducing our Key Assumptions For Product Cost Per Unit Forecast set of slides. The topics discussed in these slides are Assumptions, Product, Forecast. This is an immediately available PowerPoint presentation that can be conveniently customized. Download it and convince your audience.
-
 Summarizing Methods Procedures Per Unit Indirect Costs For Each Product Ppt Summary
Allocating activity pool costs to individual product units. The cost per product unit figures for product A and product B second and fourth columns derive d from the cost sums for each activity pool first and third columns divided by the number of product units produced and sold for each product. Present the topic in a bit more detail with this Summarizing Methods Procedures Per Unit Indirect Costs For Each Product Ppt Summary. Use it as a tool for discussion and navigation on Purchasing Order, Machine Setups, Product Packaging, Maintenance And Cleaning. This template is free to edit as deemed fit for your organization. Therefore download it now.
-
 Per Unit Indirect Costs For Each Product Cost Allocation Activity Based Costing Systems
Allocating activity pool costs to individual product units. The cost per product unit figures for product A and product B second and fourth columns derive d from the cost sums for each activity pool first and third columns divided by the number of product units produced and sold for each product. Present the topic in a bit more detail with this Per Unit Indirect Costs For Each Product Cost Allocation Activity Based Costing Systems. Use it as a tool for discussion and navigation on Product Packaging, Indirect Costs, Each Product. This template is free to edit as deemed fit for your organization. Therefore download it now.
-
 Per Unit Indirect Costs For Each Product Ppt Icon Visual Aids
Allocating activity pool costs to individual product units. The cost per product unit figures for product A and product B second and fourth columns derive d from the cost sums for each activity pool first and third columns divided by the number of product units produced and sold for each product. Present the topic in a bit more detail with this Per Unit Indirect Costs For Each Product Ppt Icon Visual Aids. Use it as a tool for discussion and navigation on Product Packaging, Purchasing Orders, Cost Per Product. This template is free to edit as deemed fit for your organization. Therefore download it now.
-
 Per Unit Indirect Costs For Each Product Accounting Tools Cost Allocation Ppt Summary
Allocating activity pool costs to individual product units. the cost per product unit figures for product A and product B second and fourth columns derive d from the cost sums for each activity pool first and third columns divided by the number of product units produced and sold for each product. Increase audience engagement and knowledge by dispensing information using Per Unit Indirect Costs For Each Product Accounting Tools Cost Allocation Ppt Summary. This template helps you present information on one stage. You can also present information on Purchasing Order, Product Packaging, Maintenance And Cleaning using this PPT design. This layout is completely editable so personaize it now to meet your audiences expectations.
-
 BCG Strategy For Products Of FMCG Industry Unit
This slide includes the present state of products of an FMCG business according to their profit making capacity. It also outlines the course of strategies to be followed for each segmentation, i.e. Cash Cow, Star, Question Mark and Dog. Presenting our set of slides with BCG Strategy For Products Of FMCG Industry Unit. This exhibits information on one stage of the process. This is an easy to edit and innovatively designed PowerPoint template. So download immediately and highlight information on Strategy, Product, Industry Unit.
-
 Unit Market And Revenue Share From Brand Product Sales
This slide covers market share and revenue earned from multi brands. It also includes number of sales along with percentage of revenue market share. Presenting our well-structured Unit Market And Revenue Share From Brand Product Sales. The topics discussed in this slide are Brand, Unit Sales, Unit Market Share, Sales Revenue. This is an instantly available PowerPoint presentation that can be edited conveniently. Download it right away and captivate your audience.
-
 Per Unit Indirect Costs For Each Product Steps Of Cost Allocation Process
Allocating activity pool costs to individual product units. The cost per product unit figures for product A and product B second and fourth columns derive d from the cost sums for each activity pool first and third columns divided by the number of product units produced and sold for each product Present the topic in a bit more detail with this Per Unit Indirect Costs For Each Product Steps Of Cost Allocation Process. Use it as a tool for discussion and navigation on Maintenance And Cleaning, Purchasing Order, Machine Setups. This template is free to edit as deemed fit for your organization. Therefore download it now.
-
 E Invoice Of Electrical Fixtures For New Production Unit Icon
Introducing our premium set of slides with E Invoice Of Electrical Fixtures For New Production Unit Icon. Ellicudate the three stages and present information using this PPT slide. This is a completely adaptable PowerPoint template design that can be used to interpret topics like E Invoice Of Electrical Fixtures, New Production Unit Icon. So download instantly and tailor it with your information.
-
 Cosmetic Product Sales Comparison With Units Sold
This slide shows matrix which can be used by organizations to compare sales performance of various products. It includes cost of revenue, units sold, revenue and profit. Presenting our set of slides with Cosmetic Product Sales Comparison With Units Sold. This exhibits information on five stages of the process. This is an easy to edit and innovatively designed PowerPoint template. So download immediately and highlight information on Cosmetic Category, Cost Revenue, Units Sold.
-
 6 Months Production Target Achievement Plan With Demand Units
This slide showcases the half-yearly manufacturing target schedule. It includes production details such as planned period, demand units, regular, overtime, subcontract, and inventory. Introducing our 6 Months Production Target Achievement Plan With Demand Units set of slides. The topics discussed in these slides are 6 Months Production, Target Achievement Plan, Demand Units . This is an immediately available PowerPoint presentation that can be conveniently customized. Download it and convince your audience.
-
 Icon For International Product Expansion For Business Units
Introducing our premium set of slides with Icon For International Product Expansion For Business Units. Elucidate the four stages and present information using this PPT slide. This is a completely adaptable PowerPoint template design that can be used to interpret topics like Icon, International Product Expansion, Business Units. So download instantly and tailor it with your information.
-
 Weekly Operational Plan For Production Unit
This slide showcases operational planning steps for running a production unit. Key planning stages includes defining production targets, evaluating current production capacity, resource requirement to achieve targets, supply management, warehouse management etc. Presenting our well structured Weekly Operational Plan For Production Unit. The topics discussed in this slide are Weekly Operational, Plan For Production Unit, Manufacturing Steps. This is an instantly available PowerPoint presentation that can be edited conveniently. Download it right away and captivate your audience.
-
 Product Units Sold Colored Icon In Powerpoint Pptx Png And Editable Eps Format
Give your next presentation a sophisticated, yet modern look with this 100 percent editable Product units sold colored icon in powerpoint pptx png and editable eps format. Choose from a variety of customizable formats such as PPTx, png, eps. You can use these icons for your presentations, banners, templates, One-pagers that suit your business needs.
-
 Product Units Sold Monotone Icon In Powerpoint Pptx Png And Editable Eps Format
Make your presentation profoundly eye-catching leveraging our easily customizable Product units sold monotone icon in powerpoint pptx png and editable eps format. It is designed to draw the attention of your audience. Available in all editable formats, including PPTx, png, and eps, you can tweak it to deliver your message with ease.
-
 Uses Of Product-Process Matrix In Manufacturing Unit
This slide defines the usage of product and process matrix. It includes information related to analyzing products, demand and supply relationship, evaluating market conditions, etc. Presenting our set of slides with Uses Of Product-Process Matrix In Manufacturing Unit. This exhibits information on three stages of the process. This is an easy to edit and innovatively designed PowerPoint template. So download immediately and highlight information on Analyzing, Reviewing, Evaluating.
-
 Monthly Units Production Report With Multiple Products
The slide covers the unit production of different products of similar industry. The slide also covers months, total production with key analysis. Introducing our Monthly Units Production Report With Multiple Products set of slides. The topics discussed in these slides are Matrix Shows, Production Month, Demand Product. This is an immediately available PowerPoint presentation that can be conveniently customized. Download it and convince your audience.
-
 Product Sales Units Colored Icon In Powerpoint Pptx Png And Editable Eps Format
Give your next presentation a sophisticated, yet modern look with this 100 percent editable Product sales units colored icon in powerpoint pptx png and editable eps format. Choose from a variety of customizable formats such as PPTx, png, eps. You can use these icons for your presentations, banners, templates, One-pagers that suit your business needs.
-
 Product Sales Units Monotone Icon In Powerpoint Pptx Png And Editable Eps Format
Make your presentation profoundly eye-catching leveraging our easily customizable Product sales units monotone icon in powerpoint pptx png and editable eps format. It is designed to draw the attention of your audience. Available in all editable formats, including PPTx, png, and eps, you can tweak it to deliver your message with ease.
-
 Production Unit System Integration Design Icon
Present the topic in a bit more detail with this Production Unit System Integration Design Icon. Use it as a tool for discussion and navigation on Production Unit, System Integration, Design Icon. This template is free to edit as deemed fit for your organization. Therefore download it now.
-
 Marketing unit product launch plan powerpoint diagram
Presenting marketing unit product launch plan powerpoint diagram. This is a marketing unit product launch plan powerpoint diagram. This is a three stage process. The stages in this process are product, product family.
-
 Experience curve strategy framework showing graph with cost unit and cumulative production
Presenting this set of slides with name - Experience Curve Strategy Framework Showing Graph With Cost Unit And Cumulative Production. This is a one stage process. The stages in this process are Experience Curve, Learning Curve.
-
 Cost allocation showing units of products
Presenting this set of slides with name - Cost Allocation Showing Units Of Products. This is a three stage process. The stages in this process are Cost Allocation, Assigning Costs, Costs Management.
-
 Attitude toward growth business unit functional strategies resource productivity
Presenting this set of slides with name - Attitude Toward Growth Business Unit Functional Strategies Resource Productivity. This is an editable three stages graphic that deals with topics like Attitude Toward Growth, Business Unit, Functional Strategies, Resource Productivity to help convey your message better graphically. This product is a premium product available for immediate download, and is 100 percent editable in Powerpoint. Download this now and use it in your presentations to impress your audience.
-
 Sales and marketing strategy showing corporate business unit product marketing aspects
Presenting this set of slides with name - Sales And Marketing Strategy Showing Corporate Business Unit Product Marketing Aspects. This is a four stage process. The stages in this process are Sales And Marketing Strategy, Sales And Marketing Plan, Sales And Marketing Idea.
-
 Depreciation schedule of units of production in tabular form
Presenting this set of slides with name - Depreciation Schedule Of Units Of Production In Tabular Form. This is a five stage process. The stages in this process are Depreciation, Devaluation, Decline.
-
 Cost per unit product leadership customer management processes
Presenting this set of slides with name - Cost Per Unit Product Leadership Customer Management Processes. This is an editable nine graphic that deals with topics like cost per unit, product leadership, customer management processes to help convey your message better graphically. This product is a premium product available for immediate download, and is 100 percent editable in Powerpoint. Download this now and use it in your presentations to impress your audience.
-
 Sales forecast item price unit product name table
Presenting this set of slides with name - Sales Forecast Item Price Unit Product Name Table. This is a five stage process. The stages in this process are Forecast Revenue, Sales Projections, Sales Forecast.
-
 Sales forecast mark up margin product service unit price goods sold
Presenting this set of slides with name - Sales Forecast Mark Up Margin Product Service Unit Price Goods Sold. This is a two stage process. The stages in this process are Forecast Revenue, Sales Projections, Sales Forecast.
-
 Business unit profitability analysis showing total revenues and product margin
Presenting this set of slides with name - Business Unit Profitability Analysis Showing Total Revenues And Product Margin. This is a two stage process. The stages in this process are Business Unit Profitability, Profitable Organization, Corporate Unit Profitability.
-
 Business unit profitability with high profit customer profitable product and losing product
Presenting this set of slides with name - Business Unit Profitability With High Profit Customer Profitable Product And Losing Product. This is a three stage process. The stages in this process are Business Unit Profitability, Profitable Organization, Corporate Unit Profitability.
-
 Business unit profitability with product price cost revenues
Presenting this set of slides with name - Business Unit Profitability With Product Price Cost Revenues. This is a five stage process. The stages in this process are Business Unit Profitability, Profitable Organization, Corporate Unit Profitability.
-
 Map united states color corporate innovation objectives product management cpb
Presenting this set of slides with name - Map United States Color Corporate Innovation Objectives Product Management Cpb. This is an editable five stages graphic that deals with topics like Map United States Color, Corporate Innovation Objectives, Product Management to help convey your message better graphically. This product is a premium product available for immediate download, and is 100 percent editable in Powerpoint. Download this now and use it in your presentations to impress your audience.
-
 The coca cola company unit case volume share by concentrate operations and finished product 2014-18
This is a professionally designed visual chart for The Coca Cola Company Unit Case Volume Share By Concentrate Operations And Finished Product 2014 to 18. This is part of our Data and Statistics products selection, and you will need a Paid account to download the actual report with accurate data and sources. Downloaded report will contain the editable graph with accurate data, an excel table with the actual data, the exact source of the data and the release date. This slide provides the value of unit case volume share by concentrate and finished product by The Coca Cola Company from 2014 to 2018. Download it immediately and use it for your business.
-
 Axa united states gross revenue by product categories 2016-18
This is a professionally designed visual chart for AXA United States Gross Revenue By Product Categories 2016 to 18. This is part of our Data and Statistics products selection, and you will need a Paid account to download the actual report with accurate data and sources. Downloaded report will contain the editable graph with accurate data, an excel table with the actual data, the exact source of the data and the release date. This slide provides a stack chart of Gross Revenue JPY millions of Business Segment United States by Product Categories Life and Savings, Health and Other of the company AXA SA from the years 2016 to 18. Download it immediately and use it for your business.


