Powerpoint Templates and Google slides for Performance Ratting
Save Your Time and attract your audience with our fully editable PPT Templates and Slides.
-
 Employee Performance Assessment And Management Rating Matrix
The below slide provides an employee performance assessment form to evaluate the overall work. It evaluates the employee on various parameters such as job knowledge, work quality, communication skill, etc. Introducing our premium set of slides with Employee Performance Assessment And Management Rating Matrix Ellicudate the Six stages and present information using this PPT slide. This is a completely adaptable PowerPoint template design that can be used to interpret topics like Employee Information, Department, Job Profile So download instantly and tailor it with your information.
-
 Behaviorally Anchored Rating Scale Performance Evaluation Process
This slide showcase procedure to conduct performance evaluation using behaviorally anchored rating scale for examination. It includes process such as key performance areas, employee incidents, sorting, scale grades and test or survey. Introducing Behaviorally Anchored Rating Scale Performance Evaluation Process to increase your presentation threshold. Encompassed with five stages, this template is a great option to educate and entice your audience. Dispence information on Employee Incidents, Key Performance Areas, Sorting, Scale Grades, using this template. Grab it now to reap its full benefits.
-
 Behaviorally Anchored Rating Scale Performance Evaluation Strategies For Employee
This slide illustrate pros and cons of behaviorally anchored rating scale method for performance evaluation to assess weakness and strength. It includes positive benefits such as appropriate for various employment functions and companies, addresses primary flaw etc. Increase audience engagement and knowledge by dispensing information using Behaviorally Anchored Rating Scale Performance Evaluation Strategies For Employee. This template helps you present information on two stages. You can also present information on Evaluating Performance, Rating Scales, Various Employment Functions using this PPT design. This layout is completely editable so personaize it now to meet your audiences expectations.
-
 Employee Performance Evaluation Likert Rating Scale Performance Evaluation Strategies For Employee
Present the topic in a bit more detail with this Employee Performance Evaluation Likert Rating Scale Performance Evaluation Strategies For Employee. Use it as a tool for discussion and navigation on Strongly Disagree, Disagree, Parameter. This template is free to edit as deemed fit for your organization. Therefore download it now.
-
 Overview Of Behaviorally Anchored Rating Scale For Performance Evaluation Strategies For Employee
This slide illustrate overview of behaviorally anchored rating scale method for employee performance evaluation. It includes process such as key performance areas, employee incidents, sorting, scale grades and test or survey.Introducing Overview Of Behaviorally Anchored Rating Scale For Performance Evaluation Strategies For Employee to increase your presentation threshold. Encompassed with one stages, this template is a great option to educate and entice your audience. Dispence information on Scale Grades, Key Performance Areas, Employee Incidents, using this template. Grab it now to reap its full benefits.
-
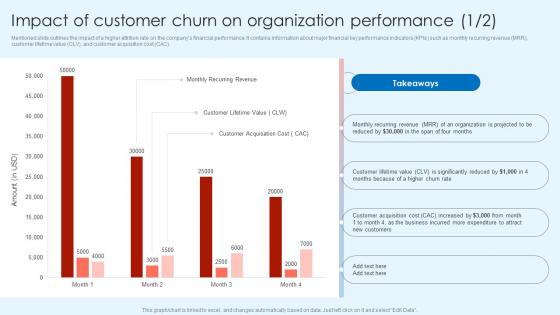 Impact Of Customer Churn On Organization Performance Customer Attrition Rate Prevention
Mentioned slide outlines the impact of a higher attrition rate on the companys financial performance. It contains information about major financial key performance indicators KPIs such as monthly recurring revenue MRR, customer lifetime value CLV, and customer acquisition cost CAC. Present the topic in a bit more detail with this Impact Of Customer Churn On Organization Performance Customer Attrition Rate Prevention. Use it as a tool for discussion and navigation on Customer Churn, Organization Performance. This template is free to edit as deemed fit for your organization. Therefore download it now.
-
 Digital Marketing Report With Performance Rate
This slide focuses on digital marketing report which includes reach, viewability, impressions by device, bounce ,time on site, etc. that helps in measuring the success of an online advertising campaign for website as well as its effectiveness. Introducing our Digital Marketing Report With Performance Rate set of slides. The topics discussed in these slides are Impressions, Bounce And Time On Site, Creative Performance. This is an immediately available PowerPoint presentation that can be conveniently customized. Download it and convince your audience.
-
 Manufacturing operation best practices production rate key performance indicators
The following slide displays the Kpis of manufacturing and operations these Kpis can be defect density, rate of production and rate of return etc Deliver an outstanding presentation on the topic using this Manufacturing Operation Best Practices Production Rate Key Performance Indicators. Dispense information and present a thorough explanation of Production Rate Key Performance Indicators using the slides given. This template can be altered and personalized to fit your needs. It is also available for immediate download. So grab it now.
-
 Shipping vendor scorecard delivery performance rating
Present the topic in a bit more detail with this Shipping Vendor Scorecard Delivery Performance Rating. Use it as a tool for discussion and navigation on Performance, Shipping, Scorecard. This template is free to edit as deemed fit for your organization. Therefore download it now.
-
 Hospital performance data scorecard with bed occupancy rate
Present the topic in a bit more detail with this Hospital Performance Data Scorecard With Bed Occupancy Rate. Use it as a tool for discussion and navigation on Scorecard, Occupancy, Performance. This template is free to edit as deemed fit for your organization. Therefore download it now.
-
 Hospital performance data scorecard with inpatient morality rate
Present the topic in a bit more detail with this Hospital Performance Data Scorecard With Inpatient Morality Rate. Use it as a tool for discussion and navigation on Scorecard, Hospital, Performance. This template is free to edit as deemed fit for your organization. Therefore download it now.
-
 Hospital performance data scorecard with readmission rate hospital performance
Present the topic in a bit more detail with this Hospital Performance Data Scorecard With Readmission Rate Hospital Performance. Use it as a tool for discussion and navigation on Scorecard, Hospital, Performance. This template is free to edit as deemed fit for your organization. Therefore download it now.
-
 Action Plan To Improve Employee Engagement Performance Dashboard With Participation Rate
This slide shows a Employee Engagement Performance Dashboard with variables such as engagement score, participation rate, NPS net promoter score, engagement score by driver etc. Deliver an outstanding presentation on the topic using this Action Plan To Improve Employee Engagement Performance Dashboard With Participation Rate. Dispense information and present a thorough explanation of Engagement Score, Participation Rate, Engagement Score By Drivers, Engagement Score Over Time using the slides given. This template can be altered and personalized to fit your needs. It is also available for immediate download. So grab it now.
-
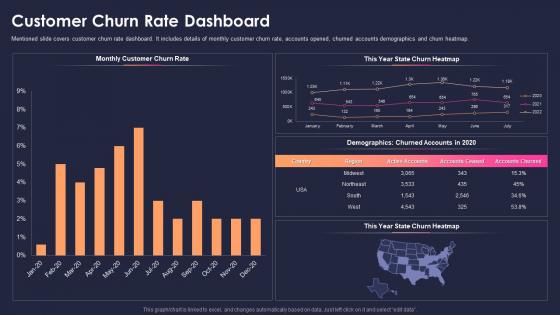 Measure sustainability key performance indicators customer churn rate dashboard
Mentioned slide covers customer churn rate dashboard. It includes details of monthly customer churn rate, accounts opened, churned accounts demographics and churn heatmap. Deliver an outstanding presentation on the topic using this Measure Sustainability Key Performance Indicators Customer Churn Rate Dashboard. Dispense information and present a thorough explanation of Monthly Customer, Churn Rate, Demographics, Churned Accounts 2020 using the slides given. This template can be altered and personalized to fit your needs. It is also available for immediate download. So grab it now.
-
 Measure sustainability key performance indicators effective rate metrics customer
This slide covers effective rate metrics. It shows over year over comparison of effective rate per customer as well as effective rate per offering. Present the topic in a bit more detail with this Measure Sustainability Key Performance Indicators Effective Rate Metrics Customer. Use it as a tool for discussion and navigation on Effective Rate per Customer, Effective Rate per Offering. This template is free to edit as deemed fit for your organization. Therefore download it now.
-
 New product performance evaluation customer retention rate of the product
Purpose of the following slide is to show the customer retention rate of the product as the provided graph displays the retention rate over the months along with the key takeaways Present the topic in a bit more detail with this New Product Performance Evaluation Customer Retention Rate Of The Product. Use it as a tool for discussion and navigation on Customer Retention Rate Of The Product. This template is free to edit as deemed fit for your organization. Therefore download it now.
-
 Marketing website scorecard marketing website monthly performance scorecard conversion rate
Deliver an outstanding presentation on the topic using this Marketing Website Scorecard Marketing Website Monthly Performance Scorecard Conversion Rate. Dispense information and present a thorough explanation of Performance, Scorecard, Conversion using the slides given. This template can be altered and personalized to fit your needs. It is also available for immediate download. So grab it now.
-
 Marketing website scorecard marketing website weekly performance scorecard bounce rate
Present the topic in a bit more detail with this Marketing Website Scorecard Marketing Website Weekly Performance Scorecard Bounce Rate. Use it as a tool for discussion and navigation on Marketing, Performance, Scorecard. This template is free to edit as deemed fit for your organization. Therefore download it now.
-
 Corporate Dashboard Snapshot Showing Details About Financial Performance And Ratios
This graph or chart is linked to excel, and changes automatically based on data. Just left click on it and select Edit Data. Presenting our well structured Corporate Dashboard Snapshot Showing Details About Financial Performance And Ratios. The topics discussed in this slide are Revenue YTD 2022, Short Term Assets, Global Financial Performance, Quick Ratio I Current Ratio I Debt Equity. This is an instantly available PowerPoint presentation that can be edited conveniently. Download it right away and captivate your audience.
-
 Cash Performance Highlights With Turnover Rate
Present the topic in a bit more detail with this Cash Performance Highlights With Turnover Rate. Use it as a tool for discussion and navigation on Payable Outstanding, Sales Outstanding, Cash Conversion. This template is free to edit as deemed fit for your organization. Therefore download it now.
-
 360 Degree Employee Performance Review Rating
This slide covers 360 degree staff feedback rating sheet. It include KPIs such as participation, employee review, manager review, HR review, peer review, etc. Presenting our well structured 360 Degree Employee Performance Review Rating. The topics discussed in this slide are Cycle Participation Status, Business Analyst, Customer Service. This is an instantly available PowerPoint presentation that can be edited conveniently. Download it right away and captivate your audience.
-
 Workforce Performance Assessment With 360 Degree Appraisal Rating Sheet
This slide covers staff performance feedback form. It includes employee ratings by peers, self, direct report, and direct management. Introducing our Workforce Performance Assessment With 360 Degree Appraisal Rating Sheet set of slides. The topics discussed in these slides are Building Team, Coaching, Communication, Delegation. This is an immediately available PowerPoint presentation that can be conveniently customized. Download it and convince your audience.
-
 F254 Retail Store Employee Turnover Rate And Retail Store Operations Performance Assessment
This slide visually presents the information regarding the employee turnover rate and engagement score at retail store. It also list main causes behind poor scores such as dissatisfaction with pay and benefits, lack of growth opportunities etc. Deliver an outstanding presentation on the topic using this F254 Retail Store Employee Turnover Rate And Retail Store Operations Performance Assessment. Dispense information and present a thorough explanation of Engagement, Analysis, Information using the slides given. This template can be altered and personalized to fit your needs. It is also available for immediate download. So grab it now.
-
 Campaign Performance Dashboard With Total Conversions Rate
This slide shows a dashboard representing comparison between past and current campaign on the basis of clicks, impressions, click through rate and conversions, total conversions and activity per click. Presenting our well structured Campaign Performance Dashboard With Total Conversions Rate. The topics discussed in this slide are Campaign Statistics, Campaign Performance Dashboard, Total Conversions Rate. This is an instantly available PowerPoint presentation that can be edited conveniently. Download it right away and captivate your audience.
-
 Financial Poor Performance Dashboard With Accounting Ratios
This slide contains the information of the financial sector of the company to know where it stands and what needs to be done to improve the performance. It includes multiple ratios ROA, ROE, working capital ration and Presenting our well-structured Financial Poor Performance Dashboard With Accounting Ratios. The topics discussed in this slide are Return On Assets, Return On Equity, Debt Equity Ratio, Working Capital Ratio. This is an instantly available PowerPoint presentation that can be edited conveniently. Download it right away and captivate your audience.
-
 Digital Audit Dashboard Indicating Bounce And Churn Rate Procedure To Perform Digital Marketing Audit
This slide showcases the dashboard of website digital audit which includes the visitors, leads, customers, MRR, lifetime value, website visitors by channel and top landing page with average per customer revenue. Present the topic in a bit more detail with this Digital Audit Dashboard Indicating Bounce And Churn Rate Procedure To Perform Digital Marketing Audit. Use it as a tool for discussion and navigation on Dashboard, Successful Payment, Gross Volume. This template is free to edit as deemed fit for your organization. Therefore download it now.
-
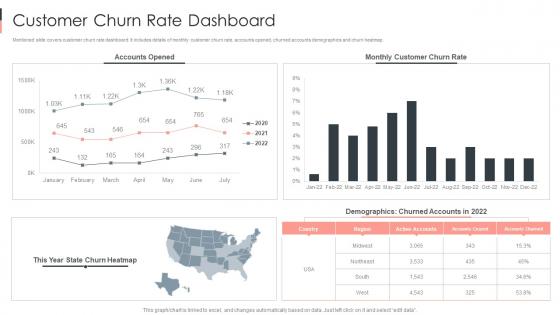 Customer Churn Rate Dashboard Business Sustainability Performance Indicators
Mentioned slide covers customer churn rate dashboard. It includes details of monthly customer churn rate, accounts opened, churned accounts demographics and churn heatmap. Present the topic in a bit more detail with this Customer Churn Rate Dashboard Business Sustainability Performance Indicators. Use it as a tool for discussion and navigation on Dashboard, Demographics, Customer. This template is free to edit as deemed fit for your organization. Therefore download it now.
-
 Effective Rate Metrics By Customer And Offering Business Sustainability Performance Indicators
This slide covers effective rate metrics. It shows over year over comparison of effective rate per customer as well as effective rate per offering. Deliver an outstanding presentation on the topic using this Effective Rate Metrics By Customer And Offering Business Sustainability Performance Indicators. Dispense information and present a thorough explanation of Comparison, Customer, Effective using the slides given. This template can be altered and personalized to fit your needs. It is also available for immediate download. So grab it now.
-
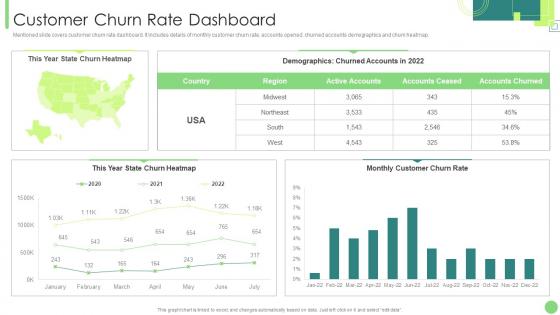 Customer Churn Rate Dashboard Kpis To Assess Business Performance
Mentioned slide covers customer churn rate dashboard. It includes details of monthly customer churn rate, accounts opened, churned accounts demographics and churn heatmap. Present the topic in a bit more detail with this Customer Churn Rate Dashboard Kpis To Assess Business Performance. Use it as a tool for discussion and navigation on Dashboard, Demographics, Customer. This template is free to edit as deemed fit for your organization. Therefore download it now.
-
 Customer Retention Rate Of The Product Annual Product Performance Report Ppt Designs
Purpose of the following slide is to show the customer retention rate of the product as the provided graph displays the retention rate over the months along with the key takeaways. Present the topic in a bit more detail with this Customer Retention Rate Of The Product Annual Product Performance Report Ppt Designs. Use it as a tool for discussion and navigation on Customer Retention Rate Of The Product. This template is free to edit as deemed fit for your organization. Therefore download it now.
-
 Financial Performance KPI Dashboard With Liquidity And Turnover Ratios
This slide shows dashboard financial performance KPIs. It covers quick ratios, current ratios, cash balance, days sales, inventory and payable outstanding. Presenting our well-structured Financial Performance KPI Dashboard With Liquidity And Turnover Ratios. The topics discussed in this slide are Sales Outstanding, Inventory Outstanding, Payable Outstanding. This is an instantly available PowerPoint presentation that can be edited conveniently. Download it right away and captivate your audience.
-
 Financial Performance KPI Dashboard With Working Capital And Cash Conversion Ratios
This slide shows dashboard of finance KPIs. It covers working capital, cash conversion cycle, vendor payment error rate, current assets and liabilities. Introducing our Financial Performance KPI Dashboard With Working Capital And Cash Conversion Ratios set of slides. The topics discussed in these slides are Current Assets, Current Working Capital, Current Liabilities. This is an immediately available PowerPoint presentation that can be conveniently customized. Download it and convince your audience.
-
 Employee Safety Key Performance Indicator Dashboard With Case Incident Rate
The following slide highlights the employee safety key performance indicator dashboard with case incident rate illustrating total case occurrence rate, last reported case, days without reported, causing items, corrective actions, incident pyramid, incident by month and major causes Presenting our well-structured Employee Safety Key Performance Indicator Dashboard With Case Incident Rate. The topics discussed in this slide are Major Incident Causes, Incident Pyramid, Corrective Actions. This is an instantly available PowerPoint presentation that can be edited conveniently. Download it right away and captivate your audience.
-
 Safety Key Performance Indicator Dashboard Snapshot With Hazard Ratings
The slide highlights the safety key performance dashboard snapshot with hazard ratings. It showcases key performance indicator, open hazards by rating, categorization, types, status, related risk and hazards by department and rating Introducing our Safety Key Performance Indicator Dashboard With Hazard Ratings set of slides. The topics discussed in these slides are Safety, Key Performance Indicator, Dashboard, Hazard Ratings. This is an immediately available PowerPoint presentation that can be conveniently customized. Download it and convince your audience.
-
 Product Marketing Leadership To Drive Business Performance Post Strategy Implementation Lead Conversion Rate
This slide shows the forecasted positive impact of companys product marketing strategies on lead conversion rate. Additionally, it provides the key insights and reason behind the increase in lead conversion rate of the company Deliver an outstanding presentation on the topic using this Product Marketing Leadership To Drive Business Performance Post Strategy Implementation Lead Conversion Rate. Dispense information and present a thorough explanation of Strategy, Implementation, Conversion Rate using the slides given. This template can be altered and personalized to fit your needs. It is also available for immediate download. So grab it now.
-
 Global Financial Performance Dashboard With Liquidity Ratios
This showcases dashboard that can help organization to analyze the financial performance and ability to pay short term debts. Its key components are global financial performance, liquidity ratios and short term assets Presenting our well-structured Global Financial Performance Dashboard With Liquidity Ratios. The topics discussed in this slide are Global Financial Performance, Dashboard, Liquidity Ratios. This is an instantly available PowerPoint presentation that can be edited conveniently. Download it right away and captivate your audience.
-
 Website Performance And Conversion Rate Analytics
This slide covers dashboard showing webpage performance based on multiple KPIs. It includes elements such as users count, active sessions, conversation rate and cost, cost per click, top campaign performance, top countries by sessions, most engaged digital channels, etc. Introducing our Website Performance And Conversion Rate Analytics set of slides. The topics discussed in these slides are Website Performance, Conversion Rate Analytics. This is an immediately available PowerPoint presentation that can be conveniently customized. Download it and convince your audience.
-
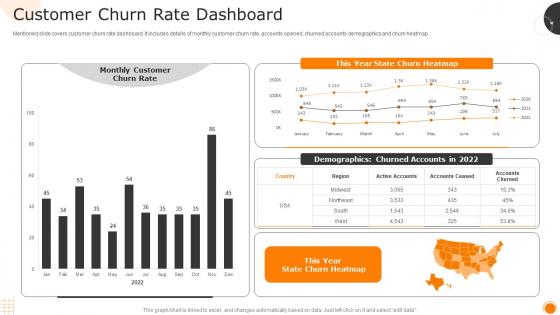 Customer Churn Rate Dashboard Measuring Business Performance Using Kpis
Mentioned slide covers customer churn rate dashboard. It includes details of monthly customer churn rate, accounts opened, churned accounts demographics and churn heatmap. Present the topic in a bit more detail with this Customer Churn Rate Dashboard Measuring Business Performance Using Kpis. Use it as a tool for discussion and navigation on Dashboard, Demographics, Customer. This template is free to edit as deemed fit for your organization. Therefore download it now.
-
 Effective Rate Metrics By Customer And Offering Measuring Business Performance Using Kpis
This slide covers effective rate metrics. It shows over year over comparison of effective rate per customer as well as effective rate per offering. Present the topic in a bit more detail with this Effective Rate Metrics By Customer And Offering Measuring Business Performance Using Kpis. Use it as a tool for discussion and navigation on Comparison, Effective, Customer. This template is free to edit as deemed fit for your organization. Therefore download it now.
-
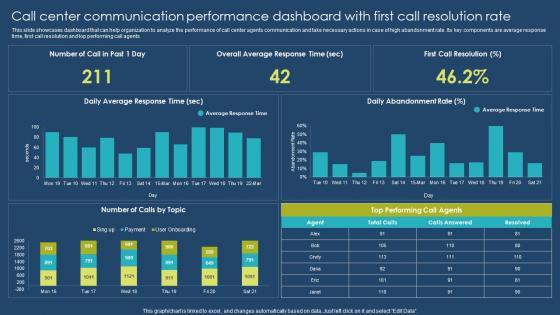 Call Center Communication Performance Dashboard With First Call Resolution Rate
This slide showcases dashboard that can help organization to analyze the performance of call center agents communication and take necessary actions in case of high abandonment rate. Its key components are average response time, first call resolution and top performing call agents Introducing our Call Center Communication Performance Dashboard With First Call Resolution Rate set of slides. The topics discussed in these slides are Call Center, Communication Performance, Dashboard, Call Resolution Rate. This is an immediately available PowerPoint presentation that can be conveniently customized. Download it and convince your audience.
-
 Retail Store Employee Turnover Rate And Engagement Score Retail Store Performance
This slide visually presents the information regarding the employee turnover rate and engagement score at retail store. It also list main causes behind poor scores such as dissatisfaction with pay and benefits, lack of growth opportunities etc. Present the topic in a bit more detail with this Retail Store Employee Turnover Rate And Engagement Score Retail Store Performance. Use it as a tool for discussion and navigation on Employee Engagement Score, Turnover Rate, Identified Causes. This template is free to edit as deemed fit for your organization. Therefore download it now.
-
 Company Financial Performance Pitch Book With Debt To Equity Ratio
This slide displays dashboard to track fiscal performance of organization to provide executives clear presentation of data for more granular view of the business. It includes KPIs like current revenue, quick ratio, and short term assets. Introducing our Company Financial Performance Pitch Book With Debt To Equity Ratio set of slides. The topics discussed in these slides are Global Financial, Company Financial. This is an immediately available PowerPoint presentation that can be conveniently customized. Download it and convince your audience.
-
 Performance Tracking Dashboard With Users Detail And Conversion Rate
This slide displays the performance of subscribers in dashboard with the number of total active users that are pain or free. It also includes conversion rate of persons and the target to achieve for the same. Introducing our Performance Tracking Dashboard With Users Detail And Conversion Rate set of slides. The topics discussed in these slides are Performance Tracking, Dashboard Users, Detail Conversion. This is an immediately available PowerPoint presentation that can be conveniently customized. Download it and convince your audience.
-
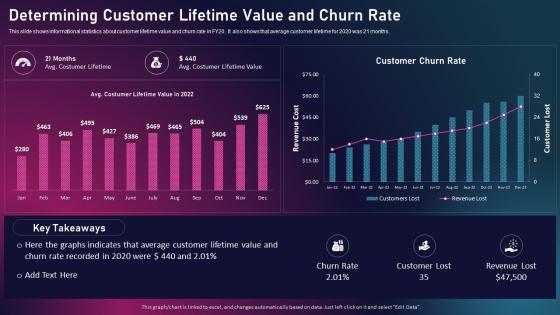 Enhancing Business Performance Through Determining Customer Lifetime Value And Churn Rate
This slide shows informational statistics about customer lifetime value and churn rate in FY20. It also shows that average customer lifetime for 2020 was 21 months. Deliver an outstanding presentation on the topic using this Enhancing Business Performance Through Determining Customer Lifetime Value And Churn Rate. Dispense information and present a thorough explanation of Customer Lifetime Value, Churn Rate, Revenue Lost using the slides given. This template can be altered and personalized to fit your needs. It is also available for immediate download. So grab it now.
-
 Impact 3 Increase In Customer Retention Rate Performance Improvement Plan For Efficient Customer Service
This slide showcases the impact of good support service on the company. The metrics covered are customer satisfaction and retention. Present the topic in a bit more detail with this Impact 3 Increase In Customer Retention Rate Performance Improvement Plan For Efficient Customer Service. Use it as a tool for discussion and navigation on Personalized, Experiences, Transparency. This template is free to edit as deemed fit for your organization. Therefore download it now.
-
 Issue 3 Declining Customer Retention Rate Performance Improvement Plan For Efficient Customer Service
This slide provides an overview of major KPIs of customer service team. The metrics covered are customer satisfaction and retention. Present the topic in a bit more detail with this Issue 3 Declining Customer Retention Rate Performance Improvement Plan For Efficient Customer Service. Use it as a tool for discussion and navigation on Services, Transparency, Commitment . This template is free to edit as deemed fit for your organization. Therefore download it now.
-
 Employee Performance Review Process Step 4 Employee Performance Rating Criteria
This slide shows the employee performance rating criteria which will be using for giving scores to each competency during the performance review process. Present the topic in a bit more detail with this Employee Performance Review Process Step 4 Employee Performance Rating Criteria. Use it as a tool for discussion and navigation on Satisfactory, Unsatisfactory, Outstanding, Roles And Responsibilities. This template is free to edit as deemed fit for your organization. Therefore download it now.
-
 Marketing Campaign Report To Track Conversion Rates Marketing Campaign Performance
This slide covers social media marketing campaign tracking. It includes KPIs such as visits, revenue, transaction, conversion rate, etc. It also includes ads such as organic, paid search, referral, direct, social, email, campaign, and display. Deliver an outstanding presentation on the topic using this Marketing Campaign Report To Track Conversion Rates Marketing Campaign Performance. Dispense information and present a thorough explanation of Marketing Campaign, Conversion Rates using the slides given. This template can be altered and personalized to fit your needs. It is also available for immediate download. So grab it now.
-
 Employee Retention Rate Work From Home Performance Management Dashboard
The following slide outlines a comprehensive key performance indicator KPI dashboard that can be used to showcase employees performance during work from home WFH. Information covered in this slide is related to average result area scores etc. Present the topic in a bit more detail with this Employee Retention Rate Work From Home Performance Management Dashboard. Use it as a tool for discussion and navigation on Adequate, Result Areas, Performance Management. This template is free to edit as deemed fit for your organization. Therefore download it now.
-
 Impact Of Flexible Working On Employees Performance Improving Employee Retention Rate
The following slide showcases the impact of remote working on performance of the workforce. Employee productivity, job satisfaction, employee retention and absenteeism rate are the major factors that are mentioned in the slide along with key insights. Deliver an outstanding presentation on the topic using this Impact Of Flexible Working On Employees Performance Improving Employee Retention Rate. Dispense information and present a thorough explanation of Key Insights, Percentage, Rate Of Employees using the slides given. This template can be altered and personalized to fit your needs. It is also available for immediate download. So grab it now.
-
 Procurement Performance Balanced Scorecard With Supplier Rating
This slide shows purchase performance scorecard with vendor rating. It provides information about return percentage, stock availability, defect rate, quality score, average rating, etc. Presenting our well structured Procurement Performance Balanced Scorecard With Supplier Rating. The topics discussed in this slide are Supplier Quality Rating, Return Percentage, Stock Availability. This is an instantly available PowerPoint presentation that can be edited conveniently. Download it right away and captivate your audience.
-
 Telecom Network Performance And Drop Rate Dashboard
This slide showcases the network performance key performance indicator dashboard in telecom. It includes the number of tickets submitted, ticket status, drop rate by location, etc. Introducing our Telecom Network Performance And Drop Rate Dashboard set of slides. The topics discussed in these slides are Rate, Performance, Network. This is an immediately available PowerPoint presentation that can be conveniently customized. Download it and convince your audience.
-
 Vendor Performance Report With Rating And Status
The purpose of this slide is to measure the performance and effectiveness of vendors and suppliers who provides goods or services to the company. Certain metrics include quality, delivery, cost, local factors, and order count Introducing our Vendor Performance Report With Rating And Status set of slides. The topics discussed in these slides are Deliveries On Time, Vendor Personal Details . This is an immediately available PowerPoint presentation that can be conveniently customized. Download it and convince your audience.
-
 E Mail Marketing Client Engagement Performance Rate
The purpose of this slide is to showcase the e mail analytics that provides an overview of the target audience engagement rate with an ongoing campaign. The KPIs include e-mail sent, open rate, click and engagement rate. Presenting our well structured E Mail Marketing Client Engagement Performance Rate. The topics discussed in this slide are E Mail Marketing, Client Engagement, Performance Rate. This is an instantly available PowerPoint presentation that can be edited conveniently. Download it right away and captivate your audience.
-
 E Mail Opening Rate Performance Statistics
This slide showcases the line graph that measures the opening rate of an e-mail on various devices. It includes the data figures of devices like desktop, mobile, and tablets to operate mail of the past seven years. Introducing our E Mail Opening Rate Performance Statistics set of slides. The topics discussed in these slides are E Mail Opening Rate, Performance Statistics . This is an immediately available PowerPoint presentation that can be conveniently customized. Download it and convince your audience.
-
 Team Performance Rating KPI Dashboard How Leaders Can Boost DK SS
This slide showcases KPI dashboard which can help managers display and review performance ratings. It provides details about adequate, needs help, supervisory skills, result areas, result area scores, etc. Present the topic in a bit more detail with this Team Performance Rating KPI Dashboard How Leaders Can Boost DK SS. Use it as a tool for discussion and navigation on Performance, Team, Rating. This template is free to edit as deemed fit for your organization. Therefore download it now.
-
 Inbound Lead Performance Tracking Dashboard Maximizing Customer Lead Conversion Rates
This slide covers the KPI dashboard for evaluating inbound lead performance. It includes metrics such as lead to opportunity ratio, opportunity to win ratio, lead conversion ratio, inbound leads, and leads in the sales funnel.Deliver an outstanding presentation on the topic using this Inbound Lead Performance Tracking Dashboard Maximizing Customer Lead Conversion Rates. Dispense information and present a thorough explanation of Lead Conversion Ratio, Opportunity Ratio, Inbound Leads using the slides given. This template can be altered and personalized to fit your needs. It is also available for immediate download. So grab it now.
-
 Supplier Performance Dashboard With Rejection Rate
Presenting our well structured Supplier Performance Dashboard With Rejection Rate. The topics discussed in this slide are Supplier Performance, Dashboard Rejection Rate. This is an instantly available PowerPoint presentation that can be edited conveniently. Download it right away and captivate your audience.
-
 Financial performance kpi dashboard showing burn rate opex ratio gross profit
Presenting this set of slides with name - Financial Performance Kpi Dashboard Showing Burn Rate Opex Ratio Gross Profit. This is a four stage process. The stages in this process are Financial Performance, Financial Report, Financial Review.
-
 Financial performance kpi dashboard showing payroll headcount ratio cost per lead
Presenting this set of slides with name - Financial Performance Kpi Dashboard Showing Payroll Headcount Ratio Cost Per Lead. This is a seven stage process. The stages in this process are Financial Performance, Financial Report, Financial Review.


