Powerpoint Templates and Google slides for Performance Dashboard
Save Your Time and attract your audience with our fully editable PPT Templates and Slides.
-
 Effective Guide To Ensure Stakeholder KPI Dashboard To Track Project Management And Performance
Following slide represents dashboard to track project overall performance. It includes indicators such as progress, time duration , risks and issues. Deliver an outstanding presentation on the topic using this Effective Guide To Ensure Stakeholder KPI Dashboard To Track Project Management And Performance. Dispense information and present a thorough explanation of Kpi Dashboard, Project Management And Performance, Dashboard To Track Project, Risks And Issues using the slides given. This template can be altered and personalized to fit your needs. It is also available for immediate download. So grab it now.
-
 Facebook Ads Strategy To Improve Dashboard For Tracking Facebook Post Performance Strategy SS V
The following slide outlines dashboard through which advertisers can manage Facebook post performance and optimize their marketing strategy. Information covered in this slide is related to key metrics such as impressions per post, engagement rate, click-through rate CTR, likes, etc. Present the topic in a bit more detail with this Facebook Ads Strategy To Improve Dashboard For Tracking Facebook Post Performance Strategy SS V. Use it as a tool for discussion and navigation on Dashboard For Tracking, Facebook Post Performance, Engagement Rate, Marketing Strategy. This template is free to edit as deemed fit for your organization. Therefore download it now.
-
 Facebook Ads Strategy To Improve Facebook Ads Dashboard With Campaign Performance Strategy SS V
The following slide outlines comprehensive dashboard through which advertisers can monitor Facebook ads performance. The KPIs outlined in slide are ad spend, conversions, cost per conversion, cost per action, brand impressions, clicks, etc. Present the topic in a bit more detail with this Facebook Ads Strategy To Improve Facebook Ads Dashboard With Campaign Performance Strategy SS V. Use it as a tool for discussion and navigation on Comprehensive Dashboard, Facebook Ads Performance, Cost Per Conversion, Cost Per Action, Brand Impressions. This template is free to edit as deemed fit for your organization. Therefore download it now.
-
 Dashboard To Track Cobot Performance Perfect Synergy Between Humans And Robots
This slide represents the Cobots performance dashboard by covering details of battery level, performance, total hours, average time, time to return, energy consumption, and so on. Present the topic in a bit more detail with this Dashboard To Track Cobot Performance Perfect Synergy Between Humans And Robots. Use it as a tool for discussion and navigation on Dashboard To Track Cobot Performance. This template is free to edit as deemed fit for your organization. Therefore download it now.
-
 SD WAN Model Firewall As A Service Fwaas Performance Tracking Dashboard
This slide demonstrates the performance tracking dashboard for secure access service edge. The purpose of this slide is to showcase the overall performance of the SASE model, including connections, critical network alarms, critical security alerts, application volume, risky applications, and unblocked security threats. Deliver an outstanding presentation on the topic using this SD WAN Model Firewall As A Service Fwaas Performance Tracking Dashboard. Dispense information and present a thorough explanation of Performance Tracking Dashboard, Secure Access Service Edge, Critical Network Alarms, Critical Security Alerts, Risky Applications using the slides given. This template can be altered and personalized to fit your needs. It is also available for immediate download. So grab it now.
-
 Performance Dashboard To Measure Business Growth Plan To Increase Strategy SS V
The following slide outlines key performance indicator KPI dashboard that can assist digital marketers to evaluate marketing campaign performance. The success metrics outlined in slide are total spend on advertisement, cost per thousand CPM, cost per click CPC, click through rate CTR, etc. Present the topic in a bit more detail with this Performance Dashboard To Measure Business Growth Plan To Increase Strategy SS V. Use it as a tool for discussion and navigation on Campaign, Performance, Marketing. This template is free to edit as deemed fit for your organization. Therefore download it now.
-
 Performance Dashboard Monitoring Staff Turnover Rate Comprehensive Onboarding Program
This slide presents a dashboard illustrating the impact of effective employee onboarding. It includes information about, employee turnover, turnover rate, average years tenure, turnovers per quarter, turnover percentage per department and type of turnover voluntary or involuntary.Present the topic in a bit more detail with this Performance Dashboard Monitoring Staff Turnover Rate Comprehensive Onboarding Program. Use it as a tool for discussion and navigation on Turnovers Per Quarter, Employee Turnover, Per Department. This template is free to edit as deemed fit for your organization. Therefore download it now.
-
 Performance Dashboard Tracking For Measuring Comprehensive Onboarding Program
This slide represents a dashboard tracking employee experience KPIs. It includes information about metrics such as employee engagement, experience vs expectation and intent to stay. Deliver an outstanding presentation on the topic using this Performance Dashboard Tracking For Measuring Comprehensive Onboarding Program. Dispense information and present a thorough explanation of Employee Engagement, Experience Expectations, Increase Engagement using the slides given. This template can be altered and personalized to fit your needs. It is also available for immediate download. So grab it now.
-
 Essential Guide To Database Marketing Kpi Dashboard To Analyze Overall Business Performance MKT SS V
The purpose of this slide is to highlight dashboard through which marketers can evaluate success of targeted marketing strategies on company performance. It covers major metrics such as branded search, customer value, advertising budget, website conversion rate, etc. Deliver an outstanding presentation on the topic using this Essential Guide To Database Marketing Kpi Dashboard To Analyze Overall Business Performance MKT SS V Dispense information and present a thorough explanation of Customer Value, Demographic Breakdown, Digital using the slides given. This template can be altered and personalized to fit your needs. It is also available for immediate download. So grab it now.
-
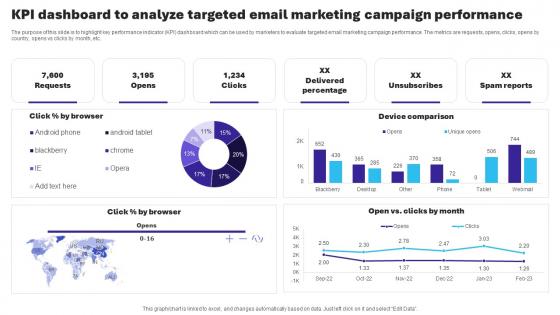 KPI Dashboard To Analyze Targeted Email Marketing Campaign Performance Essential Guide To Database MKT SS V
The purpose of this slide is to highlight key performance indicator KPI dashboard which can be used by marketers to evaluate targeted email marketing campaign performance. The metrics are requests, opens, clicks, opens by country, opens vs clicks by month, etc. Deliver an outstanding presentation on the topic using this KPI Dashboard To Analyze Targeted Email Marketing Campaign Performance Essential Guide To Database MKT SS V Dispense information and present a thorough explanation of KPI Dashboard Analyze Targeted, Email Marketing Campaign Performance using the slides given. This template can be altered and personalized to fit your needs. It is also available for immediate download. So grab it now.
-
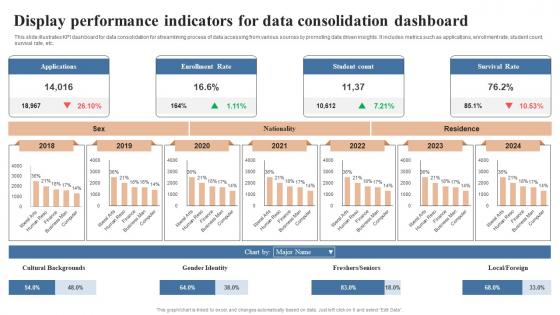 Display Performance Indicators For Data Consolidation Dashboard
This slide illustrates KPI dashboard for data consolidation for streamlining process of data accessing from various sources by promoting data driven insights. It includes metrics such as applications, enrollment rate, student count, survival rate, etc. Introducing our Display Performance Indicators For Data Consolidation Dashboard set of slides. The topics discussed in these slides are Applications, Enrollment Rate, Survival Rate This is an immediately available PowerPoint presentation that can be conveniently customized. Download it and convince your audience.
-
 Performance Dashboard To Measure Non Profit Fundraising
This slide highlights performance dashboard to track non profit fundraising. The purpose of this slide is to show KPIs to measure for donors overview. It includes total raised, public, corporate cumulative, raised each month, etc.Presenting our well structured Performance Dashboard To Measure Non Profit Fundraising. The topics discussed in this slide are Performance Dashboard, Measure Non Profit Fundraising. This is an instantly available PowerPoint presentation that can be edited conveniently. Download it right away and captivate your audience.
-
 Comprehensive Integrated Marketing Kpi Dashboard To Review Campaign Performance MKT SS V
The following slide depicts key performance indicators to evaluate effectiveness of campaign performance. It includes elements such as total revenue, marketing spend, leads, cost per acquisition, profits, return on investments etc. Present the topic in a bit more detail with this Comprehensive Integrated Marketing Kpi Dashboard To Review Campaign Performance MKT SS V Use it as a tool for discussion and navigation on Personalization Benefits, Traditional To Online Channels This template is free to edit as deemed fit for your organization. Therefore download it now.
-
 Dashboard Illustrating Customer Engagement Performance Metric Strategies To Boost Customer
This slide represents a dashboard highlighting organizationscurrentKPIperformancefollowingtheadoptionofasuccessfulcustomerengagementstrategy. It includes Net promoter score, customer effort score, NPS and CES monthly growth and satisfaction score. Deliver an outstanding presentation on the topic using this Dashboard Illustrating Customer Engagement Performance Metric Strategies To Boost Customer Dispense information and present a thorough explanation of Development, Customer Effort, Performance Metric using the slides given. This template can be altered and personalized to fit your needs. It is also available for immediate download. So grab it now.
-
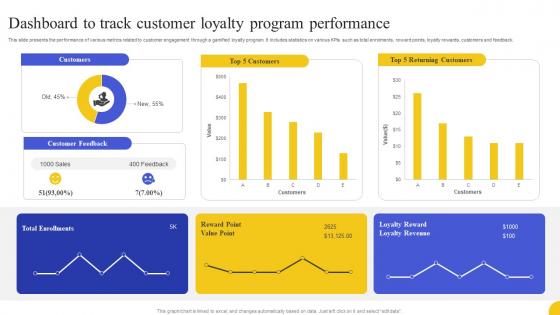 Dashboard To Track Customer Loyalty Program Performance Strategies To Boost Customer
This slide presents the performance of various metrics related to customer engagement through a gamified loyalty program. It includes statistics on various KPIs such as total enrolments, reward points, loyalty rewards, customers and feedback. Present the topic in a bit more detail with this Dashboard To Track Customer Loyalty Program Performance Strategies To Boost Customer Use it as a tool for discussion and navigation on Customers, Returning Customers, Program Performance This template is free to edit as deemed fit for your organization. Therefore download it now.
-
 Key Performance Sales Plan Dashboard
This slide showcases the key indicators performing well in a form of dashboard. Its purpose is to help understand the manager areas with facts and figures easily. It includes sales area, location, net profit, customer retention, etc. Introducing our Key Performance Sales Plan Dashboard set of slides. The topics discussed in these slides are Sales Area, Units Per Transaction. This is an immediately available PowerPoint presentation that can be conveniently customized. Download it and convince your audience.
-
 Unlocking Power Of Mutual Dashboard To Track Mutual Funds Performance Fin SS
This slide shows dashboard which can be used by investors to keep a regular track on their mutual funds investments. It includes index, investment amount, current value, rate of return ROI, etc. Present the topic in a bit more detail with this Your Investment, Current Value, Invested Funds Use it as a tool for discussion and navigation on Your Investment, Current Value, Invested Funds This template is free to edit as deemed fit for your organization. Therefore download it now.
-
 Wealth Management Dashboard To Evaluate Performance Of Wealth Management Fin SS
This slide shows dashboard which can be used by wealth management organizations to measure the performance . It includes metrics such as assets under management, satisfaction rate, revenue, etc. Present the topic in a bit more detail with this Wealth Management Dashboard To Evaluate Performance Of Wealth Management Fin SS Use it as a tool for discussion and navigation on Wealth Management, Investment Management This template is free to edit as deemed fit for your organization. Therefore download it now.
-
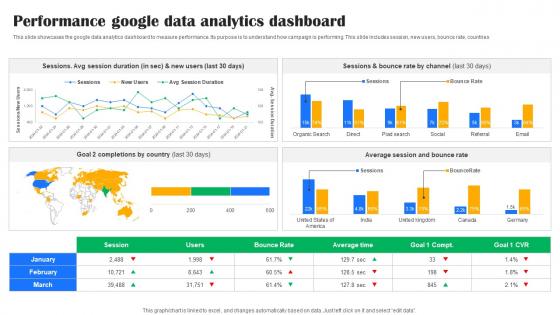 Performance Google Data Analytics Dashboard
This slide showcases the google data analytics dashboard to measure performance. Its purpose is to understand how campaign is performing. This slide includes session, new users, bounce rate, countries. Introducing our Performance Google Data Analytics Dashboard set of slides. The topics discussed in these slides are Performance, Google Data Analytics, Dashboard This is an immediately available PowerPoint presentation that can be conveniently customized. Download it and convince your audience.
-
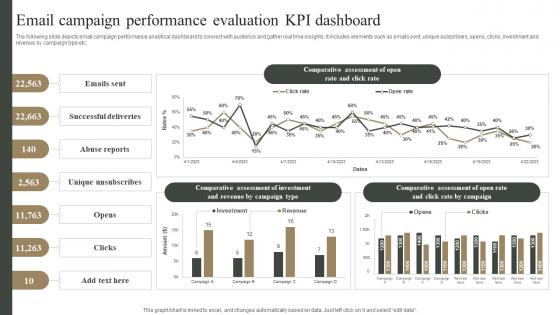 Email Campaign Performance Evaluation KPI Dashboard Measuring Marketing Success MKT SS V
The following slide depicts email campaign performance analytical dashboard to connect with audience and gather real time insights. It includes elements such as emails sent, unique subscribers, opens, clicks, investment and revenue by campaign type etc. Deliver an outstanding presentation on the topic using this Email Campaign Performance Evaluation KPI Dashboard Measuring Marketing Success MKT SS V Dispense information and present a thorough explanation of Successful Deliveries, Abuse Reports, Unique Unsubscribes using the slides given. This template can be altered and personalized to fit your needs. It is also available for immediate download. So grab it now.
-
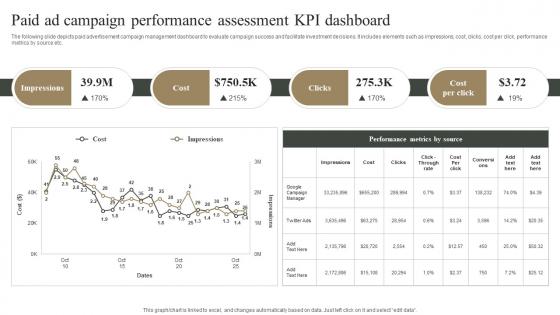 Paid Ad Campaign Performance Assessment KPI Dashboard Measuring Marketing Success MKT SS V
The following slide depicts paid advertisement campaign management dashboard to evaluate campaign success and facilitate investment decisions. It includes elements such as impressions, cost, clicks, cost per click, performance metrics by source etc. Present the topic in a bit more detail with this Paid Ad Campaign Performance Assessment KPI Dashboard Measuring Marketing Success MKT SS V Use it as a tool for discussion and navigation on Impressions, Campaign Performance, Assessment This template is free to edit as deemed fit for your organization. Therefore download it now.
-
 Implementing Big Data Analytics Effective Supplier Performance Assessment Dashboard CRP DK SS
This slide showcases dashboard for analyzing supplier performance with KPIs such as defect rate, on time supplies, average procurement cycle, delivery time etc. Deliver an outstanding presentation on the topic using this Implementing Big Data Analytics Effective Supplier Performance Assessment Dashboard CRP DK SS. Dispense information and present a thorough explanation of Analyzing Supplier Performance, Average Procurement Cycle, Assessment Dashboard using the slides given. This template can be altered and personalized to fit your needs. It is also available for immediate download. So grab it now.
-
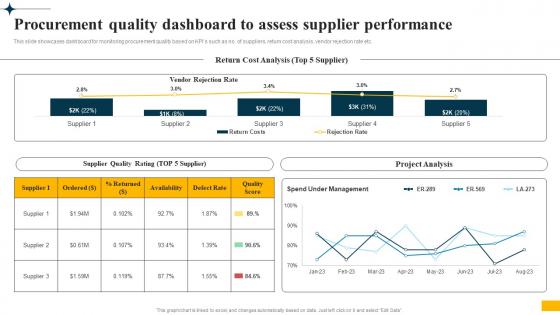 Implementing Big Data Analytics Procurement Quality Dashboard To Assess Supplier Performance CRP DK SS
This slide showcases dashboard for monitoring procurement quality based on KPIs such as no. of suppliers, return cost analysis, vendor rejection rate etc. Present the topic in a bit more detail with this Implementing Big Data Analytics Procurement Quality Dashboard To Assess Supplier Performance CRP DK SS. Use it as a tool for discussion and navigation on Procurement Quality Dashboard, Assess Supplier Performance, Vendor Rejection Rate. This template is free to edit as deemed fit for your organization. Therefore download it now.
-
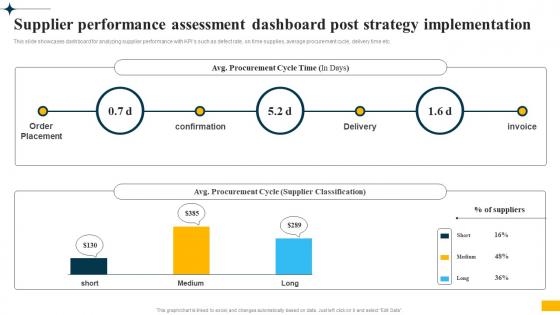 Implementing Big Data Analytics Supplier Performance Assessment Dashboard Post Strategy CRP DK SS
This slide showcases dashboard for analyzing supplier performance with KPIs such as defect rate, on time supplies, average procurement cycle, delivery time etc. Deliver an outstanding presentation on the topic using this Implementing Big Data Analytics Supplier Performance Assessment Dashboard Post Strategy CRP DK SS. Dispense information and present a thorough explanation of Supplier Performance Assessment, Dashboard Post, Strategy Implementation, Average Procurement Cycle using the slides given. This template can be altered and personalized to fit your needs. It is also available for immediate download. So grab it now.
-
 Sase Model Secure Access Service Edge Performance Tracking Dashboard
This slide demonstrates the performance tracking dashboard for secure access service edge. The purpose of this slide is to showcase the overall performance of the SASE model, including connections, critical network alarms, critical security alerts, application volume, risky applications, and unblocked security threats. Present the topic in a bit more detail with this Sase Model Secure Access Service Edge Performance Tracking Dashboard. Use it as a tool for discussion and navigation on Critical Network Alarms, Risky Applications. This template is free to edit as deemed fit for your organization. Therefore download it now.
-
 Dashboard Monitor Performance Sustainable Marketing Principles To Improve Lead Generation MKT SS V
This slide covers dashboard to evaluate the performance of campaigns launched under sustainable marketing. It includes elements such as on leads breakdown, collection of leads under campaigns, Google analytics and web traffic conversion rates, top social media channels under sustainable marketing. Present the topic in a bit more detail with this Dashboard Monitor Performance Sustainable Marketing Principles To Improve Lead Generation MKT SS V. Use it as a tool for discussion and navigation on Key Conversion Metric, Lead Breakdown, Social Media Channels. This template is free to edit as deemed fit for your organization. Therefore download it now.
-
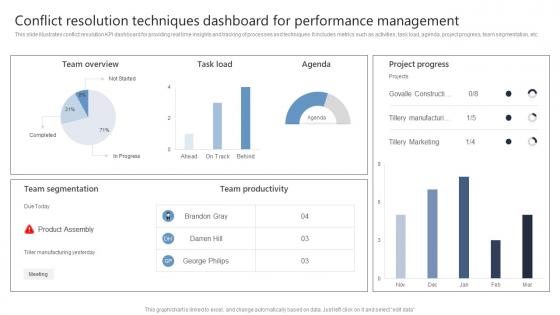 Conflict Resolution Techniques Dashboard For Performance Management
This slide illustrates conflict resolution KPI dashboard for providing real time insights and tracking of processes and techniques. It includes metrics such as activities, task load, agenda, project progress, team segmentation, etc. Introducing our Conflict Resolution Techniques Dashboard For Performance Management set of slides. The topics discussed in these slides are Team Overview, Task Load, Agenda. This is an immediately available PowerPoint presentation that can be conveniently customized. Download it and convince your audience.
-
 Tracking Performance Administration Software Dashboard
This slide showcases the dashboard for measuring management performance on software. Its purpose is to understand the employees performance based on various factors. It includes average age, gender ratio, employee count, etc. Presenting our well structured Tracking Performance Administration Software Dashboard. The topics discussed in this slide are Tracking Performance Administration, Software Dashboard. This is an instantly available PowerPoint presentation that can be edited conveniently. Download it right away and captivate your audience.
-
 Sales Performance Dashboard For Managing Indirect Channels
This slide illustrates sales channel KPI dashboard and includes metrics such as sales trends, categorize sales by countries and products, etc. Introducing our Sales Performance Dashboard For Managing Indirect Channels set of slides. The topics discussed in these slides are Sales Performance Dashboard, Managing Indirect Channels. This is an immediately available PowerPoint presentation that can be conveniently customized. Download it and convince your audience.
-
 Dashboard To Track Online Sales Performance Implementing Marketing Strategies
Following slide exhibits dashboard that help organizations to measure performance of online sales. It include parameters such as number of new customers, sales revenue, profit, sales growth rate, customer acquisition cost etc Deliver an outstanding presentation on the topic using this Dashboard To Track Online Sales Performance Implementing Marketing Strategies. Dispense information and present a thorough explanation of Revenue, Average, Performance using the slides given. This template can be altered and personalized to fit your needs. It is also available for immediate download. So grab it now.
-
 Dashboard To Track Retail Store Performance Post Automation
This slide highlights the dashboard for tracking the performance of a retail automation dashboard. The purpose of this slide is to help monitor business performance through elements such as revenue generated, retail clients, etc. Presenting our well structured Dashboard To Track Retail Store Performance Post Automation. The topics discussed in this slide are Revenue Generated, Retail Clients, Annual Customers. This is an instantly available PowerPoint presentation that can be edited conveniently. Download it right away and captivate your audience.
-
 Customer Journey Optimization Dashboard Illustrating Customer Engagement Performance Metric
This slide presents a framework model that outlines the customer journey and strategy to effectively engage audience. It includes aspects such as stages, goals, responses, metrics and opportunities. Deliver an outstanding presentation on the topic using this Customer Journey Optimization Dashboard Illustrating Customer Engagement Performance Metric Dispense information and present a thorough explanation of Pricing,Service,Quality using the slides given. This template can be altered and personalized to fit your needs. It is also available for immediate download. So grab it now.
-
 Customer Journey Optimization Dashboard To Track Customer Loyalty Program Performance
This slide showcases a dashboard highlighting the customer engagement through social sites. It includes KPIs such as total website traffics, site revenue, fans count and followers. Present the topic in a bit more detail with this Customer Journey Optimization Dashboard To Track Customer Loyalty Program Performance Use it as a tool for discussion and navigation on Customers,Customer Feedback,Returning Customers This template is free to edit as deemed fit for your organization. Therefore download it now.
-
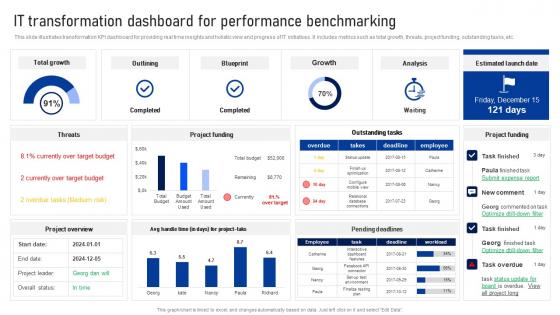 IT Transformation Dashboard For Performance Benchmarking
This slide illustrates transformation KPI dashboard for providing real time insights and holistic view and progress of IT initiatives. It includes metrics such as total growth, threats, project funding, outstanding tasks, etc. Introducing our IT Transformation Dashboard For Performance Benchmarking set of slides. The topics discussed in these slides are Target, Budget, Performance. This is an immediately available PowerPoint presentation that can be conveniently customized. Download it and convince your audience.
-
 Data Encryption Performance Tracking Dashboard Encryption For Data Privacy In Digital Age It
This slide represents the dashboard which can be utilized by organization to monitor cryptographic security. It includes overall progress, number of critical risks identified, initiatives, incident management, compliance, patches, highest number of critical incidents, etc. Deliver an outstanding presentation on the topic using this Data Encryption Performance Tracking Dashboard Encryption For Data Privacy In Digital Age It. Dispense information and present a thorough explanation of Encryption, Performance, Dashboard using the slides given. This template can be altered and personalized to fit your needs. It is also available for immediate download. So grab it now.
-
 KPI Dashboard To Measure Flight Performance In Airline Industry
This slide represents dashboard that helps airline companies measure and improve flight performance and increase their operational efficiency and revenue generation. It includes various KPIs such as total flights, total carriers, average flight duration, canceled flights, etc. Introducing our KPI Dashboard To Measure Flight Performance In Airline Industry set of slides. The topics discussed in these slides are Measure Flight Performance, Airline Industry. This is an immediately available PowerPoint presentation that can be conveniently customized. Download it and convince your audience.
-
 Staff Onboarding And Training Performance Dashboard Monitoring Staff Turnover Rate
This slide presents a dashboard illustrating the impact of effective employee onboarding. It includes information about, employee turnover, turnover rate, average years tenure, turnovers per quarter, turnover percentage per department and type of turnover- voluntary or involuntary. Present the topic in a bit more detail with this Staff Onboarding And Training Performance Dashboard Monitoring Staff Turnover Rate Use it as a tool for discussion and navigation on Employee Engagement, Experience Vs Expectations, Intent To Stay This template is free to edit as deemed fit for your organization. Therefore download it now.
-
 Staff Onboarding And Training Performance Dashboard Tracking For Measuring Employee Experience
This slide represents a dashboard tracking employee experience KPIs. It includes information about metrics such as employee engagement, experience vs expectation and intent to stay. Deliver an outstanding presentation on the topic using this Staff Onboarding And Training Performance Dashboard Tracking For Measuring Employee Experience Dispense information and present a thorough explanation of Sales Representative, Marketing Coordinator, Customer Service Representative using the slides given. This template can be altered and personalized to fit your needs. It is also available for immediate download. So grab it now.
-
 Dashboard To Track Online Sales Performance Comprehensive Guide For Online Sales Improvement
Following slide exhibits dashboard that help organizations to measure performance of online sales. It include parameters such as number of new customers, sales revenue, profit, sales growth rate, customer acquisition cost etc. Present the topic in a bit more detail with this Dashboard To Track Online Sales Performance Comprehensive Guide For Online Sales Improvement. Use it as a tool for discussion and navigation on Average Weekly, Sales Revenue, Above Sales Target, Monthly Sales Growth. This template is free to edit as deemed fit for your organization. Therefore download it now.
-
 New Hire Enrollment Strategy Performance Dashboard Monitoring Staff Turnover Rate
This slide presents a dashboard illustrating the impact of effective employee onboarding. It includes information about, employee turnover, turnover rate, average years tenure, turnovers per quarter, turnover percentage per department and type of turnover- voluntary or involuntary. Present the topic in a bit more detail with this New Hire Enrollment Strategy Performance Dashboard Monitoring Staff Turnover Rate Use it as a tool for discussion and navigation on This slide presents a dashboard illustrating the impact of effective employee onboarding. It includes information about, employee turnover, turnover rate, average years tenure, turnovers per quarter, turnover percentage per department and type of turnover- voluntary or involuntary. This template is free to edit as deemed fit for your organization. Therefore download it now.
-
 New Hire Enrollment Strategy Performance Dashboard Tracking For Measuring Employee Experience
This slide represents a dashboard tracking employee experience KPIs. It includes information about metrics such as employee engagement, experience vs expectation and intent to stay. Deliver an outstanding presentation on the topic using this New Hire Enrollment Strategy Performance Dashboard Tracking For Measuring Employee Experience Dispense information and present a thorough explanation of Employee Engagement, Experience Vs Expectations, Intent To Stay using the slides given. This template can be altered and personalized to fit your needs. It is also available for immediate download. So grab it now.
-
 Dashboard Measuring Individual Performances To Optimise Teamwork
This slide represents key indexes to measure individual performance which assists to enhance functioning and coordination of team. It includes key indexes such as team KPIs, average result area scores, etc. Presenting our well structured Dashboard Measuring Individual Performances To Optimise Teamwork. The topics discussed in this slide are Dashboard, Individual Performances, Teamwork. This is an instantly available PowerPoint presentation that can be edited conveniently. Download it right away and captivate your audience.
-
 Digital Production Process Performance Management Dashboard Enabling Smart Production DT SS
This slide showcases production process performance management dashboard. It provides information about factories, robotic arms, assembly lines, active workers, availability, quality, performance, etc. Present the topic in a bit more detail with this Digital Production Process Performance Management Dashboard Enabling Smart Production DT SS Use it as a tool for discussion and navigation on Production Process, Performance Management This template is free to edit as deemed fit for your organization. Therefore download it now.
-
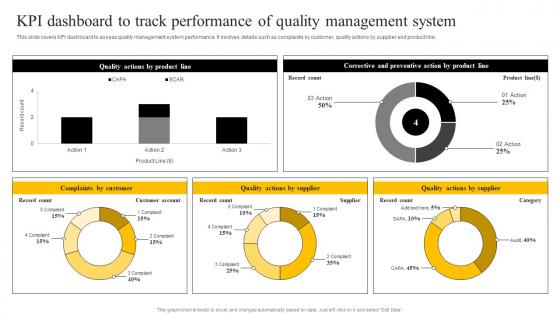 KPI Dashboard To Track Performance Of Quality Management System Enabling Smart Production DT SS
This slide covers KPI dashboard to assess quality management system performance. It involves details such as complaints by customer, quality actions by supplier and product line. Present the topic in a bit more detail with this KPI Dashboard To Track Performance Of Quality Management System Enabling Smart Production DT SS Use it as a tool for discussion and navigation on Quality Actions, Complaints By Customer, Product Line This template is free to edit as deemed fit for your organization. Therefore download it now.
-
 IoT Platforms For Smart Device IoT Platform Performance Monitoring Dashboard
This slide showcases the performance tracking dashboard for IoT platforms. The purpose of this slide is to highlight the performance of IoT platforms by including components such as downtime by duration, true efficiency, etc. Deliver an outstanding presentation on the topic using this IoT Platforms For Smart Device IoT Platform Performance Monitoring Dashboard. Dispense information and present a thorough explanation of IoT Platform Performance, Monitoring Dashboard, Downtime By Duration, True Efficiency using the slides given. This template can be altered and personalized to fit your needs. It is also available for immediate download. So grab it now.
-
 Performance Testing Strategies To Boost Performance Testing Progress Tracking Dashboard
This slide depicts the dashboard to test the performance of the software. The purpose of this slide is to cover the details of test case status, requirement base suite, defects status, bugs linked to requirements, test case linked requirements, etc. Deliver an outstanding presentation on the topic using this Performance Testing Strategies To Boost Performance Testing Progress Tracking Dashboard. Dispense information and present a thorough explanation of Performance Testing Progress, Tracking Dashboard, Test Case Linked Requirements, Requirement Base Suite using the slides given. This template can be altered and personalized to fit your needs. It is also available for immediate download. So grab it now.
-
 Fulfillment Center Optimization Warehouse Fleet And Transportation Performance Analytics Dashboard
This slide represents a warehouse fleet and transportation management dashboard to visualize and optimize logistics operations through advanced data analyses. It monitors KPIs such as fleet status, delivery status, deliveries by location, average delivery time hours0 And route Km, loading time And weight, and profit by location. Deliver an outstanding presentation on the topic using this Fulfillment Center Optimization Warehouse Fleet And Transportation Performance Analytics Dashboard Dispense information and present a thorough explanation of Course Topics, Course Duration, Course Description using the slides given. This template can be altered and personalized to fit your needs. It is also available for immediate download. So grab it now.
-
 Digital Marketing Campaign Performance Analytics Dashboard
This slide depicts analysis of marketing campaign performance analytics for measuring customer involvement with campaign. It includes parameters such as visitors, leads, total revenue, bounce rate, customer churn rate, order value, customer life time value etc. Presenting our well structured Digital Marketing Campaign Performance Analytics Dashboard. The topics discussed in this slide are Annual Recurring Revenue, Customer Lifetime Value, Completed Transactions. This is an instantly available PowerPoint presentation that can be edited conveniently. Download it right away and captivate your audience.
-
 Ad Tech Dashboard Software To Measure Marketing Strategy Performance
This slide highlights the Ad Tech dashboard software to measure the performance of business advertising strategies. The purpose of template slide is to measure the effectiveness of business advertising strategies in order to identify improvements. It includes elements such as total impressions generated, relevance score, etc. Introducing our Ad Tech Dashboard Software To Measure Marketing Strategy Performance set of slides. The topics discussed in these slides are Dashboard, Measure, Marketing. This is an immediately available PowerPoint presentation that can be conveniently customized. Download it and convince your audience.
-
 Chef Automation Dashboard To Track System Performance
This slide represents chef automation tool dashboard to display the key metrics and also helps to keep track of chef runs and performances. It includes key metrics such as average execution time, elapsed time, chef resources total, etc. Introducing our Chef Automation Dashboard To Track System Performance set of slides. The topics discussed in these slides are Infrastructure Changes, Resources Updated, Execution Time. This is an immediately available PowerPoint presentation that can be conveniently customized. Download it and convince your audience.
-
 Dashboard For Tracking Facebook Post Performance Facebook Advertising Strategy SS V
The following slide outlines dashboard through which advertisers can manage Facebook post performance and optimize their marketing strategy. Information covered in this slide is related to key metrics such as impressions per post, engagement rate, click-through rate CTR, likes, etc. Present the topic in a bit more detail with this Dashboard For Tracking Facebook Post Performance Facebook Advertising Strategy SS V Use it as a tool for discussion and navigation on Dashboard, Tracking Facebook, Post Performance This template is free to edit as deemed fit for your organization. Therefore download it now.
-
 Facebook Ads Dashboard With Campaign Performance Facebook Advertising Strategy SS V
The following slide outlines comprehensive dashboard through which advertisers can monitor Facebook ads performance. The KPIs outlined in slide are ad spend, conversions, cost per conversion, cost per action, brand impressions, clicks, etc. Deliver an outstanding presentation on the topic using this Facebook Ads Dashboard With Campaign Performance Facebook Advertising Strategy SS V Dispense information and present a thorough explanation of Generating, Facebook, Campaign Performance using the slides given. This template can be altered and personalized to fit your needs. It is also available for immediate download. So grab it now.
-
 Analyzing Performance Of Closed Sales Deal Dashboard Top Sales Closing Techniques SA SS
Following slide highlights dashboard to monitor closed sales deal of company that helps to make decisions on improving performance. It includes pipeline metrics such as won deals, lost deals, days to close, conversion rates, etc. Present the topic in a bit more detail with this Analyzing Performance Of Closed Sales Deal Dashboard Top Sales Closing Techniques SA SS. Use it as a tool for discussion and navigation on Deal Value, Deal Lost Reason. This template is free to edit as deemed fit for your organization. Therefore download it now.
-
 Firewall As A Service Performance Tracking Dashboard Firewall Virtualization
This slide represents the dashboard to track the performance of Firewall-as-a-Service deployed by different organizations. The purpose of this slide is to showcase the overall performance of FWaaS by demonstrating statistics of monthly threat status, etc. Present the topic in a bit more detail with this Firewall As A Service Performance Tracking Dashboard Firewall Virtualization. Use it as a tool for discussion and navigation on Current Risk Status, Threat Status, Threat Report. This template is free to edit as deemed fit for your organization. Therefore download it now.
-
 KPI Dashboard To Track Customer Support Performance Enabling Smart Shopping DT SS V
This slide covers KPI dashboard to track customer service performance and enhance customer satisfaction rate. It involves total solved tickets, weekly chat status and number of visitors. Present the topic in a bit more detail with this KPI Dashboard To Track Customer Support Performance Enabling Smart Shopping DT SS V Use it as a tool for discussion and navigation on Self Serve Performance, Customer Support Performance This template is free to edit as deemed fit for your organization. Therefore download it now.
-
 Implementing Workforce Analytics Dashboard To Monitor Employee Performance Post Data Analytics SS
This slide represents dashboard for tracking employee productivity post workload management which helps in assessing workforce activity schedule to optimize performance. It provides information regarding KPI metrics such as working times, projects, tracked time, productivity growth, overall employee effectiveness. Present the topic in a bit more detail with this Implementing Workforce Analytics Dashboard To Monitor Employee Performance Post Data Analytics SS. Use it as a tool for discussion and navigation on Dashboard To Monitor, Employee Performance, Post Workload Management, Tracked Time, Productivity Growth. This template is free to edit as deemed fit for your organization. Therefore download it now.
-
 Key Indicator Dashboard To Measure Okr Report Performance
This slide represents okr report performance measuring key indicator dashboard. This further includes revenue, new restaurant, new hires, avg revenue per restaurant, avg set up time etc. Presenting our well structured Key Indicator Dashboard To Measure Okr Report Performance. The topics discussed in this slide are Dashboard, Measure, Performance. This is an instantly available PowerPoint presentation that can be edited conveniently. Download it right away and captivate your audience.
-
 Dashboard To Monitor Performance KPIs Of IoT Devices Boosting Manufacturing Efficiency With IoT
The following slide showcases dashboard to monitor performance of IoT devices and sensors. It includes various KPIs such as voltage, frequency, power, etc. Deliver an outstanding presentation on the topic using this Dashboard To Monitor Performance KPIs Of IoT Devices Boosting Manufacturing Efficiency With IoT. Dispense information and present a thorough explanation of Dashboard Monitor, Performance KPIs, IoT Devices using the slides given. This template can be altered and personalized to fit your needs. It is also available for immediate download. So grab it now.
-
 Regression Testing Performance Monitoring Dashboard
This slide highlight the performance of regression testing by including components such as execution test outcomes overall, in progress and so on. Presenting our well structured Regression Testing Performance Monitoring Dashboard. The topics discussed in this slide are Regression Testing Performance, Monitoring Dashboard, Execution Test Outcomes. This is an instantly available PowerPoint presentation that can be edited conveniently. Download it right away and captivate your audience.
-
 Web Security Performance Monitoring Dashboard
This slide showcases the performance tracking dashboard for web security based on various parameters such as attack types, event status, etc. Presenting our well structured Web Security Performance Monitoring Dashboard. The topics discussed in this slide are Web Security, Performance Monitoring, Dashboard, Event Status. This is an instantly available PowerPoint presentation that can be edited conveniently. Download it right away and captivate your audience.


