Powerpoint Templates and Google slides for Percentages
Save Your Time and attract your audience with our fully editable PPT Templates and Slides.
-
 Animal science hen and egg layers percentage
Presenting animal science hen and egg layers percentage. This is a animal science hen and egg layers percentage. This is a five stage process. The stages in this process are biology of animals, animal science, farm animals management.
-
 Upward process with circles and percentage icon
Presenting upward process with circles and percentage icon. This is a upward process with circles and percentage icon. This is a three stage process. The stages in this process are increasing efficiency, increasing effectiveness, improving efficiency.
-
 Horizontal bar graph with percentages
Presenting Horizontal Bar Graph With Percentages PowerPoint slide. This PowerPoint slide is completely editable so you can modify, font type, font color, shape and image according to your requirements. This Google Slides compatible PPT is available in 4:3 and 16:9 aspect ratios. Easy to download PPT layout and can be saved in different formats like JPG, PDF, and PNG.
-
 Capacity planning load percentage availability table
Presenting capacity planning load percentage availability table. This is a capacity planning load percentage availability table. This is a five stage process. The stages in this process are capacity planning, capacity management, production planning.
-
 Product comparison with brand comparison and percentage
Presenting this set of slides with name - Product Comparison With Brand Comparison And Percentage. This is a three stage process. The stages in this process are Business Swot Analysis, Product Comparison And Competitive Landscape, Competitive Analysis, Swot Analysis Competitor Comparison.
-
 Demographics showing percentage of men and women
Presenting this set of slides with name - Demographics Showing Percentage Of Men And Women. This is a two stage process. The stages in this process are Population, Demographics, People Growth.
-
 Yearly clinical development manufacturing spend percentage table
Presenting this set of slides with name - Yearly Clinical Development Manufacturing Spend Percentage Table. This is a three stage process. The stages in this process are Clinical Development, Clinical Trial, Medical.
-
 Revenue leakage percentage with tap and water drop icons
Presenting this set of slides with name - Revenue Leakage Percentage With Tap And Water Drop Icons. This is a three stage process. The stages in this process are Revenue Leakage, Capital Leakage, Income Leakage.
-
 Network users conversion a b test with arrows and percentages
Presenting this set of slides with name - Network Users Conversion A B Test With Arrows And Percentages. This is a two stage process. The stages in this process are A B Test, Bucket Tests, Split Run Testing.
-
 High percentage market share social responsibilities products service quality
Presenting our High Percentage Market Share Social Responsibilities Products Service Quality PowerPoint template. The PPT is easy to download and can be edited according to your company’s strategy. Use data-driven charts and graphs to present focused steps. The presentation can be downloaded in both widescreen and standard screen aspect ratios. Smooth performance is rendered by the presentation slideshow on all the software. The slideshow is compatible with both google slides and PowerPoint.
-
 Four phases of task completion percentage dashboards
Presenting this set of slides with name - Four Phases Of Task Completion Percentage Dashboards. This is a four stage process. The stages in this process are Task Completion, Assignment Completion, Work Completion.
-
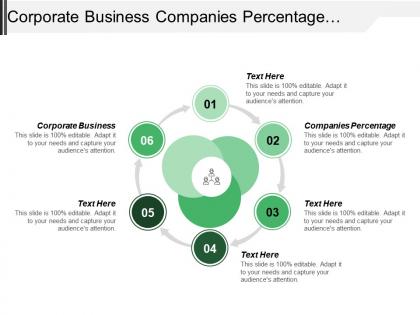 Corporate business companies percentage responsible increased profits large companies
Presenting this set of slides with name - Corporate Business Companies Percentage Responsible Increased Profits Large Companies. This is an editable six stages graphic that deals with topics like Corporate Business, Companies Percentage, Responsible Increased Profits, Large Companies to help convey your message better graphically. This product is a premium product available for immediate download, and is 100 percent editable in Powerpoint. Download this now and use it in your presentations to impress your audience.
-
 Percentage market share dollar per account average sales
Presenting this set of slides with name - Percentage Market Share Dollar Per Account Average Sales. This is an editable four stages graphic that deals with topics like Percentage Market Share, Dollar Per Account, Average Sales to help convey your message better graphically. This product is a premium product available for immediate download, and is 100 percent editable in Powerpoint. Download this now and use it in your presentations to impress your audience.
-
 Solution operation percentage operating cost defect ratio average sale
Presenting this set of slides with name - Solution Operation Percentage Operating Cost Defect Ratio Average Sale. This is an editable three stages graphic that deals with topics like Solution Operation, Percentage Operating Cost, Defect Ratio, Average Sale to help convey your message better graphically. This product is a premium product available for immediate download, and is 100 percent editable in Powerpoint. Download this now and use it in your presentations to impress your audience.
-
 Digital key finding with percentage and icons
Presenting this set of slides with name - Digital Key Finding With Percentage And Icons. This is a three stage process. The stages in this process are Key Findings, Key Achievements, Key Accomplishment.
-
 Project key finding with percentage
Presenting this set of slides with name - Project Key Finding With Percentage. This is a five stage process. The stages in this process are Key Findings, Key Achievements, Key Accomplishment.
-
 Yearly key finding with percentage graphic
Presenting this set of slides with name - Yearly Key Finding With Percentage Graphic. This is a five stage process. The stages in this process are Key Findings, Key Achievements, Key Accomplishment.
-
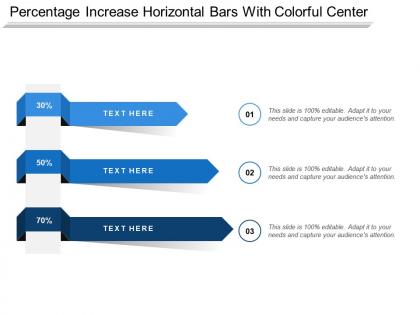 Percentage increase horizontal bars with colorful center
Presenting this set of slides with name - Percentage Increase Horizontal Bars With Colorful Center. This is a three stage process. The stages in this process are Percentage Increase, Net Operating Income, Growth.
-
 Percentage increase icon ppt slide
Presenting this set of slides with name - Percentage Increase Icon Ppt Slide. This is a two stage process. The stages in this process are Percentage Increase, Net Operating Income, Growth.
-
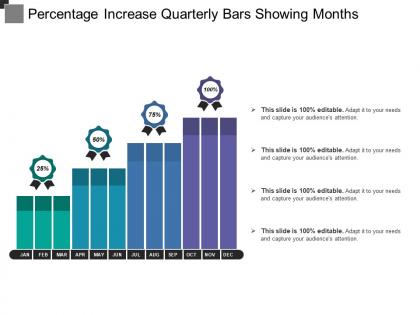 Percentage increase quarterly bars showing months
Presenting this set of slides with name - Percentage Increase Quarterly Bars Showing Months. This is a four stage process. The stages in this process are Percentage Increase, Net Operating Income, Growth.
-
 Percentage increase showing fan shaped semi circular design
Presenting this set of slides with name - Percentage Increase Showing Fan Shaped Semi Circular Design. This is a five stage process. The stages in this process are Percentage Increase, Net Operating Income, Growth.
-
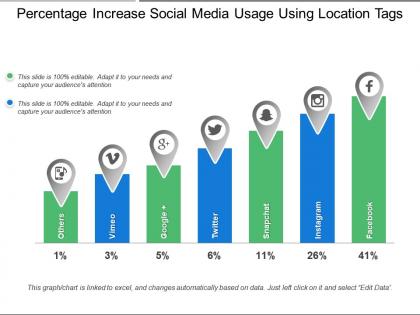 Percentage increase social media usage using location tags
Presenting this set of slides with name - Percentage Increase Social Media Usage Using Location Tags. This is a seven stage process. The stages in this process are Percentage Increase, Net Operating Income, Growth.
-
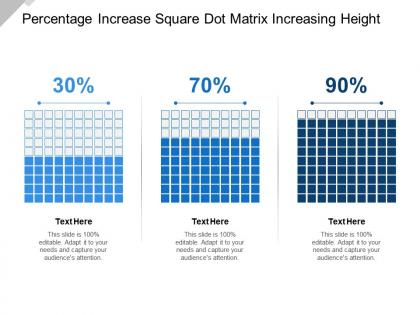 Percentage increase square dot matrix increasing height
Presenting this set of slides with name - Percentage Increase Square Dot Matrix Increasing Height. This is a three stage process. The stages in this process are Percentage Increase, Net Operating Income, Growth.
-
 Percentage increase using five stair pie chart
Presenting this set of slides with name - Percentage Increase Using Five Stair Pie Chart. This is a five stage process. The stages in this process are Percentage Increase, Net Operating Income, Growth.
-
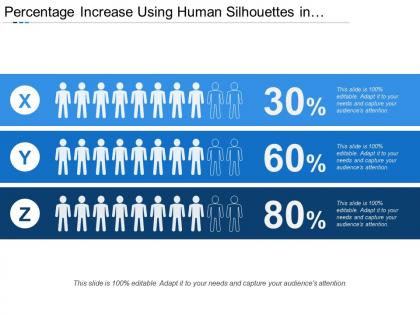 Percentage increase using human silhouettes in increasing numbers
Presenting this set of slides with name - Percentage Increase Using Human Silhouettes In Increasing Numbers. This is a three stage process. The stages in this process are Percentage Increase, Net Operating Income, Growth.
-
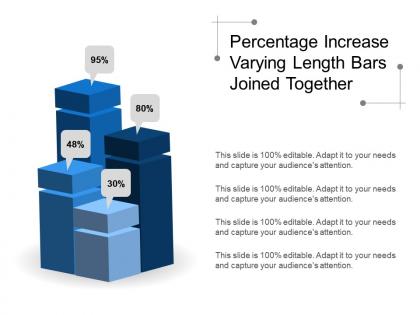 Percentage increase varying length bars joined together
Presenting this set of slides with name - Percentage Increase Varying Length Bars Joined Together. This is a four stage process. The stages in this process are Percentage Increase, Net Operating Income, Growth.
-
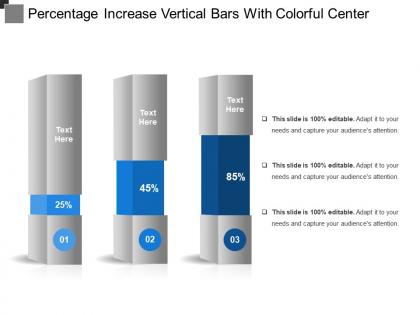 Percentage increase vertical bars with colorful center
Presenting this set of slides with name - Percentage Increase Vertical Bars With Colorful Center. This is a three stage process. The stages in this process are Percentage Increase, Net Operating Income, Growth.
-
 Analysis summary tree covering different percentages
Presenting this set of slides with name - Analysis Summary Tree Covering Different Percentages. This is a eight stage process. The stages in this process are Analysis Summary, Review Summary, Executive Summary.
-
 Strategy diamond with different percentage showing
Presenting this set of slides with name - Strategy Diamond With Different Percentage Showing. This is a three stage process. The stages in this process are Diamond Model, Strategy Diamond, Strategic Management.
-
 Cost control with actual cost percentage deducted cost and final cost
Presenting this set of slides with name - Cost Control With Actual Cost Percentage Deducted Cost And Final Cost. This is a five stage process. The stages in this process are Cost Control, Price Control, Money Control.
-
 Cost control with items percentage deducted from actual cost
Presenting this set of slides with name - Cost Control With Items Percentage Deducted From Actual Cost. This is a five stage process. The stages in this process are Cost Control, Price Control, Money Control.
-
 Cost control with resources expenses units actual cost and percentage deducted
Presenting this set of slides with name - Cost Control With Resources Expenses Units Actual Cost And Percentage Deducted. This is a four stage process. The stages in this process are Cost Control, Price Control, Money Control.
-
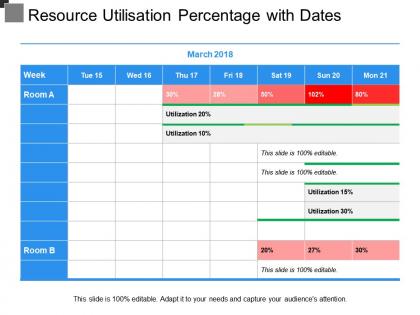 Resource utilisation percentage with dates
Presenting this set of slides with name - Resource Utilisation Percentage With Dates. This is a seven stage process. The stages in this process are Resource Management, Resource Utilization, Resource Allocation.
-
 Eco friendly showing stamp of 100 percentage eco friendly
Presenting this set of slides with name - Eco Friendly Showing Stamp Of 100 Percentage Eco Friendly. This is a four stage process. The stages in this process are Green Factory, Eco Friendly Factory, Green Manufacturing.
-
 Sales contest shown by humans running and percentage medal
Presenting this set of slides with name - Sales Contest Shown By Humans Running And Percentage Medal. This is a six stage process. The stages in this process are Sales Contest, Sales Competition, Sales Opposition.
-
 Numeric distribution showing sales percentage of different items
Presenting this set of slides with name - Numeric Distribution Showing Sales Percentage Of Different Items. This is a five stage process. The stages in this process are Product Distribution, Distribution System, Numeric Distribution.
-
 Adaptors majority laggards diffusion of innovation with percentages
Presenting this set of slides with name - Adaptors Majority Laggards Diffusion Of Innovation With Percentages. This is a five stage process. The stages in this process are Diffusion Of Innovations, Innovation Management, Ideas.
-
 Comparison of thr two profile with four statistics and percentage
Presenting this set of slides with name - Comparison Of Thr Two Profile With Four Statistics And Percentage. This is a two stage process. The stages in this process are Comparison Of Two, Compare, comeptitive analysis.
-
 Project progress showing project name project status complete percentage
Presenting this set of slides with name - Project Progress Showing Project Name Project Status Complete Percentage. This is a eight stage process. The stages in this process are Project Progress, Project Growth, Project Management.
-
 Kpi icons showing upward arrow percentage and comments
Presenting this set of slides with name - Kpi Icons Showing Upward Arrow Percentage And Comments. This is a four stage process. The stages in this process are Kpi Icon, Metircs Icon, Dashboard Icon.
-
 Gross profit margin percentage market share receivables turnover
Presenting this set of slides with name - Gross Profit Margin Percentage Market Share Receivables Turnover. This is an editable seven graphic that deals with topics like gross profit margin, percentage market share, receivables turnover to help convey your message better graphically. This product is a premium product available for immediate download, and is 100 percent editable in Powerpoint. Download this now and use it in your presentations to impress your audience.
-
 Math symbols with equal and percentage icon
Presenting this set of slides with name - Math Symbols With Equal And Percentage Icon. This is a eight stage process. The stages in this process are Math Symbols, Math Signs, Mathematic Symbols.
-
 Balanced diet food percentage pyramid with values
Presenting balanced diet food percentage pyramid with values. This is a balanced diet food percentage pyramid with values. This is a three stage process. The stages in this process are balanced diet food, healthy food, eatwell.
-
 Increase decrease percentage up and down icons
Presenting increase decrease percentage up and down icons. This is a increase decrease percentage up and down icons. This is a two stage process. The stages in this process are increase decrease, up down, upward downward.
-
 Increase decrease percentage up and down shadow icons
Presenting increase decrease percentage up and down shadow icons. This is a increase decrease percentage up and down shadow icons. This is a two stage process. The stages in this process are increase decrease, up down, upward downward.
-
 Gender differentiation percentage
Presenting Gender Differentiation Percentage. This PowerPoint template supports both the widescreen (16:9) and the standard screen aspect ratios(4:3). Add appealing content like charts and graphs to the presentation. The slide is also compatible with Google Slides. This slide can be converted into common image formats like JPEG, PNG or document formats such as PDF. High-quality graphics will prevent the deterioration of slide components.
-
 Headcount analysis percentage
Presenting Headcount Analysis Percentage slideshow. This PowerPoint template supports both the widescreen (16:9) and the standard screen aspect ratios(4:3). The slide is compatible with Google Slides. Add appealing content like charts and graphs to the presentation. This slide can be converted into common image formats like JPEG, PNG or document formats such as PDF. High-quality graphics will prevent the deterioration of slide components.
-
 Male female percentage comparison chart
Presenting Male Female Percentage Comparison Chart presentation. The slide is fully customizable in PowerPoint and other office suites. Customize the slide as per your requirements. Transform this template into various documents or image formats like PDF or JPEG. Alter the font style, font color, and other components with ease. The slide is also compatible with Google Slides. High-quality graphics ensure that quality is always maintained.
-
 Box plot iqr lower middle and upper percentage
Presenting Box Plot Iqr Lower Middle And Upper Percentage template. This template supports both the widescreen (16:9) and the standard screen aspect ratios(4:3). Add appealing content like charts and graphs to the presentation. The slide is also compatible with Google Slides. This slide can be converted into common image formats like JPEG, PNG or document formats such as PDF. High-quality graphics will prevent the deterioration of slide components.
-
 Status symbol six circles showcasing loading percentage
Presenting status symbol six circles showcasing loading percentage. This is a status symbol six circles showcasing loading percentage. This is a six stage process. The stages in this process are status symbol, status icon.
-
 Sales and operations benefits percentage circle efficiency margin
Presenting sales and operations benefits percentage circle efficiency margin. This is a sales and operations benefits percentage circle efficiency margin. This is a five stage process. The stages in this process are sales and operations, sales support, business operations.
-
 Cloud storage showing documents apps music percentage
Presenting this set of slides with name - Cloud Storage Showing Documents Apps Music Percentage. This is a four stage process. The stages in this process are Cloud Storage, Data Storage, Cloud Computing.
-
 3 stages funnel showing pipeline stage status percentage
Presenting this set of slides with name - 3 Stages Funnel Showing Pipeline Stage Status Percentage. This is a three stage process. The stages in this process are 7 Stage Funnel, 7 Step Funnel, 7 Part Funnel.
-
 4 stages funnel showing pipeline stage status percentage
Presenting this set of slides with name - 4 Stages Funnel Showing Pipeline Stage Status Percentage. This is a four stage process. The stages in this process are 7 Stage Funnel, 7 Step Funnel, 7 Part Funnel.
-
 5 stages funnel showing pipeline stage status percentage
Presenting this set of slides with name - 5 Stages Funnel Showing Pipeline Stage Status Percentage. This is a five stage process. The stages in this process are 7 Stage Funnel, 7 Step Funnel, 7 Part Funnel.
-
 6 stages funnel showing pipeline stage status percentage
Presenting this set of slides with name - 6 Stages Funnel Showing Pipeline Stage Status Percentage. This is a six stage process. The stages in this process are 7 Stage Funnel, 7 Step Funnel, 7 Part Funnel.
-
 7 stages funnel showing pipeline stage status percentage
Presenting this set of slides with name - 7 Stages Funnel Showing Pipeline Stage Status Percentage. This is a seven stage process. The stages in this process are 7 Stage Funnel, 7 Step Funnel, 7 Part Funnel.
-
 Arrows in circle with percentage level and four levels
Presenting this set of slides with name - Arrows In Circle With Percentage Level And Four Levels. This is a four stage process. The stages in this process are Arrows In Circle, Circular Arrow, Arrow In Round.
-
 Sales analysis stats showing six magnifying glasses and percentages
Presenting this set of slides with name - Sales Analysis Stats Showing Six Magnifying Glasses And Percentages. This is a six stage process. The stages in this process are Stats, Statistics, Data.
-
 Stats four colored boxes showing survey percentages
Presenting this set of slides with name - Stats Four Colored Boxes Showing Survey Percentages. This is a four stage process. The stages in this process are Stats, Statistics, Data.


