Powerpoint Templates and Google slides for Page Numbers
Save Your Time and attract your audience with our fully editable PPT Templates and Slides.
-
 Page views kpi for number of photos posted number of views presentation slide
Presenting page views kpi for number of photos posted number of views presentation slide. This presentation slide shows two Key Performance Indicators or KPIs in a Dashboard style design. The first KPI that can be shown is Number of Photos Posted to Your Page. The second KPI is Number of Views of Page. These KPI Powerpoint graphics are all data driven, and the shape automatically adjusts according to your data. Just right click on the KPI graphic, enter the right value and the shape will adjust automatically. Make a visual impact with our KPI slides.
-
 Number of back links website success rate page reviews kpi presentation slide
Presenting number of back links website success rate page reviews kpi presentation slide. This presentation slide shows three Key Performance Indicators or KPIs in a Dashboard style design. The first KPI that can be shown is Total Number of Incoming Back Links. The second KPI is Website Success Rate and the third is Number of Page Views. These KPI Powerpoint graphics are all data driven, and the shape automatically adjusts according to your data. Just right click on the KPI graphic, enter the right value and the shape will adjust automatically. Make a visual impact with our KPI slides.
-
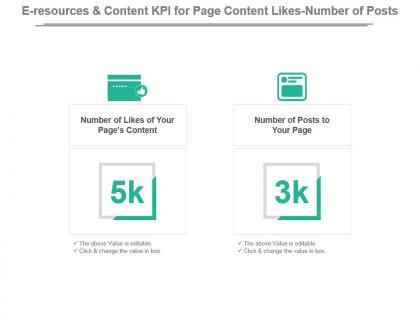
 E resources and content kpi for page content likes number of posts powerpoint slide
Presenting e resources and content kpi for page content likes number of posts powerpoint slide. This presentation slide shows two Key Performance Indicators or KPIs in a Dashboard style design. The first KPI that can be shown is Number of Likes of Your Pages Content. The second KPI is Number of Posts to Your Page. These KPI Powerpoint graphics are all data driven, and the shape automatically adjusts according to your data. Just right click on the KPI graphic, enter the right value and the shape will adjust automatically. Make a visual impact with our KPI slides.
-
 Kpi for number of unlikes people comments on page presentation slide
Presenting kpi for number of unlikes people comments on page presentation slide. This presentation slide shows three Key Performance Indicators or KPIs in a Dashboard style design. The first KPI that can be shown is Number of Unlikes of Your Page. The second KPI is Number of People Who Are Friends of The Fans of Your Page and the third is Number of Comments Created on Your Pages Content. These KPI Powerpoint graphics are all data driven, and the shape automatically adjusts according to your data. Just right click on the KPI graphic, enter the right value and the shape will adjust automatically. Make a visual impact with our KPI slides.
-
 Average Number Of Daily Facebook Page Posts Colored Icon In Powerpoint Pptx Png And Editable Eps Format
Give your next presentation a sophisticated, yet modern look with this 100 percent editable Average number of daily facebook page posts colored icon in powerpoint pptx png and editable eps format. Choose from a variety of customizable formats such as PPTx, png, eps. You can use these icons for your presentations, banners, templates, One-pagers that suit your business needs.
-
 Average Number Of Daily Facebook Page Posts Monotone Icon In Powerpoint Pptx Png And Editable Eps Format
Make your presentation profoundly eye-catching leveraging our easily customizable Average number of daily facebook page posts monotone icon in powerpoint pptx png and editable eps format. It is designed to draw the attention of your audience. Available in all editable formats, including PPTx, png, and eps, you can tweak it to deliver your message with ease.
-
 Content page with page number and points
Presenting this Content Page With Page Number And Points template. It supports both the standard and widescreen viewing angles. Transform this into common images or document formats like JPEG and PDF. It is also compatible with Google Slides and MS PowerPoint. Alter the style, size, background and other attributes of the PPT. High-quality graphics will ensure that picture quality always remains the same.
-
 One page college faculty population numbers presentation report infographic ppt pdf document
Rules and regulations tend to differ drastically between individuals and enterprises. Getting hold of a template that perfectly fits the bill is next to impossible. Not anymore though. Our exclusive One Page College Faculty Population Numbers Presentation Report Infographic PPT PDF Document template design is suitable for every person and organization, irrespective of their beliefs and preferences. The exceptional touch and thought process that has gone behind designing this wonder template depicts in the form of its all-round use. We promise you that your satisfaction levels will be next level, all thanks to our mesmerizing template.
-
 One page determining total number of social program run by organization in 2020 infographic ppt pdf document
You have terrific content on board, but your one pager template is visually displeasing, then its a lost battle for you. Join hands with our mesmerizing One Page Determining Total Number Of Social Program Run By Organization In 2020 Infographic PPT PDF Document template piece to treat the eyes of your audience. We guarantee you that with our creatively designed template your audience would keep asking for more. Our design showcases a rare alloy of minimalism, creativity and reach. A one pager template that can make you stand out in the crowd by making it a cakewalk for you to cut through your rivals. Get hooked to our out of the box template now.
-
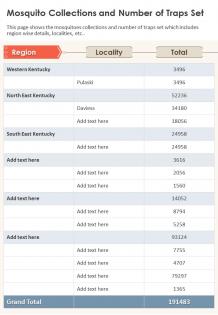
 One page mosquito collections and number of traps set presentation report infographic ppt pdf document
Communicating with your stakeholders on a one to one basis can become extremely challenging. Whats best is to put together a One Page Mosquito Collections And Number Of Traps Set Presentation Report Infographic PPT PDF Document one pager presentation and address a group in one go. This can become a success if you settle for our customized template design. By investing in our one of its kind template design you can ensure better planning, transparency, spot on feedback, improved productivity and bottom lines in the days to come. Additionally, our template bestows upon you the right to modify data and graphics to suit your individual interests and understanding. Time to get out the template right away. An investment you are going to be proud of.
-
 One page financial year 2019 by the numbers template 423 report infographic ppt pdf document
Your one pager is certain to hit bulls eye, with our minimalistic yet sophisticated One Page Financial Year 2019 By The Numbers Template 423 Report Infographic PPT PDF Document one pager design. Our innovative solution will help you to enjoy the liberty of exercising absolute customisation. We would keep you away from extensive data cluttering by ensuring that on point highlights reach your prospects just in time. Our bright and hard hitting template design will come across as a complete visual delight. We understand that a one pager should be able to create a lasting impression. Our research and performance oriented template ensures just that. Focus on core activities by leaving the burden of template designing on the shoulder of experts like us.
-
 Calendar page with numbers showing month and date
Presenting this set of slides with name Calendar Page With Numbers Showing Month And Date. The topics discussed in these slide is Calendar Page With Numbers Showing Month And Date. This is a completely editable PowerPoint presentation and is available for immediate download. Download now and impress your audience.


