Powerpoint Templates and Google slides for Orders
Save Your Time and attract your audience with our fully editable PPT Templates and Slides.
-
 Dashboard For Tracking Sales Order Fulfilment Rate
The following slide showcases sales order fulfilment rate dashboard to measure efficiency of shipping, process and packaging. It includes components such as partially fulfilled orders, pending orders, total number of orders etc. Presenting our well structured Dashboard For Tracking Sales Order Fulfilment Rate. The topics discussed in this slide are Tracking, Sales, Fulfilment. This is an instantly available PowerPoint presentation that can be edited conveniently. Download it right away and captivate your audience.
-
 E Commerce Sales Order Fulfilment Services Market Report
The following slide highlights market report for e commerce services for sales order fulfilment. It includes components such as warehousing, storage fulfilment services, bundling fulfilment services, key insights, key companies etc. Introducing our E Commerce Sales Order Fulfilment Services Market Report set of slides. The topics discussed in these slides are Order, Sales, Services. This is an immediately available PowerPoint presentation that can be conveniently customized. Download it and convince your audience.
-
 Sales Order Fulfilment Dashboard To Track Performance
The following slide highlights sales order fulfilment dashboard for real time customer analytics, performance and inventory management and sales forecasting etc. It includes components such as number of orders work in progress, value of sales orders, no. of orders shipped, sales order status, customer sales orders etc. Presenting our well structured Sales Order Fulfilment Dashboard To Track Performance. The topics discussed in this slide are Sales, Track, Performance. This is an instantly available PowerPoint presentation that can be edited conveniently. Download it right away and captivate your audience.
-
 Order Receiving Channels In Cloud Kitchen Industry Ghost Kitchen Global Industry
This slide presents various platforms used globally for connecting and ordering food in cloud kitchen industry. It highlights channels such as website, phone call, take away and mobile application. Present the topic in a bit more detail with this Order Receiving Channels In Cloud Kitchen Industry Ghost Kitchen Global Industry Use it as a tool for discussion and navigation on Instant Updates, Personalized Experience This template is free to edit as deemed fit for your organization. Therefore download it now.
-
 Custom Graph Strategies To Increase Footfall And Online Orders Of Restaurant
Present the topic in a bit more detail with this Custom Graph Strategies To Increase Footfall And Online Orders Of Restaurant Use it as a tool for discussion and navigation on Custom Graph This template is free to edit as deemed fit for your organization. Therefore download it now.
-
 Financial Strategies To Increase Footfall And Online Orders Of Restaurant
Present the topic in a bit more detail with this Financial Strategies To Increase Footfall And Online Orders Of Restaurant Use it as a tool for discussion and navigation on Financials This template is free to edit as deemed fit for your organization. Therefore download it now.
-
 ABC Analysis For Stock Inventory Management Strategies For Forecasting And Ordering Inventory
This slide showcases ABC analysis method that can help organization in inventory management. It can help organization in optimum utilization of resources and reduce wastage of inventory. Deliver an outstanding presentation on the topic using this ABC Analysis For Stock Inventory Management Strategies For Forecasting And Ordering Inventory Dispense information and present a thorough explanation of Level Management, Safety Stock Moderate, Moderate Control using the slides given. This template can be altered and personalized to fit your needs. It is also available for immediate download. So grab it now.
-
 Dashboard For Managing Warehouse Operations Strategies For Forecasting And Ordering Inventory
This slide showcases dashboard that can help organization to manage and track the warehouse operations. Its key elements are order, volume, inventory, monthly KPIs and global financial performance. Present the topic in a bit more detail with this Dashboard For Managing Warehouse Operations Strategies For Forecasting And Ordering Inventory Use it as a tool for discussion and navigation on Global Financial Performance, Volume Today, Inventory This template is free to edit as deemed fit for your organization. Therefore download it now.
-
 Dashboard To Track Inventory Management Kpis Strategies For Forecasting And Ordering Inventory
This slide showcases KPIs that can help organization to evaluate the efficiency of inventory management process. Its key KPIs areout of stock rate, on time full deliveries, inventory turnover and average time to sell. Deliver an outstanding presentation on the topic using this Dashboard To Track Inventory Management Kpis Strategies For Forecasting And Ordering Inventory Dispense information and present a thorough explanation of Overview 2023, Products Sold Within Freshness Date using the slides given. This template can be altered and personalized to fit your needs. It is also available for immediate download. So grab it now.
-
 Forecast Demand Using Historical Sales Data Strategies For Forecasting And Ordering Inventory
This slide showcases graph that can help organization to forecast the inventory requirement on the basis of sales data of previous financial years. It showcases data of last 3 years. Deliver an outstanding presentation on the topic using this Forecast Demand Using Historical Sales Data Strategies For Forecasting And Ordering Inventory Dispense information and present a thorough explanation of Regular Basis, High Demand using the slides given. This template can be altered and personalized to fit your needs. It is also available for immediate download. So grab it now.
-
 Forecasting Demand Of Different Types Strategies For Forecasting And Ordering Inventory
This slide showcases graphs that can help organization in forecasting different type of products on the basis of previous data. It showcases quarterly data of three product types. Present the topic in a bit more detail with this Forecasting Demand Of Different Types Strategies For Forecasting And Ordering Inventory Use it as a tool for discussion and navigation on High Priced Items, Medium Priced Items This template is free to edit as deemed fit for your organization. Therefore download it now.
-
 HML Analysis For Inventory Management Strategies For Forecasting And Ordering Inventory
This slide showcases HML analysis method that can help organization in inventory management. It categorized inventory into high, medium and low priced items which can help to determine the verification frequency of different type of stock categories. Deliver an outstanding presentation on the topic using this HML Analysis For Inventory Management Strategies For Forecasting And Ordering Inventory Dispense information and present a thorough explanation of HML Analysis, Inventory Managementusing the slides given. This template can be altered and personalized to fit your needs. It is also available for immediate download. So grab it now.
-
 Inventory Forecasting For Seasonal Products Strategies For Forecasting And Ordering Inventory
This slide showcases graph that can help organization to determine demand for seasonal products on the basis past sales data. It showcases data for past 2 financial years. Present the topic in a bit more detail with this Inventory Forecasting For Seasonal Products Strategies For Forecasting And Ordering Inventory Use it as a tool for discussion and navigation on Limited Visibility To Inventory, Past Sales This template is free to edit as deemed fit for your organization. Therefore download it now.
-
 Issues With Current Inventory Management Strategies For Forecasting And Ordering Inventory
This slide showcases issues faced by organization due to inefficient inventory management process. It shows increase in inventory shrinkage percentage and cost of carrying inventory. Deliver an outstanding presentation on the topic using this Issues With Current Inventory Management Strategies For Forecasting And Ordering Inventory Dispense information and present a thorough explanation of Perfect Order Rate, Inventory Carrying Cost using the slides given. This template can be altered and personalized to fit your needs. It is also available for immediate download. So grab it now.
-
 Pie Chart Strategies For Forecasting And Ordering Inventory
Deliver an outstanding presentation on the topic using this Pie Chart Strategies For Forecasting And Ordering Inventory Dispense information and present a thorough explanation of Pie Chart using the slides given. This template can be altered and personalized to fit your needs. It is also available for immediate download. So grab it now.
-
 VED Analysis For Inventory Management Strategies For Forecasting And Ordering Inventory
This slide showcases VED analysis method that can help organization in inventory management. its key components are product, category, annual expenditure and percentage of expenditure. Present the topic in a bit more detail with this VED Analysis For Inventory Management Strategies For Forecasting And Ordering Inventory Use it as a tool for discussion and navigation on VED Analysis, Inventory Management This template is free to edit as deemed fit for your organization. Therefore download it now.
-
 Procurement Order Cost And Savings Procurement Risk Analysis For Supply Chain
The following slide showcases a dashboard to track and manage cost and savings in procurement order. It includes key elements such as suppliers, contracted cost of purchase order, cost reduction, cost savings, cost avoidance, procurement ROI and top suppliers by cost reduction.Deliver an outstanding presentation on the topic using this Procurement Order Cost And Savings Procurement Risk Analysis For Supply Chain. Dispense information and present a thorough explanation of Saving Reduction, Cost Reduction, Purchase Order using the slides given. This template can be altered and personalized to fit your needs. It is also available for immediate download. So grab it now.
-
 Supplier Performance And Order Cycle Time Procurement Risk Analysis For Supply Chain
The following slide showcases a dashboard to supervise and manage procurement order cycle time an supplier performance. It includes key elements such as defect rate, on time supplies, supplier availability, lead time, supplier defect rate, defect type and delivery time.Present the topic in a bit more detail with this Supplier Performance And Order Cycle Time Procurement Risk Analysis For Supply Chain. Use it as a tool for discussion and navigation on Defect Rate, Supplier Availability, Lead Time. This template is free to edit as deemed fit for your organization. Therefore download it now.
-
 Kpi Dashboard To Assess Performance Of Order Key Methods To Enhance
This slide covers KPI dashboard to assess performance of integrating warehouse management system. It involves key details such as overall warehouse operating costs, perfect order rate and total number of shipments. Present the topic in a bit more detail with this Kpi Dashboard To Assess Performance Of Order Key Methods To Enhance Use it as a tool for discussion and navigation on Overall Warehouse Operating Costs, Perfect Order Rate This template is free to edit as deemed fit for your organization. Therefore download it now.
-
 Progress Bar Status Of Various Order Project
This template shows the progress bar of different project statuses. This slide aims to track the activities of various projects to complete the task on time. It includes parameters such as budget allocation, status, user, completion of task Presenting our well structured Progress Bar Status Of Various Order Project The topics discussed in this slide are Budget Allocation, Completion Of TaskThis is an instantly available PowerPoint presentation that can be edited conveniently. Download it right away and captivate your audience.
-
 Progress Status Of Order Placed Kpi Dashboard
This template shows the various KPIs for tracking the order progress. The purpose of this slide is to evaluate all the orders on time. It includes KPIs such as orders, global Financial performance, volume of orders, etc. Presenting our well structured Progress Status Of Order Placed Kpi Dashboard The topics discussed in this slide are Volume Today, Global Financial PerformanceThis is an instantly available PowerPoint presentation that can be edited conveniently. Download it right away and captivate your audience.
-
 KPI Dashboard To Assess Performance Of Order Logistics Strategy To Enhance Operations
This slide covers KPI dashboard to assess performance of integrating warehouse management system. It involves key details such as overall warehouse operating costs, perfect order rate and total number of shipments. Present the topic in a bit more detail with this KPI Dashboard To Assess Performance Of Order Logistics Strategy To Enhance Operations Use it as a tool for discussion and navigation on Overall Warehouse, Perfect Order Rate This template is free to edit as deemed fit for your organization. Therefore download it now.
-
 Order Receiving Channels In Global Virtual Food Delivery Market Assessment
This slide presents various platforms used globally for connecting and ordering food in cloud kitchen industry. It highlights channels such as website, phone call, take away and mobile application. Present the topic in a bit more detail with this Order Receiving Channels In Global Virtual Food Delivery Market Assessment Use it as a tool for discussion and navigation on Globally Prefer Mobile, Personalized Experience This template is free to edit as deemed fit for your organization. Therefore download it now.
-
 Jt three staged sales order chart powerpoint template
Presenting jt three staged sales order chart powerpoint template. Three staged order chart diagram has been used to craft this power point template diagram. This PPT diagram contains the concept of sales order representation. Use this icon template for business and sales related presentations.
-
 Warehouse kpi for completed correct orders inspection time ppt slide
Presenting warehouse kpi for completed correct orders inspection time ppt slide. This presentation slide shows Three Key Performance Indicators or KPIs in a Dashboard style design. The first KPI that can be shown is Box Order Completeness. The second KPI is Box Order Correctness. The third is Average Dock to Stock Time For Inspection Testing. These KPI Powerpoint graphics are all data driven, and the shape automatically adjusts according to your data. Just right click on the KPI graphic, enter the right value and the shape will adjust automatically. Make a visual impact with our KPI slides.
-
 Warehouse kpi for picked items completed orders correct orders presentation slide
Presenting warehouse kpi for picked items completed orders correct orders presentation slide. This presentation slide shows Three Key Performance Indicators or KPIs in a Dashboard style design. The first KPI that can be shown is Number of Line Items Picked. The second KPI is Pallet Order Completeness. The third is Pallet Order Correctness. These KPI Powerpoint graphics are all data driven, and the shape automatically adjusts according to your data. Just right click on the KPI graphic, enter the right value and the shape will adjust automatically. Make a visual impact with our KPI slides.
-
 Supply chain kpi for safety stock backorders order cycle time presentation slide
Presenting supply chain kpi for safety stock backorders order cycle time presentation slide. This presentation slide shows three Key Performance Indicators or KPIs in a Dashboard style design. The first KPI that can be shown is Size of Safety Stock. The second KPI is percentage of Backorders and the third is Customer Order Cycle Time. These KPI Powerpoint graphics are all data driven, and the shape automatically adjusts according to your data. Just right click on the KPI graphic, enter the right value and the shape will adjust automatically. Make a visual impact with our KPI slides.
-
 Carrying kpi for agreed delivery time free orders cost fuel per package presentation slide
Presenting carrying kpi for agreed delivery time free orders cost fuel per package presentation slide. This presentation slide shows three Key Performance Indicators or KPIs in a Dashboard style design. The first KPI that can be shown is percentage of Agreed Delivery Times Reached. The second KPI is percentage of Free Orders Delivered Cost and the third is Amount of Fuel Per Package. These KPI Powerpoint graphics are all data driven, and the shape automatically adjusts according to your data. Just right click on the KPI graphic, enter the right value and the shape will adjust automatically. Make a visual impact with our KPI slides.
-
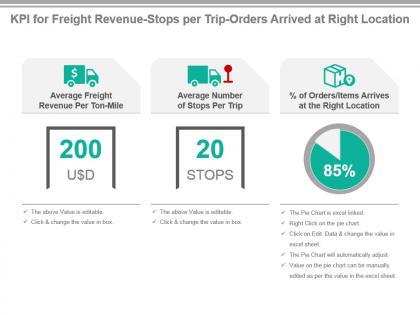 Kpi for freight revenue stops per trip orders arrived at right location presentation slide
Presenting kpi for freight revenue stops per trip orders arrived at right location presentation slide. This presentation slide shows three Key Performance Indicators or KPIs in a Dashboard style design. The first KPI that can be shown is Average Freight Revenue Per Ton Mile. The second KPI is Average Number of Stops Per Trip and the third is percentage of Orders Items Arrives at the Right Location. These KPI Powerpoint graphics are all data driven, and the shape automatically adjusts according to your data. Just right click on the KPI graphic, enter the right value and the shape will adjust automatically. Make a visual impact with our KPI slides.
-
 Transportation kpi for damaged orders on time delivery freight cost ppt slide
Presenting transportation kpi for damaged orders on time delivery freight cost ppt slide. This presentation slide shows three Key Performance Indicators or KPIs in a Dashboard style design. The first KPI that can be shown is percentage of Orders Delivered With Damaged Products Items. The second KPI is on Time Delivery and Pickup Load, Stop and Shipment and the third is Freight Cost Per Unit Shipped. These KPI Powerpoint graphics are all data driven, and the shape automatically adjusts according to your data. Just right click on the KPI graphic, enter the right value and the shape will adjust automatically. Make a visual impact with our KPI slides.
-
 Kpi for average handling cost in order fulfillment powerpoint slide
Presenting kpi for average handling cost in order fulfillment powerpoint slide. This presentation slide shows two Key Performance Indicators or KPIs. The first KPI that can be show is Average Number of Days Open of Orders. The second KPI is Average Handling Cost Per Order. These KPI Powerpoint graphics are all data driven, and the shape automatically adjusts according to your data. Just right click on the KPI graphic, enter the right value and the shape will adjust automatically. Make a visual impact with our KPI slides.
-
 Kpi for committed date order fill rate items picked per hour presentation slide
Presenting kpi for committed date order fill rate items picked per hour presentation slide. This presentation slide shows three Key Performance Indicators or KPIs. The first KPI that can be show is percentage Orders Delivered By Committed Date. The second KPI is Order Fill Rate, Supplier and the third is Picks Per Man Hour. These KPI Powerpoint graphics are all data driven, and the shape automatically adjusts according to your data. Just right click on the KPI graphic, enter the right value and the shape will adjust automatically. Make a visual impact with our KPI slides.
-
 Kpi for customer order fulfilment with lead time analysis ppt slide
Presenting kpi for customer order fulfilment with lead time analysis ppt slide. This presentation slide shows three Key Performance Indicators or KPIs. The first KPI that can be show is Order Fill Rate, Customer. The second KPI is Order Fulfillment Lead Time and the third is percentage of Orders Requiring Rework. These KPI Powerpoint graphics are all data driven, and the shape automatically adjusts according to your data. Just right click on the KPI graphic, enter the right value and the shape will adjust automatically. Make a visual impact with our KPI slides.
-
 Kpi for neglected assigned escalated orders presentation slide
Presenting kpi for neglected assigned escalated orders presentation slide. This presentation slide shows three Key Performance Indicators or KPIs. The first KPI that can be show is percentage of Neglected Orders. The second KPI is percentage of Incorrectly Assigned Orders and the third is percentage of Escalated Orders. These KPI Powerpoint graphics are all data driven, and the shape automatically adjusts according to your data. Just right click on the KPI graphic, enter the right value and the shape will adjust automatically. Make a visual impact with our KPI slides.
-
 Kpi for order entry to shipment delivery errors invoice errors powerpoint slide
Presenting kpi for order entry to shipment delivery errors invoice errors powerpoint slide. This presentation slide shows three Key Performance Indicators or KPIs. The first KPI that can be show is Order Cycle, Order Entry to Shipment. The second KPI is percentage Orders, Delivery Errors and the third is Orders, Nvoice Errors. These KPI Powerpoint graphics are all data driven, and the shape automatically adjusts according to your data. Just right click on the KPI graphic, enter the right value and the shape will adjust automatically. Make a visual impact with our KPI slides.
-
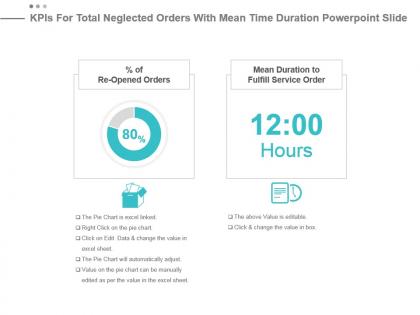 Kpis for total neglected orders with mean time duration powerpoint slide
Presenting kpis for total neglected orders with mean time duration powerpoint slide. This presentation slide shows two Key Performance Indicators or KPIs. The first KPI that can be show is percentage of Re Opened Orders . The second KPI is Mean Duration to Fulfill Service Order. These KPI Powerpoint graphics are all data driven, and the shape automatically adjusts according to your data. Just right click on the KPI graphic, enter the right value and the shape will adjust automatically. Make a visual impact with our KPI slides.
-
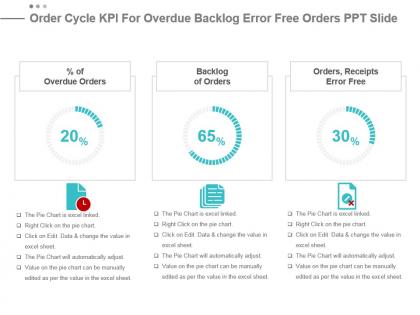 Order cycle kpi for overdue backlog error free orders ppt slide
Presenting order cycle kpi for overdue backlog error free orders ppt slide. This presentation slide shows three Key Performance Indicators or KPIs. The first KPI that can be show is percentage of Overdue Orders. The second KPI is Backlog of Orders and the third is Orders, Receipts Error Free. These KPI Powerpoint graphics are all data driven, and the shape automatically adjusts according to your data. Just right click on the KPI graphic, enter the right value and the shape will adjust automatically. Make a visual impact with our KPI slides.
-
 Order fill rate for delayed orders fulfilment process powerpoint slide
Presenting order fill rate for delayed orders fulfilment process powerpoint slide. This presentation slide shows two Key Performance Indicators or KPIs. The first KPI that can be show is Average Days Late Per Late Order. The second KPI is Fulfillment Process Costs as percentage Opex. These KPI Powerpoint graphics are all data driven, and the shape automatically adjusts according to your data. Just right click on the KPI graphic, enter the right value and the shape will adjust automatically. Make a visual impact with our KPI slides.
-
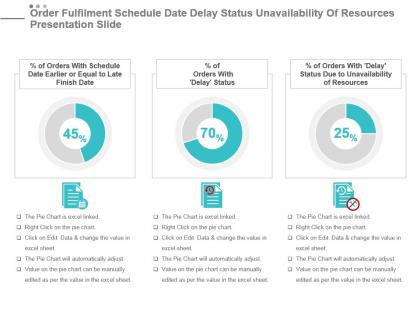 Order fulfilment schedule date delay status unavailability of resources presentation slide
Presenting order fulfilment schedule date delay status unavailability of resources presentation slide. This presentation slide shows three Key Performance Indicators or KPIs. The first KPI that can be show is percentage of Orders With Schedule Date Earlier or Equal to Late Finish Date. The second KPI is percentage of Orders With Delay Status and the third is percentage of Orders With Delay Status Due to Unavailability of Resources. These KPI Powerpoint graphics are all data driven, and the shape automatically adjusts according to your data. Just right click on the KPI graphic, enter the right value and the shape will adjust automatically. Make a visual impact with our KPI slides.
-
 Ontime value kpi for orders damage shipments ppt slide
Presenting ontime value kpi for orders damage shipments ppt slide. This presentation slide shows two Key Performance Indicators or KPIs in a Dashboard style design. The first KPI that can be shown is Orders, Correct Documentation. The second KPI is Orders, Damage Shipments. These KPI Powerpoint graphics are all data driven, and the shape automatically adjusts according to your data. Just right click on the KPI graphic, enter the right value and the shape will adjust automatically. Make a visual impact with our KPI slides.
-
 Percentage value for incorrect orders de ppt slide
Presenting percentage value for incorrect orders de ppt slide. This presentation slide shows two Key Performance Indicators or KPIs in a Dashboard style design. The first KPI that can be shown is percentage of Orders That Were Captured With Incorrect Attributes. The second KPI is percentage of Orders That Were Delivered With Requested Documentation. These KPI Powerpoint graphics are all data driven, and the shape automatically adjusts according to your data. Just right click on the KPI graphic, enter the right value and the shape will adjust automatically. Make a visual impact with our KPI slides.
-
 Percentage value kpi for edi transactions back orders time presentation slide
Presenting percentage value kpi for edi transactions back orders time presentation slide. This presentation slide shows two Key Performance Indicators or KPIs in a Dashboard style design. The first KPI that can be shown is percentage of EDI transactions. The second KPI is percentage of Time Spent Picking Back Orders. These KPI Powerpoint graphics are all data driven, and the shape automatically adjusts according to your data. Just right click on the KPI graphic, enter the right value and the shape will adjust automatically. Make a visual impact with our KPI slides.
-
 Suppliers kpi for uninterrupted orders forecast accuracy powerpoint slide
Presenting suppliers kpi for uninterrupted orders forecast accuracy powerpoint slide. This presentation slide shows two Key Performance Indicators or KPIs in a Dashboard style design. The first KPI that can be shown is Percentage of Uninterrupted Orders. The second KPI is Forecast Accuracy. These KPI Powerpoint graphics are all data driven, and the shape automatically adjusts according to your data. Just right click on the KPI graphic, enter the right value and the shape will adjust automatically. Make a visual impact with our KPI slides.
-
 Quantitative data showing column chart sales by order type
Presenting this set of slides with name - Quantitative Data Showing Column Chart Sales By Order Type. This is a four stage process. The stages in this process are Quantitative, Financial Analysis, Statistical Modelling.
-
 Engineering procurement and construction kpi dashboard showing cost of purchase order and cost reduction
You can use this PPT slideshow very easily as it is fully customizable. You can effortlessly insert or remove any diagrammatic representation from the given template. The font size, font color and font style can be easily edited. This graph PPT is linked to excel and changes automatically based on the data you enter. You can save the deck in either PDF or JPG format. To make any changes in the PPT slideshow, simply follow the instructions given in the sample slides. The size, color and orientation of all shapes are 100% customizable, so don’t waste any further time and download this presentation.
-
 Engineering procurement and construction kpi showing production volume and quantity ordered
Presenting this set of slides with name - Engineering Procurement And Construction Kpi Showing Production Volume And Quantity Ordered. This is a four stage process. The stages in this process are Engineering, Procurement And Construction, Construction Management, Engineering, Purchasing And Construction .
-
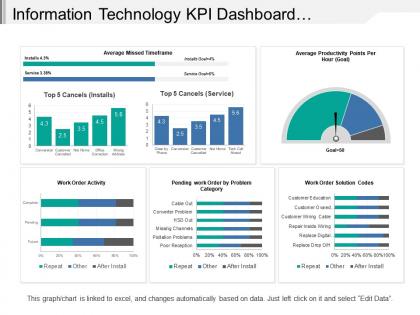 Information technology kpi dashboard showing work order activity
Presenting this set of slides with name - Information Technology Kpi Dashboard Showing Work Order Activity. This is a six stage process. The stages in this process are Information Technology, It, Iot.
-
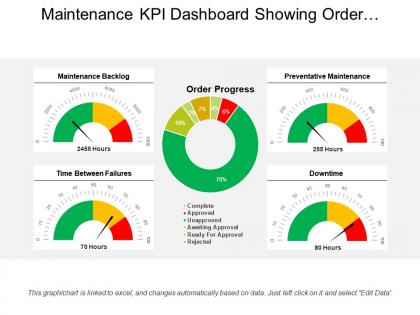 Maintenance kpi dashboard showing order progress and backlog
Presenting our maintenance KPI dashboard showing order progress and backlog. This PPT slide offers you plenty of space to put in titles and sub titles. High resolution-based presentation layout, does not change the image even after resizing. This presentation icon is data driven and template can be downloaded via excel file to incorporate data. Quick downloading speed and simple editing options in color text and fonts.PPT icons can easily be changed into JPEG and PDF applications.
-
 Maintenance kpi dashboard showing overdue work orders by priority and department
Presenting this set of slides with name - Maintenance Kpi Dashboard Showing Overdue Work Orders By Priority And Department. This is a four stage process. The stages in this process are Maintenance, Preservation, Conservation.
-
 Vendor kpi dashboard showing order detail inventory and orders to ship today
Presenting this set of slides with name - Vendor Kpi Dashboard Showing Order Detail Inventory And Orders To Ship Today. This is a four stage process. The stages in this process are Vendor, Supplier, Retailer.
-
 Vendor kpi dashboard showing sales by day sales person analysis top 10 customers by order value
Presenting this set of slides with name - Vendor Kpi Dashboard Showing Sales By Day Sales Person Analysis Top 10 Customers By Order Value. This is a six stage process. The stages in this process are Vendor, Supplier, Retailer.
-
 0514 order and revenue financial chart diagram
High quality PPT graphics don’t pixelate when projected on large screen. Widely used by financiers, finance department, business managers and planners for translating information. 100 percent editable PowerPoint colors, orientation, text and graphics. Easy inclusion of company name, trademark and logo. Compatible with multiple number of online and offline software. Flexible option for conversion in PDF or JPG formats.
-
 0914 business plan bar graph in ascending order image slide powerpoint presentation template
We are proud to present our 0914 business plan bar graph in ascending order image slide powerpoint presentation template. This image slide displays bar graph in ascending order with five stages. Use this image slide, in your presentations to express views on progress, growth and for analyzing market research. This image slide will enhance the quality of your presentations.
-
 0914 business plan bar graph with descending order image slide powerpoint presentation template
We are proud to present our 0914 business plan bar graph with descending order image slide powerpoint presentation template. This image slide displays abstract 3d five alphabetic options cube bars with icons. Use this image slide, in your presentations to express views on progress, growth and for analyzing market research. This image slide may also be used to depict different business strategies. This image slide will enhance the quality of your presentations.
-
 Government and public works kpi dashboard showing work order by category and status
Presenting the KPI dashboard presentation layout. This dashboard template is completely customizable and is professionally designed. You can modify the objects in the template like font color and font size without going through any fuss. This presentation slide is fully compatible with Google Slide and can be saved in JPG or PDF file format without any hassle. Fast download this at the click of the button.
-
 Warehousing kpi dashboard showing collecting time and orders per day
Presenting, warehousing dashboard KPI PowerPoint Presentation Slide. This Presentation has been designed professionally and is fully editable. You can personalize font size, font type, colors, and even the background. This Template is obedient with Google Slide and can be saved in JPG or PDF format without any hassle. Fast download at the click of the button.
-
 Warehousing kpi dashboard showing operating costs and order rate
The main advantage of this highly versatile PPT design is that it’s completely editable; you can include your business logo, trademarks to personalize the design. Also, you can include business related custom content over text place holders. Design can be opened and edited with Google Slides and MS PowerPoint software. You can download this PowerPoint design into JPEG and PDF formats.
-
 Warehousing kpi dashboard showing order status and active pickers
The design template is compatible with Google Slides and MS PowerPoint software. You can download this design into various formats such as JPEG or PDF format. The warehouse KPI dashboard PPT design template is 100% editable; you can modify and personalize the design according to your business requirements. Design is fully supported on standard and full screen view; no change in design quality on full screen view.
-
 Warehousing kpi dashboard showing perfect order rate and inventory accuracy
PPT design can instantly be downloaded as JPEG and PDF formats. Design template is easily editable, the best advantage of this business oriented PPT design is the use of excel linked charts, where charts in PPT design will automatically get changed when you update storage related figures on linked excel sheet. The PPT design is fully compatible with Google Slides and MS PowerPoint software. Design can be viewed both in standard and full screen view.
-
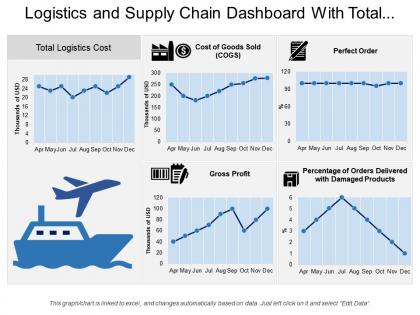 Logistics and supply chain dashboard with total logistics cost and perfect order
Presenting this set of slides with name - Logistics And Supply Chain Dashboard With Total Logistics Cost And Perfect Order. This is a six stage process. The stages in this process are Logistics Dashboard, Logistics Kpis, Logistics Performance.


