Powerpoint Templates and Google slides for Operation Dashboard
Save Your Time and attract your audience with our fully editable PPT Templates and Slides.
-
 Operations Dashboard Powerpoint Ppt Template Bundles
Deliver a credible and compelling presentation by deploying this Operations Dashboard Powerpoint Ppt Template Bundles. Intensify your message with the right graphics, images, icons, etc. presented in this complete deck. This PPT template is a great starting point to convey your messages and build a good collaboration. The sixteen slides added to this PowerPoint slideshow helps you present a thorough explanation of the topic. You can use it to study and present various kinds of information in the form of stats, figures, data charts, and many more. This Operations Dashboard Powerpoint Ppt Template Bundles PPT slideshow is available for use in standard and widescreen aspects ratios. So, you can use it as per your convenience. Apart from this, it can be downloaded in PNG, JPG, and PDF formats, all completely editable and modifiable. The most profound feature of this PPT design is that it is fully compatible with Google Slides making it suitable for every industry and business domain.
-
 Sales And Operation Dashboard Powerpoint PPT Template Bundles
If you require a professional template with great design, then this Sales And Operation Dashboard Powerpoint PPT Template Bundles is an ideal fit for you. Deploy it to enthrall your audience and increase your presentation threshold with the right graphics, images, and structure. Portray your ideas and vision using twelve slides included in this complete deck. This template is suitable for expert discussion meetings presenting your views on the topic. With a variety of slides having the same thematic representation, this template can be regarded as a complete package. It employs some of the best design practices, so everything is well-structured. Not only this, it responds to all your needs and requirements by quickly adapting itself to the changes you make. This PPT slideshow is available for immediate download in PNG, JPG, and PDF formats, further enhancing its usability. Grab it by clicking the download button.
-
 Operations Dashboard Business Strength Documents Restaurants
Deliver a credible and compelling presentation by deploying this Operations Dashboard Business Strength Documents Restaurants. Intensify your message with the right graphics, images, icons, etc. presented in this complete deck. This PPT template is a great starting point to convey your messages and build a good collaboration. The twelve slides added to this PowerPoint slideshow helps you present a thorough explanation of the topic. You can use it to study and present various kinds of information in the form of stats, figures, data charts, and many more. This Operations Dashboard Business Strength Documents Restaurants PPT slideshow is available for use in standard and widescreen aspects ratios. So, you can use it as per your convenience. Apart from this, it can be downloaded in PNG, JPG, and PDF formats, all completely editable and modifiable. The most profound feature of this PPT design is that it is fully compatible with Google Slides making it suitable for every industry and business domain.
-
 Dashboard To Track Warehouse Shipments And Operating Strategies To Manage And Control Retail
This slide showcases dashboard that can help organization to track operating cost incurred by organization in different warehousing activities. Its other key elements are perfect order rate, total shipments by country and on ime shipments. Deliver an outstanding presentation on the topic using this Dashboard To Track Warehouse Shipments And Operating Strategies To Manage And Control Retail. Dispense information and present a thorough explanation of Operating, Cost, Distribution using the slides given. This template can be altered and personalized to fit your needs. It is also available for immediate download. So grab it now.
-
 Key Metrics Dashboard To Track And Analyse Hiring Optimizing HR Operations Through
Following slide represents dashboard that helps to analyse recruitment funnel to track employee staffing process. It includes metrics such as time to hire, time to fill, recruitment costs, age of applicants etc.Present the topic in a bit more detail with this Key Metrics Dashboard To Track And Analyse Hiring Optimizing HR Operations Through. Use it as a tool for discussion and navigation on Operational Dashboard, Through Stages, Female Ratio. This template is free to edit as deemed fit for your organization. Therefore download it now.
-
 KPIs Dashboard To Track Hiring Progress Of Company Optimizing HR Operations Through
Following slide exhibits dashboard to track hiring process that helps recruitment team to achieve goals. It includes elements such as hires per month, hires, average time to hire, offer acceptance rate etc.Deliver an outstanding presentation on the topic using this KPIs Dashboard To Track Hiring Progress Of Company Optimizing HR Operations Through. Dispense information and present a thorough explanation of Staffing Department, Interview Activity, Objectives Key Results using the slides given. This template can be altered and personalized to fit your needs. It is also available for immediate download. So grab it now.
-
 Dashboard For Managing IOT Device In Smart City Operations Impact Of IOT On Various Industries IOT SS
This slide highlights the dashboard for controlling IoT devices in smart city management operations. It provides combined information related to street lighting, waste management, smart parking, smart bin trackers, energy management, environment data, etc. Present the topic in a bit more detail with this Dashboard For Managing IOT Device In Smart City Operations Impact Of IOT On Various Industries IOT SS. Use it as a tool for discussion and navigation on Street Lighting, Waste Management, Smart Parking, Energy Management. This template is free to edit as deemed fit for your organization. Therefore download it now.
-
 Progressive Dashboard For Restaurant Operations Management
This slide represents KPI dashboard for restaurant operations management to track profitability growth rate of business based upon sales, employee cost. It includes metrics such as net sales, food cost percent, customer survey score, etc. Introducing our Progressive Dashboard For Restaurant Operations Management set of slides. The topics discussed in these slides are Dashboard, Operations, Management. This is an immediately available PowerPoint presentation that can be conveniently customized. Download it and convince your audience.
-
 Financial Performance Management With KPI Dashboard Enhancing Business Operations
The following slide highlights the impact of adopting enterprise resource planning ERP software on financial performance to measure its success. It includes key performance indicators such as gross profit margin, operating ratio, net profit margin, liquidity status etc. Deliver an outstanding presentation on the topic using this Financial Performance Management With KPI Dashboard Enhancing Business Operations. Dispense information and present a thorough explanation of Gross Sales, Income And Expenses, Financial Performance using the slides given. This template can be altered and personalized to fit your needs. It is also available for immediate download. So grab it now.
-
 Supplier And Vendor Management KPI Dashboard Enhancing Business Operations
The following slide showcases the key performance indicators KPIs to track vendor performance post ERP implementation. It mainly includes elements such as rejection rate, ordered value, number of suppliers, purchase in tie and budget etc. Deliver an outstanding presentation on the topic using this Supplier And Vendor Management KPI Dashboard Enhancing Business Operations. Dispense information and present a thorough explanation of Vendor Rejection Rate, Spend Under Management, Purchase In Time And Budget using the slides given. This template can be altered and personalized to fit your needs. It is also available for immediate download. So grab it now.
-
 Dashboard To Track AI Manufacturing Operations Transforming Industries With AI ML And NLP Strategy
This slide depicts a performance dashboard to track manufacturing operations, including production volume, order volume, active machines, sales revenue, top five products, downtime causes, production volume by top five machines, etc. Deliver an outstanding presentation on the topic using this Dashboard To Track AI Manufacturing Operations Transforming Industries With AI ML And NLP Strategy. Dispense information and present a thorough explanation of Track, Manufacturing, Operations using the slides given. This template can be altered and personalized to fit your needs. It is also available for immediate download. So grab it now.
-
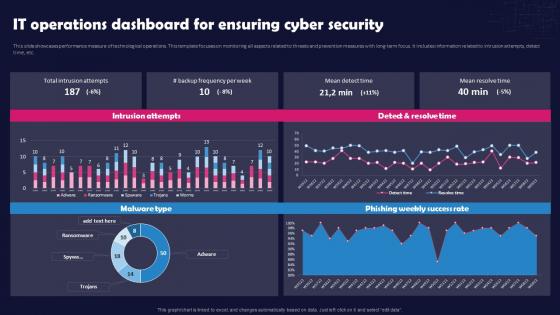 Unlocking The Impact Of Technology It Operations Dashboard For Ensuring Cyber Security
This slide showcases performance measure of technological operations. This template focuses on monitoring all aspects related to threats and prevention measures with long-term focus. It includes information related to intrusion attempts, detect time, etc. Present the topic in a bit more detail with this Unlocking The Impact Of Technology It Operations Dashboard For Ensuring Cyber Security. Use it as a tool for discussion and navigation on IT Operations Dashboard, Ensuring Cyber Security, Threats And Prevention, Technological Operations. This template is free to edit as deemed fit for your organization. Therefore download it now.
-
 Dashboard For Tracking Cloud Operation Management
This slide showcases a dashboard for cloud operation management information. The main aim of this template is to highlight cloud assets and cloud assets by resources This includes global assets, asset availability, etc.Introducing our Dashboard For Tracking Cloud Operation Management set of slides. The topics discussed in these slides are Cloud Cost Trends, Asset Availability, Cloud Cost Insights. This is an immediately available PowerPoint presentation that can be conveniently customized. Download it and convince your audience.
-
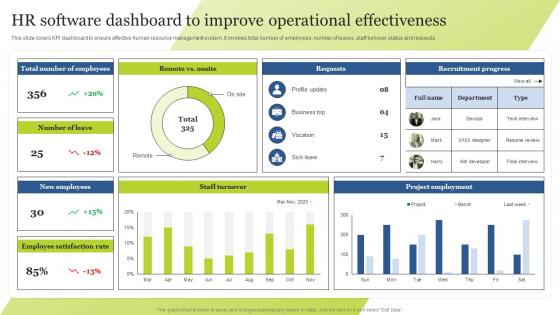 HR Software Dashboard To Improve Operational Effectiveness Guide For Integrating Technology Strategy SS V
This slide covers KPI dashboard to ensure effective human resource management system. It involves total number of employees, number of leaves, staff turnover status and requests. Present the topic in a bit more detail with this HR Software Dashboard To Improve Operational Effectiveness Guide For Integrating Technology Strategy SS V. Use it as a tool for discussion and navigation on Requests, Project Employment. This template is free to edit as deemed fit for your organization. Therefore download it now.
-
 Banking Operations Dashboard Showcasing Deposit Strategic Improvement In Banking Operations
this slide highlights the banking operation strategy dashboard which showcases current account and saving account growth rate, savings account deposits, current account deposits and retail term deposits. Deliver an outstanding presentation on the topic using this Banking Operations Dashboard Showcasing Deposit Strategic Improvement In Banking Operations. Dispense information and present a thorough explanation of Dashboard, Growth, Operations using the slides given. This template can be altered and personalized to fit your needs. It is also available for immediate download. So grab it now.
-
 Banking Operations Performance Tracking Dashboard Strategic Improvement In Banking Operations
The purpose of the mentioned slide is to showcase a performance tracking dashboard of banking operations. It includes metrics such as accounts opened and closed, total deposits, referrals by product, etc. Present the topic in a bit more detail with this Banking Operations Performance Tracking Dashboard Strategic Improvement In Banking Operations. Use it as a tool for discussion and navigation on Operations, Performance, Dashboard. This template is free to edit as deemed fit for your organization. Therefore download it now.
-
 Technical Operation Support Services Kpi Dashboard
This slide depicts the metrics of technical services and provides details about tickets and projects run by the team. It includes elements such as tickets raised, IT net performance score, etc. Introducing our Technical Operation Support Services Kpi Dashboard set of slides. The topics discussed in these slides are Operation, Dashboard, Performance. This is an immediately available PowerPoint presentation that can be conveniently customized. Download it and convince your audience.
-
 Operations Research Cybernetics Implant Performance Tracking Dashboard
This slide shows the Cybernetics implant performance tracking dashboard. The purpose of this slide is to represent the Information related to the status of Cybernetics implant graphically. Deliver an outstanding presentation on the topic using this Operations Research Cybernetics Implant Performance Tracking Dashboard. Dispense information and present a thorough explanation of Performance, Activity, Implant using the slides given. This template can be altered and personalized to fit your needs. It is also available for immediate download. So grab it now.
-
 Dashboard Tracking Process Design In Operations Management
This slide showcases dashboard for tracking process design in operation management. The main purpose of this slide is to showcase records related to products. This includes new orders, monthly orders, pending orders etc.Presenting our well structured Dashboard Tracking Process Design In Operations Management. The topics discussed in this slide are Orders Pending, Orders Returned, Monthly Order. This is an instantly available PowerPoint presentation that can be edited conveniently. Download it right away and captivate your audience.
-
 Operations Management Dashboard Process Design
This slide showcases operation management dashboard. The main purpose of this template is tracking operation management such as no. of ticket, tickets raised this month, new employees, assignments, etc.Introducing our Operations Management Dashboard Process Design set of slides. The topics discussed in these slides are Operations Management, Dashboard Process Design. This is an immediately available PowerPoint presentation that can be conveniently customized. Download it and convince your audience.
-
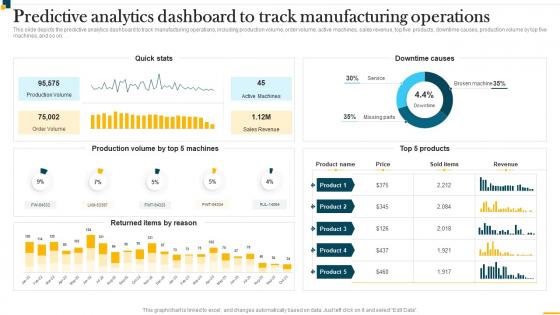 IT In Manufacturing Industry V2 Predictive Analytics Dashboard To Track Manufacturing Operations
This slide depicts the predictive analytics dashboard to track manufacturing operations, including production volume, order volume, active machines, sales revenue, top five products, downtime causes, production volume by top five machines, and so on. Present the topic in a bit more detail with this IT In Manufacturing Industry V2 Predictive Analytics Dashboard To Track Manufacturing Operations. Use it as a tool for discussion and navigation on Predictive Analytics Dashboard, Track Manufacturing Operations, Production Volume. This template is free to edit as deemed fit for your organization. Therefore download it now.
-
 Dashboard To Measure Performance Of Rpa Streamlining Operations With Artificial Intelligence
This slide represents the critical performance indicators of RPA, such as time and money saved by different processes and the efficiency of the HR department in routine tasks. Present the topic in a bit more detail with this Dashboard To Measure Performance Of Rpa Streamlining Operations With Artificial Intelligence. Use it as a tool for discussion and navigation on Dashboard, Measure, Performance. This template is free to edit as deemed fit for your organization. Therefore download it now.
-
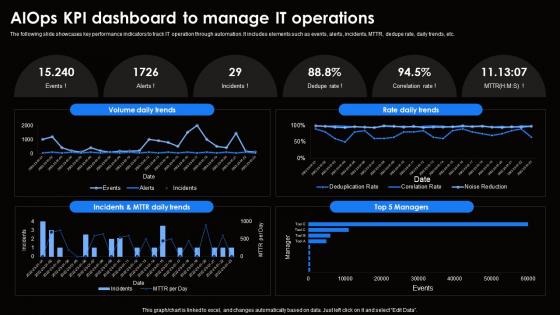 AIOps Kpi Dashboard To Manage It Ai For Effective It Operations Management AI SS V
The following slide showcases key performance indicators to track IT operation through automation. It includes elements such as events, alerts, incidents, MTTR, dedupe rate, daily trends, etc.Present the topic in a bit more detail with this AIOps Kpi Dashboard To Manage It Ai For Effective It Operations Management AI SS V. Use it as a tool for discussion and navigation on Volume Daily Trends, Rate Daily Trends, Daily Trends. This template is free to edit as deemed fit for your organization. Therefore download it now.
-
 Business Intelligence Dashboard For Tracking Operating Environment
This slide represents KPI dashboard of operating environment for monitoring business metrics and data points related to business unit. It includes metrics such as study artifacts, notification box, flow diagram, operations manager, etc. Presenting our well structured Business Intelligence Dashboard For Tracking Operating Environment. The topics discussed in this slide are Study Artifacts, Notification Box, Flow Diagram. This is an instantly available PowerPoint presentation that can be edited conveniently. Download it right away and captivate your audience.
-
 Aiops Kpi Dashboard To Manage It Operations Introduction To Aiops AI SS V
The following slide showcases key performance indicators to track IT operation through automation. It includes elements such as events, alerts, incidents, MTTR, dedupe rate, daily trends, etc. Deliver an outstanding presentation on the topic using this Aiops Kpi Dashboard To Manage It Operations Introduction To Aiops AI SS V. Dispense information and present a thorough explanation of Volume Daily Trends, Rate Daily Trends using the slides given. This template can be altered and personalized to fit your needs. It is also available for immediate download. So grab it now.
-
 Smart Fleet Management Dashboard Showing Business Operations IOT Fleet Management IOT SS V
The following slide delineates smart fleet management dashboard through which fleet companies can take data-driven decisions in real-time. The major metrics mentioned in slide are distance travelled, over speeding, violation alert, idle, harsh breaking, etc. Deliver an outstanding presentation on the topic using this Smart Fleet Management Dashboard Showing Business Operations IOT Fleet Management IOT SS V. Dispense information and present a thorough explanation of Distance Travelled, Driver Scoreboard, Business Operations using the slides given. This template can be altered and personalized to fit your needs. It is also available for immediate download. So grab it now.
-
 Dashboard For Tracking Smart City Operations By IoT Revolution In Smart Cities Applications IoT SS
This slide highlights the dashboard for controlling IoT devices in smart city management operations. It provides combined information related to street lighting, waste management, smart parking, smart bin trackers, energy management, environmental data, etc.Deliver an outstanding presentation on the topic using this Dashboard For Tracking Smart City Operations By IoT Revolution In Smart Cities Applications IoT SS. Dispense information and present a thorough explanation of Smart Street Lights, Waste Management, Smart Parking using the slides given. This template can be altered and personalized to fit your needs. It is also available for immediate download. So grab it now.
-
 AIOps Kpi Dashboard To Manage It Operations Comprehensive Guide To Begin AI SS V
The following slide showcases key performance indicators to track IT operation through automation. It includes elements such as events, alerts, incidents, MTTR, dedupe rate, daily trends, etc.Deliver an outstanding presentation on the topic using this AIOps Kpi Dashboard To Manage It Operations Comprehensive Guide To Begin AI SS V. Dispense information and present a thorough explanation of Correlation Rate, Volume Daily Trends, Daily Trends using the slides given. This template can be altered and personalized to fit your needs. It is also available for immediate download. So grab it now.
-
 AIOps Kpi Dashboard To Manage IT Operations IT Operations Automation An AIOps AI SS V
The following slide showcases key performance indicators to track IT operation through automation. It includes elements such as events, alerts, incidents, MTTR, dedupe rate, daily trends, etc.Deliver an outstanding presentation on the topic using this AIOps Kpi Dashboard To Manage IT Operations IT Operations Automation An AIOps AI SS V. Dispense information and present a thorough explanation of Volume Daily Trends, Rate Daily Trends, Incidents Trends using the slides given. This template can be altered and personalized to fit your needs. It is also available for immediate download. So grab it now.
-
 Application Health Monitoring Kpi Dashboard IT Operations Automation An AIOps AI SS V
The following slide showcases key performance indicators to monitor app performance and improve user experience. It includes elements such as problems, hosts, services, database, response time, transactions, etc.Deliver an outstanding presentation on the topic using this Application Health Monitoring Kpi Dashboard IT Operations Automation An AIOps AI SS V. Dispense information and present a thorough explanation of Quick Overview, Cloud Infrastructure, Application Health using the slides given. This template can be altered and personalized to fit your needs. It is also available for immediate download. So grab it now.
-
 KPI Dashboard To Manage Incidents And IT Operations Automation An AIOps AI SS V
The following slide showcases key performance indicators to review incidents and alerts. It includes elements such as noise reduction, auto remediation, alert heat map, noise trend, etc.Present the topic in a bit more detail with this KPI Dashboard To Manage Incidents And IT Operations Automation An AIOps AI SS V. Use it as a tool for discussion and navigation on Auto Remediation, Incidents Trend, Noise Reduction. This template is free to edit as deemed fit for your organization. Therefore download it now.
-
 Dashboard Of Marketing Campaign Operational Analytics
This slide showcases the marketing campaign analytics dashboard of an organization. It further includes various elements such as cost per acquisition, total acquisition, total clicks, total impressions, etc.Introducing our Dashboard Of Marketing Campaign Operational Analytics set of slides. The topics discussed in these slides are Cost Per Acquisition, Total Spend, Acquisitions Campaign. This is an immediately available PowerPoint presentation that can be conveniently customized. Download it and convince your audience.
-
 Operating System Dashboard For Continuous Improvement
This slide illustrates KPI or Dashboard of operating system to assess relevant issues and corresponding measures for tracking system and utilization rate. It includes metrics such as real time alerts, virtual CPU activity, performance, processor activity, etc. Introducing our Operating System Dashboard For Continuous Improvement set of slides. The topics discussed in these slides are Virtual CPU Activity, Virtual CPU Performance, Virtual Processor Activity. This is an immediately available PowerPoint presentation that can be conveniently customized. Download it and convince your audience.
-
 Operating System Dashboard For Data Performance Tracking
This slide illustrates KPI or dashboard of operating system by providing total number of computers by system role within collection, branch version, and state. It includes metrics such as computer software, hierarchical levels, and conditions. Presenting our well structured Operating System Dashboard For Data Performance Tracking. The topics discussed in this slide are Computer Software, Hierarchical Levels, Conditions. This is an instantly available PowerPoint presentation that can be edited conveniently. Download it right away and captivate your audience.
-
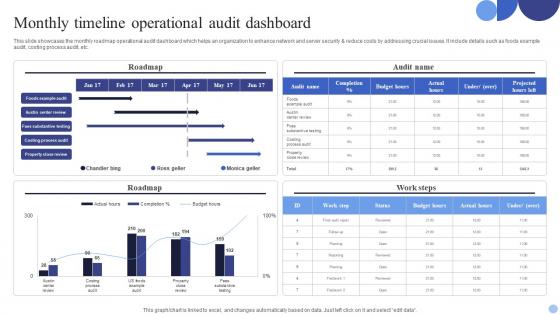 Monthly Timeline Operational Audit Dashboard
This slide showcases the monthly roadmap operational audit dashboard which helps an organization to enhance network and server security and reduce costs by addressing crucial issues. It include details such as foods example audit, costing process audit, etc. Presenting our well structured Monthly Timeline Operational Audit Dashboard. The topics discussed in this slide are Roadmap, Audit Name, Roadmap, Work Steps. This is an instantly available PowerPoint presentation that can be edited conveniently. Download it right away and captivate your audience.
-
 Supplier Risk Management Dashboard For Business Operations
This slide illustrates KPI or dashboard of supplier risk management and includes active suppliers, suppliers in onboarding phase, open supplier findings, etc. Presenting our well structured Supplier Risk Management Dashboard For Business Operations The topics discussed in this slide are Open Supplier Findings, Total Supplier Spend. This is an instantly available PowerPoint presentation that can be edited conveniently. Download it right away and captivate your audience.
-
 Dashboard To Analyse Performance Streamlining HR Operations Through Effective Hiring Strategies
Following slide showcases dashboard to measure performance of company mobile carer page for employee recruitment. It include indicators such as number of visitors, application completion rate, live vacancies etc. Deliver an outstanding presentation on the topic using this Dashboard To Analyse Performance Streamlining HR Operations Through Effective Hiring Strategies. Dispense information and present a thorough explanation of Customer Support, Engineering Roles, Completion Rate using the slides given. This template can be altered and personalized to fit your needs. It is also available for immediate download. So grab it now.
-
 KPI Dashboard To Track Performance Streamlining HR Operations Through Effective Hiring Strategies
Following slide exhibits dashboard to measure performance efficiency of using digital technology in recruitment strategy. It include indicators such as acceptance rate, days to fill, current hiring pipeline, top hiring sources etc. Present the topic in a bit more detail with this KPI Dashboard To Track Performance Streamlining HR Operations Through Effective Hiring Strategies. Use it as a tool for discussion and navigation on Hiring Pipeline, Technical Hiring, Technical Hiring. This template is free to edit as deemed fit for your organization. Therefore download it now.
-
 Dashboard To Evaluate Hospitals Operational Definitive Guide To Implement Data Analytics SS
This slide showcases dashboard for measuring hospital performance which helps in assessing operational gaps and developing improvement strategies. It provides information regarding KPIs such as total patients, overall patient satisfaction, patient admission per division, average wait times etc. Present the topic in a bit more detail with this Dashboard To Evaluate Hospitals Operational Definitive Guide To Implement Data Analytics SS. Use it as a tool for discussion and navigation on Gynaecology, Operational Cost, Admission Vs Cost Over Time. This template is free to edit as deemed fit for your organization. Therefore download it now.
-
 Mobile Security Dashboard To Monitor Operating Systems
This slide illustrates KPI or Dashboard of mobile security to assess different operating systems and includes iOS, android, other and assigned devices, etc. Introducing our Mobile Security Dashboard To Monitor Operating Systems set of slides. The topics discussed in these slides are Ios Devices, Assigned Devices, Firmware Distribution Ios, Android Devices, Other Devices, Firmware Distribution Android. This is an immediately available PowerPoint presentation that can be conveniently customized. Download it and convince your audience.
-
 Operation KPIs Dashboard For Retail Industry
The following slide spotlights essential metrics, including MoM growth, conversion rate, sell through, abandoned rate, online sales, visit statistics, and inventory loss rate, creating a comprehensive KPI dashboard for the retail industry. It facilitates real time monitoring and decision making to improve retail operations and profitability. Introducing our Operation KPIs Dashboard For Retail Industry set of slides. The topics discussed in these slides are Operation KPIs Dashboard, Retail Industry This is an immediately available PowerPoint presentation that can be conveniently customized. Download it and convince your audience.
-
 Operational Efficiency Improvement Manufacturing Dashboard
This slide illustrates operational improvement dashboard and includes project budget, overdue tasks, upcoming deadlines, average handling time. Presenting our well structured Operational Efficiency Improvement Manufacturing Dashboard The topics discussed in this slide are Project Budget, Overdue Tasks, Upcoming Deadlines This is an instantly available PowerPoint presentation that can be edited conveniently. Download it right away and captivate your audience.
-
 Financial Operations Reporting Dashboard For Manufacturing Firm
This slide showcases the dashboard to track operational functioning of a manufacturing firm. The purpose of this slide is to help the business track metrics such as weekly production volume, operational machines, etc., in order to determine overall business efficiency. Introducing our Financial Operations Reporting Dashboard For Manufacturing Firm set of slides. The topics discussed in these slides are Top 5 Performing Products, Distribution Downtime Factors, Production Volume. This is an immediately available PowerPoint presentation that can be conveniently customized. Download it and convince your audience.
-
 IT Cybersecurity Operation Reporting Dashboard
This slide depicts the reporting dashboard to track companys IT and cybersecurity measures. The purpose of this slide is to help the business safeguard its networks through the analysis of its current measures. It includes elements such as intrusion attempts, mean detection time, etc. Introducing our IT Cybersecurity Operation Reporting Dashboard set of slides. The topics discussed in these slides are Cyber Security, Advanced, Average Resolution Time. This is an immediately available PowerPoint presentation that can be conveniently customized. Download it and convince your audience.
-
 Operation Reporting Dashboard For Healthcare Business
This slide depicts the operation reporting dashboard for medical and healthcare businesses. The purpose of this operation reporting dashboard is to help identify business efficiency in order to deliver high quality services. It includes elements such as real-time bed occupancy rates, number of patients, etc. Presenting our well structured Operation Reporting Dashboard For Healthcare Business. The topics discussed in this slide are Real Time Bed Occupancy Rate, Estimated Patient Turnover Rate, Patient Satisfaction Metrics. This is an instantly available PowerPoint presentation that can be edited conveniently. Download it right away and captivate your audience.
-
 Operation Reporting Dashboard To Track Online Marketing Performance
This slide showcases the operation reporting dashboard to track online marketing performance. The purpose of this slide is to help the business determine effectiveness of online marketing campaigns through the help of metrics such as conversion rate by top performing campaigns, opportunity amount by top performing campaigns, etc. Introducing our Operation Reporting Dashboard To Track Online Marketing Performance set of slides. The topics discussed in these slides are Real Time Bed Occupancy Rate, Conversion Rate Performing Campaigns, Opportunity Source, Medium. This is an immediately available PowerPoint presentation that can be conveniently customized. Download it and convince your audience.
-
 Operation Reporting Dashboard To Track Retail Business Output
This slide depicts the operation reporting to track productivity of a retail business. The purpose of this slide is to track and monitor operation efficiency through the use of current business working capital, current business liabilities, current account status, etc. Presenting our well structured Operation Reporting Dashboard To Track Retail Business Output. The topics discussed in this slide are Current Account Stats, Yearly Cash Conversion Cycle, Current Business Liabilities. This is an instantly available PowerPoint presentation that can be edited conveniently. Download it right away and captivate your audience.
-
 Operation Reporting Metric Dashboard For Warehouse Company
This slide showcases the metrics dashboard to track and report operation efficiency in an warehousing company. The purpose of this slide is to help the business utilize its resources optimally in order to improve its productivity. It includes elements such as operational expenditure breakdown, perfect order percentage, etc. Introducing our Operation Reporting Metric Dashboard For Warehouse Company set of slides. The topics discussed in these slides are Operational Expenditure Breakdown, Perfect Order Percentage. This is an immediately available PowerPoint presentation that can be conveniently customized. Download it and convince your audience.
-
 Strategic Operation Reporting Dashboard For Marketing Company
This slide highlights the strategic operating reporting dashboard to determine effectiveness of multiple marketing campaigns. The purpose of this slide is to help monitor the cost and impact of several business campaigns in order to increase its sales and revenue. It includes elements such as total expenditure, total impressions generated, etc. Presenting our well structured Strategic Operation Reporting Dashboard For Marketing Company. The topics discussed in this slide are Cost Per Campaign, Quarterly Acquisition Campaign. This is an instantly available PowerPoint presentation that can be edited conveniently. Download it right away and captivate your audience.
-
 Manufacturing Operations Analytics Dashboard Manufacturing Execution System
This slide presents structured dashboard to track manufacturing effectiveness including KPI such as produced quantity, production quality, cost and monthly order tracking. Deliver an outstanding presentation on the topic using this Manufacturing Operations Analytics Dashboard Manufacturing Execution System. Dispense information and present a thorough explanation of Production Cost, Production Quality, Produced Quantity, Cost Efficiency using the slides given. This template can be altered and personalized to fit your needs. It is also available for immediate download. So grab it now.
-
 Security Operation Center Risk Assessment Dashboard
The following slide illustrates a risk assessment dashboard helps to understand the risk rating breakdown, action plan, top vulnerabilities, etc. of a business. Introducing our Security Operation Center Risk Assessment Dashboard set of slides. The topics discussed in these slides are Risk Assessment Progress, Solved, Action Plan, Risk Rating Breakdown. This is an immediately available PowerPoint presentation that can be conveniently customized. Download it and convince your audience.
-
 Real Time Icon Business Analytics Dashboard Processing Operation Monitoring Location
It has PPT slides covering wide range of topics showcasing all the core areas of your business needs. This complete deck focuses on Real Time Icon Business Analytics Dashboard Processing Operation Monitoring Location and consists of professionally designed templates with suitable graphics and appropriate content. This deck has total of ten slides. Our designers have created customizable templates for your convenience. You can make the required changes in the templates like colour, text and font size. Other than this, content can be added or deleted from the slide as per the requirement. Get access to this professionally designed complete deck PPT presentation by clicking the download button below.
-
 Non Profit Dashboard For Aligning Operational Plan Activities
This slide illustrates KPI non profit operational plan dashboard for monitoring, evaluating and optimizing performance, aligning activities with strategic goals. It includes metrics such as streamline operations, improve clarity, decrease running costs, etc. Presenting our well structured Non Profit Dashboard For Aligning Operational Plan Activities. The topics discussed in this slide are Decrease Running Costs, Elevate Customer Experience, Enhance Brand Recognition. This is an instantly available PowerPoint presentation that can be edited conveniently. Download it right away and captivate your audience.
-
 Operational Improvement Process Dashboard For Continuous Monitoring
This slide illustrates KPI dashboard of operational improvement and includes metrics such as improving operational efficiency, streamlining quality, etc. Presenting our well structured Operational Improvement Process Dashboard For Continuous Monitoring The topics discussed in this slide are Increase Productivity, Reduce Operational Inefficiency, Streamlining Quality This is an instantly available PowerPoint presentation that can be edited conveniently. Download it right away and captivate your audience.
-
 Operation Reporting Dashboard Icon To Monitor Company Processes
Introducing our premium set of slides with name Operation Reporting Dashboard Icon To Monitor Company Processes. Ellicudate the three stages and present information using this PPT slide. This is a completely adaptable PowerPoint template design that can be used to interpret topics like Operation Reporting Dashboard, Monitor Company Processes. So download instantly and tailor it with your information.
-
 Download operational dashboard example of ppt
Presenting download operational dashboard example of ppt. This is a operational dashboard example of ppt. This is a four stage process. The stages in this process are business analysis, strategy development, planning and design, testing and support.
-
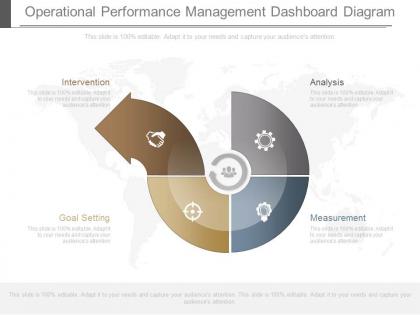 See operational performance management dashboard diagram
Presenting see operational performance management dashboard diagram. This is a operational performance management dashboard diagram. This is a four stage process. The stages in this process are intervention, analysis, goal setting, measurement.
-
 Integrated logistics management dashboard with perfect order rate and warehouse operating costs
Present the topic in a bit more detail with this Integrated Logistics Management Dashboard With Perfect Order Rate And Warehouse Operating Costs. Use it as a tool for discussion and navigation on Logistics, Management, Dashboard. This template is free to edit as deemed fit for your organization. Therefore download it now.
-
 Inventory kpis dashboard with customer retention and operating cost
Introducing our Inventory KPIS Dashboard With Customer Retention And Operating Cost set of slides. The topics discussed in these slides are Inventory KPIS Dashboard With Customer Retention And Operating Cost. This is an immediately available PowerPoint presentation that can be conveniently customized. Download it and convince your audience.
-
 Information Technology Dashboard To Monitor Performance Of Technical Operations
This slide shows information technology dashboard to monitor performance of technical operations which can be referred by IT heads to control the backend working of resources. It contains information such as status of tickets, classification, customer, service level agreement, response, etc. Presenting our well structured Information Technology Dashboard To Monitor Performance Of Technical Operations. The topics discussed in this slide are Service Level Agreement Breach, Satisfaction Rate, Customer Wise Tickets. This is an instantly available PowerPoint presentation that can be edited conveniently. Download it right away and captivate your audience.


