Powerpoint Templates and Google slides for Metrics And Dashboards
Save Your Time and attract your audience with our fully editable PPT Templates and Slides.
-
 Google SEO Analytics Major Metrics Traffic Bounce Rate Page Speed Landing Pages Custom Dashboards And More Edu Ppt
Presenting Google SEO Analytics Major Metrics, Traffic, Bounce Rate, Page Speed, Landing Pages, Custom Dashboards and more. Our PowerPoint experts have included all the necessary templates, designs, icons, graphs, and other essential material. This deck is well crafted by an extensive research. Slides consist of amazing visuals and appropriate content. These PPT slides can be instantly downloaded with just a click. Compatible with all screen types and monitors. Supports Google Slides. Premium Customer Support available. Suitable for use by managers, employees, and organizations. These slides are easily customizable. You can edit the color, text, icon, and font size to suit your requirements.
-
 Key Metrics Dashboard To Track And Analyse Hiring Optimizing HR Operations Through
Following slide represents dashboard that helps to analyse recruitment funnel to track employee staffing process. It includes metrics such as time to hire, time to fill, recruitment costs, age of applicants etc.Present the topic in a bit more detail with this Key Metrics Dashboard To Track And Analyse Hiring Optimizing HR Operations Through. Use it as a tool for discussion and navigation on Operational Dashboard, Through Stages, Female Ratio. This template is free to edit as deemed fit for your organization. Therefore download it now.
-
 Dashboards To Track Diversity And Inclusion Metrics Managing Diversity And Inclusion
The performance tracker includes parameters to check diversion and inclusion through gender distribution ratio, hires by gender percentage, turnover by gender, ethnicity distribution etc. Deliver an outstanding presentation on the topic using this Dashboards To Track Diversity And Inclusion Metrics Managing Diversity And Inclusion. Dispense information and present a thorough explanation of Gender Distribution, Hires By Gender using the slides given. This template can be altered and personalized to fit your needs. It is also available for immediate download. So grab it now.
-
 Streamlining Hiring Process Key Metrics Dashboard To Track And Analyse Hiring Process
Following slide represents dashboard that helps to analyse recruitment funnel to track employee staffing process. It includes metrics such as time to hire, time to fill, recruitment costs, age of applicants etc. Present the topic in a bit more detail with this Streamlining Hiring Process Key Metrics Dashboard To Track And Analyse Hiring Process. Use it as a tool for discussion and navigation on Time To Hire Days, Age Of Applicants. This template is free to edit as deemed fit for your organization. Therefore download it now.
-
 Key Metrics Dashboard To Track And Analyse Hiring Process Recruitment Technology
Following slide represents dashboard that helps to analyse recruitment funnel to track employee staffing process. It includes metrics such as time to hire, time to fill, recruitment costs, age of applicants etc. Deliver an outstanding presentation on the topic using this Key Metrics Dashboard To Track And Analyse Hiring Process Recruitment Technology. Dispense information and present a thorough explanation of Operational Dashboard, Recruitment Funnel using the slides given. This template can be altered and personalized to fit your needs. It is also available for immediate download. So grab it now.
-
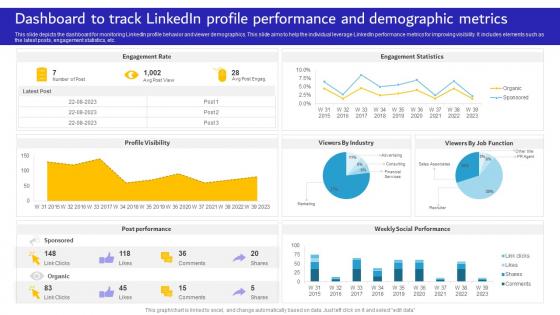 Dashboard To Track Linkedin Profile Performance And Demographic Metrics
This slide depicts the dashboard for monitoring LinkedIn profile behavior and viewer demographics. This slide aims to help the individual leverage LinkedIn performance metrics for improving visibility. It includes elements such as the latest posts, engagement statistics, etc. Presenting our well structured Dashboard To Track Linkedin Profile Performance And Demographic Metrics. The topics discussed in this slide are Engagement Rate, Engagement Statistics, Profile Visibility. This is an instantly available PowerPoint presentation that can be edited conveniently. Download it right away and captivate your audience.
-
 Key Metrics Dashboard To Track And Analyse Hiring Recruitment Strategies For Organizational
Following slide represents dashboard that helps to analyse recruitment funnel to track employee staffing process. It includes metrics such as time to hire, time to fill, recruitment costs, age of applicants etc. Deliver an outstanding presentation on the topic using this Key Metrics Dashboard To Track And Analyse Hiring Recruitment Strategies For Organizational. Dispense information and present a thorough explanation of Female Ratio, Age Of Applicants using the slides given. This template can be altered and personalized to fit your needs. It is also available for immediate download. So grab it now.
-
 Key Metrics Dashboard To Track And Analyse Hiring Enhancing Organizational Hiring
Following slide represents dashboard that helps to analyse recruitment funnel to track employee staffing process. It includes metrics such as time to hire, time to fill, recruitment costs, age of applicants etc.Present the topic in a bit more detail with this Key Metrics Dashboard To Track And Analyse Hiring Enhancing Organizational Hiring. Use it as a tool for discussion and navigation on Business Development, Rapid Process, Executive Hires. This template is free to edit as deemed fit for your organization. Therefore download it now.
-
 Transforming From Traditional Dashboard Analytics Measuring Impact On User Metrics And Revenue DT SS
This slide analyzes the impact od digital business model innovation on user metrics and recurring revenue of business. It tracks KPIs such as monthly recurring revenue, revenue growth, active users, life time value, cost of customer acquisition, churn rate, growth by channel, subscription plan, etc. Present the topic in a bit more detail with this Transforming From Traditional Dashboard Analytics Measuring Impact On User Metrics And Revenue DT SS Use it as a tool for discussion and navigation on Monthly Recurring Revenue, Monthly Revenue Growth, Active Users This template is free to edit as deemed fit for your organization. Therefore download it now.
-
 Key Metrics Dashboard To Track And Implementing Digital Technology In Corporate
Following slide represents dashboard that helps to analyse recruitment funnel to track employee staffing process. It includes metrics such as time to hire, time to fill, recruitment costs, age of applicants etc. Deliver an outstanding presentation on the topic using this Key Metrics Dashboard To Track And Implementing Digital Technology In Corporate. Dispense information and present a thorough explanation of Process, Analyse, Track using the slides given. This template can be altered and personalized to fit your needs. It is also available for immediate download. So grab it now.
-
 Fulfillment Center Optimization Dashboard Tracking Warehouse Capacity And Utilization Metrics
This slide represents a dashboard providing an enterprise-level view of warehouse capacity and utilization to enable process improvements. It monitors KPIs such as shelf capacity used by inventory type, storage device, honeycomb percentage, days on hand by inventory type, and by items. Deliver an outstanding presentation on the topic using this Fulfillment Center Optimization Dashboard Tracking Warehouse Capacity And Utilization Metrics Dispense information and present a thorough explanation of Inventory Type, Shelf Capacity, Storage Device using the slides given. This template can be altered and personalized to fit your needs. It is also available for immediate download. So grab it now.
-
 Health And Safety Metrics Performance Training Dashboard
This slide demonstrates KPI dashboard of health and safety metrics performance training and includes incidents, risk assessment, completion rate, etc. Introducing our Health And Safety Metrics Performance Training Dashboard set of slides. The topics discussed in these slides are Health And Safety Metrics, Performance Training Dashboard This is an immediately available PowerPoint presentation that can be conveniently customized. Download it and convince your audience.
-
 Organizational Diversity And Inclusion Key Metrics Dashboard Navigating Cultural Change CM SS V
This slide represents dashboard showing diversity and inclusion in organization and its impact on organizational objectives. It includes details related to KPIs such as turnover rates, hiring rates etc. Present the topic in a bit more detail with this Organizational Diversity And Inclusion Key Metrics Dashboard Navigating Cultural Change CM SS V Use it as a tool for discussion and navigation on Company, Inclusion Survey, Metrics Dashboard This template is free to edit as deemed fit for your organization. Therefore download it now.
-
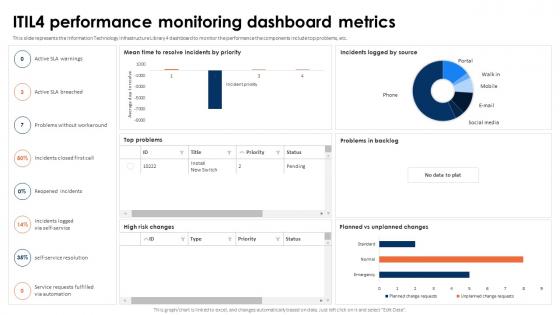 ITIL 4 Framework And Best Practices ITIL4 Performance Monitoring Dashboard Metrics
This slide represents the Information Technology Infrastructure Library 4 dashboard to monitor the performance the components include top problems, etc. Present the topic in a bit more detail with this ITIL 4 Framework And Best Practices ITIL4 Performance Monitoring Dashboard Metrics. Use it as a tool for discussion and navigation on Performance Monitoring, Dashboard Metrics, Technology Infrastructure. This template is free to edit as deemed fit for your organization. Therefore download it now.
-
 Metric Dashboard To Track Product Success Implementing Product And Market Development Strategy SS
This slide represents dashboard for tracking product success. It covers new customer, total sessions, purchase, total inquires, total crashes etc. Deliver an outstanding presentation on the topic using this Metric Dashboard To Track Product Success Implementing Product And Market Development Strategy SS Dispense information and present a thorough explanation of Metric Dashboard, Track Product Success using the slides given. This template can be altered and personalized to fit your needs. It is also available for immediate download. So grab it now.
-
 Change Resistance Metrics Dashboard For Addressing And Managing Resistance To Change CM SS
This slide introduces a change adoption metrics dashboard. The purpose is to provide a visual representation of key metrics related to change adoption, allowing leaders to track progress, identify areas of resistance, and make informed decisions to enhance the successful implementation of organizational changes. Present the topic in a bit more detail with this Change Resistance Metrics Dashboard For Addressing And Managing Resistance To Change CM SS Use it as a tool for discussion and navigation on My Overall Proficiency Is Great, Overall Adoption Score This template is free to edit as deemed fit for your organization. Therefore download it now.
-
 Health and safety kpi metrics dashboard
Presenting our well structured Health And Safety KPI Metrics Dashboard. The topics discussed in this slide are Health And Safety KPI Metrics Dashboard. This is an instantly available PowerPoint presentation that can be edited conveniently. Download it right away and captivate your audience.
-
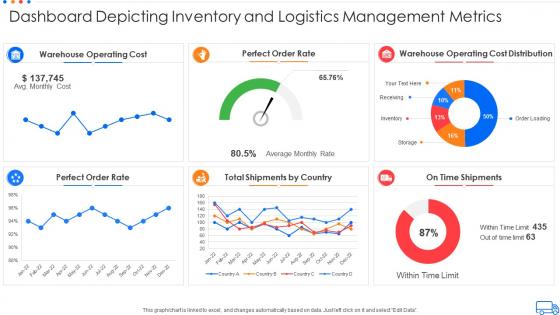 Dashboard depicting inventory and logistics management metrics
Introducing our Dashboard Depicting Inventory And Logistics Management Metrics set of slides. The topics discussed in these slides are Dashboard Depicting Inventory And Logistics Management Metrics. This is an immediately available PowerPoint presentation that can be conveniently customized. Download it and convince your audience.
-
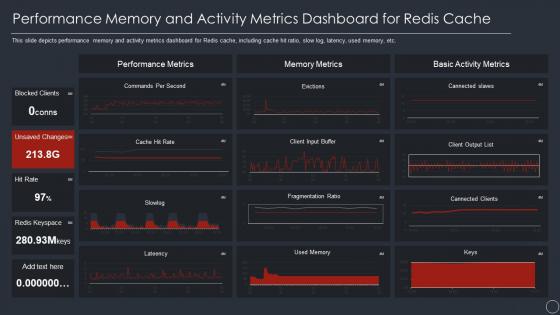 Performance memory and activity metrics dashboard for redis cache ppt gallery guidelines
This slide depicts performance memory and activity metrics dashboard for Redis cache, including cache hit ratio, slow log, latency, used memory, etc. Present the topic in a bit more detail with this Performance Memory And Activity Metrics Dashboard For Redis Cache Ppt Gallery Guidelines. Use it as a tool for discussion and navigation on Performance Metrics, Memory Metrics, Basic Activity Metrics, Blocked Clients. This template is free to edit as deemed fit for your organization. Therefore download it now.
-
 Role of digital twin and iot dashboard depicting supply chain metrics
This slide depicts the dashboard that shows supply chain metrics that covers net sales, supply chain costs, average cash to cash cycle, carrying costs of inventory, etc. Present the topic in a bit more detail with this Role Of Digital Twin And Iot Dashboard Depicting Supply Chain Metrics. Use it as a tool for discussion and navigation on Dashboard Depicting Supply Chain Metrics. This template is free to edit as deemed fit for your organization. Therefore download it now.
-
 Devops KPI Metrics Dashboard With Deployment Status And Uptime
This slide covers about devops dashboard recording deployment status on daily basis with regional uptime according service level agreement. Introducing our Devops KPI Metrics Dashboard With Deployment Status And Uptime set of slides. The topics discussed in these slides are Devops KPI Metrics Dashboard with Deployment Status and Uptime. This is an immediately available PowerPoint presentation that can be conveniently customized. Download it and convince your audience.
-
 SaaS Metrics Dashboard Depicting Content Origin And Session Frequency
Introducing our SaaS Metrics Dashboard Depicting Content Origin And Session Frequency set of slides. The topics discussed in these slides are Session Duration, Content Origin, Session Frequency. This is an immediately available PowerPoint presentation that can be conveniently customized. Download it and convince your audience.
-
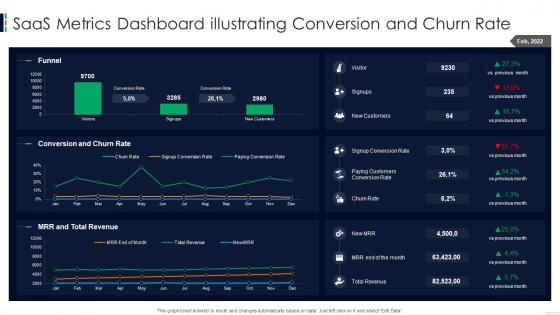 SaaS Metrics Dashboard Illustrating Conversion And Churn Rate
Presenting our well structured SaaS Metrics Dashboard Illustrating Conversion And Churn Rate. The topics discussed in this slide are Conversion And Churn Rate, Funnel, Mrr And Total Revenue. This is an instantly available PowerPoint presentation that can be edited conveniently. Download it right away and captivate your audience.
-
 SaaS Metrics Dashboard Indicating Net Cashflow And MRR
Presenting our well structured SaaS Metrics Dashboard Indicating Net Cashflow And MRR. The topics discussed in this slide are Customers, Net Cash Flow, Annual Run Rate. This is an instantly available PowerPoint presentation that can be edited conveniently. Download it right away and captivate your audience.
-
 SaaS Metrics Dashboard Indicating Visitors And New Signups
Presenting our well structured SaaS Metrics Dashboard Indicating Visitors And New Signups. The topics discussed in this slide are Visitors And New Signups, Signups End Of Month, Signup Organic And Paid. This is an instantly available PowerPoint presentation that can be edited conveniently. Download it right away and captivate your audience.
-
 Reducing Cost Of Operations Through Iot And Dashboard Depicting Supply Chain Metrics
This slide depicts the dashboard that shows supply chain metrics that covers net sales, supply chain costs, average cash-to-cash cycle, carrying costs of inventory, etc. Deliver an outstanding presentation on the topic using this Reducing Cost Of Operations Through Iot And Dashboard Depicting Supply Chain Metrics. Dispense information and present a thorough explanation of Dashboard Depicting Supply Chain Metrics using the slides given. This template can be altered and personalized to fit your needs. It is also available for immediate download. So grab it now.
-
 Metric Dashboard To Measure Product Performance Product Development And Management Strategy
This slide represents KPI dashboard for measuring product performance. It covers total activities, new customers, events, net promoter score etc. Present the topic in a bit more detail with this Metric Dashboard To Measure Product Performance Product Development And Management Strategy. Use it as a tool for discussion and navigation on Measure, Product, Performance. This template is free to edit as deemed fit for your organization. Therefore download it now.
-
 Product Development And Management Strategy Metric Dashboard To Track Product Success
This slide represents dashboard for tracking product success. It covers new customer, total sessions, purchase, total inquires, total crashes etc. Deliver an outstanding presentation on the topic using this Product Development And Management Strategy Metric Dashboard To Track Product Success. Dispense information and present a thorough explanation of Dashboard, Product, Success using the slides given. This template can be altered and personalized to fit your needs. It is also available for immediate download. So grab it now.
-
 Offline And Online Merchandising KPI Metrics Dashboard To Measure Online Merchandising
The following slide outlines a performance key performance indicator KPI dashboard used to evaluate the effectiveness of in-store merchandising strategy. The kpis covered in the slide are total sales, average inventory, active stores, distinct products sold, etc. Deliver an outstanding presentation on the topic using this Offline And Online Merchandising KPI Metrics Dashboard To Measure Online Merchandising. Dispense information and present a thorough explanation of Distinct Products Sold, Average Selling Price, Products using the slides given. This template can be altered and personalized to fit your needs. It is also available for immediate download. So grab it now.
-
 Metric Dashboard For Tracking Assets And Equipments Implementing Fixed Asset Management
This slide represents fixed asset dashboard for asset tracking. It highlights active assets, processors, operating system, devices etc. Present the topic in a bit more detail with this Metric Dashboard For Tracking Assets And Equipments Implementing Fixed Asset Management. Use it as a tool for discussion and navigation on Operating Systems, Processors, Manufactures Models. This template is free to edit as deemed fit for your organization. Therefore download it now.
-
 Metric Dashboard For Tracking Assets And Equipments Executing Fixed Asset Tracking System Inventory
This slide represents fixed asset dashboard for asset tracking. It highlights active assets, processors, operating system, devices etc. Deliver an outstanding presentation on the topic using this Metric Dashboard For Tracking Assets And Equipments Executing Fixed Asset Tracking System Inventory. Dispense information and present a thorough explanation of Equipments, Dashboard, Processors using the slides given. This template can be altered and personalized to fit your needs. It is also available for immediate download. So grab it now.
-
 Metric Dashboard For Tracking Assets And Equipments Deploying Fixed Asset Management Framework
This slide represents fixed asset dashboard for asset tracking. It highlights active assets, processors, operating system, devices etc. Deliver an outstanding presentation on the topic using this Metric Dashboard For Tracking Assets And Equipments Deploying Fixed Asset Management Framework. Dispense information and present a thorough explanation of Equipments, Dashboard, Processors using the slides given. This template can be altered and personalized to fit your needs. It is also available for immediate download. So grab it now.
-
 Content Marketing Freelance Metrics Dashboard With Content Visit And Reach
The following slide highlights the content marketing freelance metrics dashboard with content visit and reach. It illustrates content visits, content reach, content summary, click actions, marketing summary, recent posts, likes, followers by gender and followers by country Introducing our Content Marketing Freelance Metrics Dashboard With Content Visit And Reach set of slides. The topics discussed in these slides are Content Marketing Freelance, Metrics Dashboard, Content Visit Reach. This is an immediately available PowerPoint presentation that can be conveniently customized. Download it and convince your audience.
-
 Financial Key Metrics Dashboard Snapshot And Vendor Payment Projections
This slide displays the dashboard snapshot with the financial key performance indicators of an organisation. It includes current assets and liabilities, cash conversion cycle, vendor payments projections, etc. Presenting our well structured Financial Key Metrics Dashboard And Vendor Payment Projections. The topics discussed in this slide are Current Working Capital, Vendor Payments, Cash Conversion Cycle. This is an instantly available PowerPoint presentation that can be edited conveniently. Download it right away and captivate your audience.
-
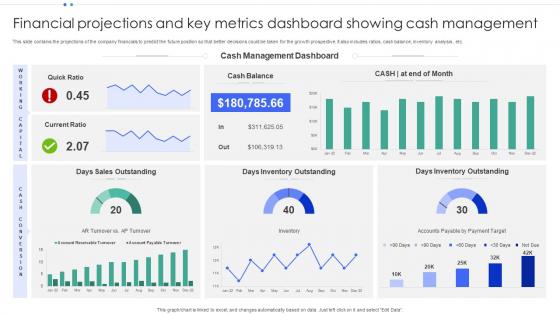 Financial Projections And Key Metrics Dashboard Showing Cash Management
This slide contains the projections of the company financials to predict the future position so that better decisions could be taken for the growth prospective. It also includes ratios, cash balance, inventory analysis , etc. Introducing our Financial Projections And Key Metrics Dashboard Showing Cash Management set of slides. The topics discussed in these slides are Cash Management Dashboard, Days Inventory Outstanding, Days Sales Outstanding. This is an immediately available PowerPoint presentation that can be conveniently customized. Download it and convince your audience.
-
 Financial Projections And Key Metrics Dashboard
This slide elaborates about the multiple sources through which one can project about the growth and current status of the company. It includes lead conversion rate, monthly revenue , short term assets , net and gross profit margins, etc. Presenting our well structured Financial Projections And Key Metrics Dashboard. The topics discussed in this slide are Gross Profit Margin, Net Profit Margin, Current Ratio. This is an instantly available PowerPoint presentation that can be edited conveniently. Download it right away and captivate your audience.
-
 Innovation Dashboard Snapshot With Key Metrics And Status
Presenting our well-structured Innovation Dashboard Snapshot With Key Metrics And Status. The topics discussed in this slide are Innovation Fund, Idea Survival Rate. This is an instantly available PowerPoint presentation that can be edited conveniently. Download it right away and captivate your audience.
-
 Packing And Shipping Dashboard With Monthly Key Performance Metrics
The following slide showcases dashboard of supply chain with order status key metrics. Main KPIs covered are volume today, global financial performance and inventory. Introducing our Packing And Shipping Dashboard With Monthly Key Performance Metrics set of slides. The topics discussed in these slides are Volume Today, Global Financial Performance, Inventory Distribution. This is an immediately available PowerPoint presentation that can be conveniently customized. Download it and convince your audience.
-
 F461 Portfolio Investment Management Metric Dashboard Portfolio Investment Management And Growth
This slide represents portfolio investment management dashboard. It includes total invested amount, total number of investments made and rate of return. Deliver an outstanding presentation on the topic using this F461 Portfolio Investment Management Metric Dashboard Portfolio Investment Management And Growth. Dispense information and present a thorough explanation of Portfolio, Investment, Management using the slides given. This template can be altered and personalized to fit your needs. It is also available for immediate download. So grab it now.
-
 Metric Dashboard For Portfolio Evaluation And Portfolio Investment Management And Growth
This slide represents metric dashboard for portfolio evaluation and performance monitoring. It covers project completion, top project risk, portfolio completion etc. Present the topic in a bit more detail with this Metric Dashboard For Portfolio Evaluation And Portfolio Investment Management And Growth. Use it as a tool for discussion and navigation on Performance, Dashboard, Portfolio. This template is free to edit as deemed fit for your organization. Therefore download it now.
-
 Metric Dashboard For Tracking Assets And Equipments Management Of Fixed Asset
This slide represents fixed asset dashboard for asset tracking. It highlights active assets, processors, operating system, devices etc. Deliver an outstanding presentation on the topic using this Metric Dashboard For Tracking Assets And Equipments Management Of Fixed Asset. Dispense information and present a thorough explanation of Devices, Operating Systems, Manufactures Models, Processors using the slides given. This template can be altered and personalized to fit your needs. It is also available for immediate download. So grab it now.
-
 Dashboard For Monthly Recruitment Metrics And Analytics
The slide depicts the dashboard for monthly recruitment metrics and analytics depicting monthly recruitment, recruitment by department and source, candidate feedback and offer acceptance rate. Introducing our Dashboard For Monthly Recruitment Metrics And Analytics set of slides. The topics discussed in these slides are Interview Activity, Monthly Recruitment, Offer Acceptance Rate. This is an immediately available PowerPoint presentation that can be conveniently customized. Download it and convince your audience.
-
 Dashboard Snapshot Of Recruitment Funnel And Key Metrics
The slide highlights the dashboard snapshot of recruitment funnel and key metrics illustrating recruitment source, department, job level, key metrics, recruitment funnel, number of days per stage, gender ratio and age of applicants. Presenting our well structured Dashboard Of Recruitment Funnel And Key Metrics. The topics discussed in this slide are Recruitment Funnel, Male Female Ratio, Recruitment Dashboard. This is an instantly available PowerPoint presentation that can be edited conveniently. Download it right away and captivate your audience.
-
 Metric Dashboard For Portfolio Evaluation And Performance Monitoring Asset Portfolio Growth
This slide represents metric dashboard for portfolio evaluation and performance monitoring. It covers project completion, top project risk, portfolio completion etc. Present the topic in a bit more detail with this Metric Dashboard For Portfolio Evaluation And Performance Monitoring Asset Portfolio Growth. Use it as a tool for discussion and navigation on Metric Dashboard For Portfolio, Evaluation And Performance Monitoring. This template is free to edit as deemed fit for your organization. Therefore download it now.
-
 BPA Tools For Process Improvement And Cost Reduction KPI Metrics Dashboard To Measure Automation
The following slide outlines a comprehensive KPI dashboard which can be used by the organization to measure the automation performance in customer support department. It covers kpis such as customer retention, costs per support, customer satisfaction, etc. Present the topic in a bit more detail with this BPA Tools For Process Improvement And Cost Reduction KPI Metrics Dashboard To Measure Automation. Use it as a tool for discussion and navigation on Request Answered 2022, Total Requests 2022, Total Revenue 2022. This template is free to edit as deemed fit for your organization. Therefore download it now.
-
 Ecommerce Website Dashboard With New Orders And Users Metrics
This slide showcases a dashboard for tracking e commerce website orders and users. This provides information such as new orders, total sales, total costs, new users, top-selling products, etc. Introducing our Ecommerce Website Dashboard With New Orders And Users Metrics set of slides. The topics discussed in these slides are Ecommerce Website Dashboard, New Orders, Users Metrics. This is an immediately available PowerPoint presentation that can be conveniently customized. Download it and convince your audience.
-
 Key Business Metrics Dashboard Business Process Management And Optimization Playbook
The following dashboard displays the key business metrics such as new customers, profit, revenue per customer, and weekly revenue. Present the topic in a bit more detail with this Key Business Metrics Dashboard Business Process Management And Optimization Playbook. Use it as a tool for discussion and navigation on Average Revenue, Key Business, Metrics Dashboard. This template is free to edit as deemed fit for your organization. Therefore download it now.
-
 KPI Metrics Dashboard To Monitor Mobile SEO Guide Internal And External Measures To Optimize
The purpose of this slide is to outline key performance indicator KPI dashboard which will assist the marketer to analyze mobile search engine optimization SEO performance. The key metrics mentioned in the slide are total sessions, search engine rankings etc. Present the topic in a bit more detail with this KPI Metrics Dashboard To Monitor Mobile SEO Guide Internal And External Measures To Optimize. Use it as a tool for discussion and navigation on KPI Metrics, Dashboard Monitor, Mobile SEO Performance. This template is free to edit as deemed fit for your organization. Therefore download it now.
-
 OPEX Dashboard Indicating Revenue And Costs Metrics
This slide shows operating expenses OPEX dashboard indicating revenue and costs metrics which can be referred by companies to manage various operating expenses of various departments. It contains information about cost center, revenue per company, company code, etc. Presenting our well-structured OPEX Dashboard Indicating Revenue And Costs Metrics. The topics discussed in this slide are OPEX Dashboard, Indicating Revenue, Costs Metrics. This is an instantly available PowerPoint presentation that can be edited conveniently. Download it right away and captivate your audience.
-
 Dashboard Snapshot For Risk Communication Planning And Key Metrics Tracking
This slide shows dashboard snapshot for planning risk communication and tracking key metrics which includes heat map of risk, classification, objectives, effectiveness, critical risks, etc. Presenting our well-structured Dashboard For Risk Communication Planning And Key Metrics Tracking. The topics discussed in this slide are Classification Risks, Tactical Objectives, Controls Effectiveness. This is an instantly available PowerPoint presentation that can be edited conveniently. Download it right away and captivate your audience.
-
 Metric Dashboard For Portfolio Evaluation And Performance Portfolio Growth And Return Management
This slide represents metric dashboard for portfolio evaluation and performance monitoring. It covers project completion, top project risk, portfolio completion etc. Deliver an outstanding presentation on the topic using this Metric Dashboard For Portfolio Evaluation And Performance Portfolio Growth And Return Management. Dispense information and present a thorough explanation of Performance, Monitoring, Portfolio using the slides given. This template can be altered and personalized to fit your needs. It is also available for immediate download. So grab it now.
-
 Portfolio Investment Management Metric Dashboard Portfolio Growth And Return Management
This slide represents portfolio investment management dashboard. It includes total invested amount, total number of investments made and rate of return. Present the topic in a bit more detail with this Portfolio Investment Management Metric Dashboard Portfolio Growth And Return Management. Use it as a tool for discussion and navigation on Portfolio, Investment, Management. This template is free to edit as deemed fit for your organization. Therefore download it now.
-
 Key Business Metrics Dashboard Blueprint To Optimize Business Operations And Increase Revenues
The following dashboard displays the key business metrics such as new customers, profit, revenue per customer, and weekly revenue. Deliver an outstanding presentation on the topic using this Key Business Metrics Dashboard Blueprint To Optimize Business Operations And Increase Revenues. Dispense information and present a thorough explanation of Business, Dashboard, Revenue using the slides given. This template can be altered and personalized to fit your needs. It is also available for immediate download. So grab it now.
-
 Sales Tracking Dashboard With Revenue And Cost Metric
This slide illustrates sales revenue and costs tracking dashboard. It provides information about sales count, profit, expenses, sales revenue, expenses breakdown, up or cross selling, etc. Presenting our well-structured Sales Tracking Dashboard With Revenue And Cost Metric. The topics discussed in this slide are Revenue, Sales Count, Profit, Expenses. This is an instantly available PowerPoint presentation that can be edited conveniently. Download it right away and captivate your audience.
-
 Financial Investment Portfolio Management Metric Dashboard For Portfolio Evaluation And Performance Monitoring
This slide represents metric dashboard for portfolio evaluation and performance monitoring. It covers project completion, top project risk, portfolio completion etc. Present the topic in a bit more detail with this Financial Investment Portfolio Management Metric Dashboard For Portfolio Evaluation And Performance Monitoring. Use it as a tool for discussion and navigation on Dashboard, Portfolio, Evaluation. This template is free to edit as deemed fit for your organization. Therefore download it now.
-
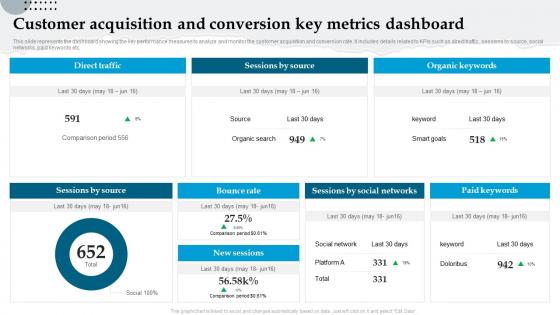 Analyzing And Implementing Management System Customer Acquisition And Conversion Key Metrics Dashboard
This slide represents the dashboard showing the key performance measures to analyze and monitor the customer acquisition and conversion rate. It includes details related to KPIs such as direct traffic, sessions by source, social networks, paid keywords etc. Present the topic in a bit more detail with this Analyzing And Implementing Management System Customer Acquisition And Conversion Key Metrics Dashboard. Use it as a tool for discussion and navigation on Customer, Acquisition, Dashboard . This template is free to edit as deemed fit for your organization. Therefore download it now.
-
 KPI Metrics Dashboard Highlighting Profitability And Liquidity Ultimate Guide To Financial Planning
The following slide outlines key performance indicator KPI dashboard showcasing various financial metrics of the organization. The key metrics are gross revenue, product revenue, service revenue, gross profit, net profit etc. Present the topic in a bit more detail with this KPI Metrics Dashboard Highlighting Profitability And Liquidity Ultimate Guide To Financial Planning. Use it as a tool for discussion and navigation on Gross Revenue, Gross Profit, Product Revenue. This template is free to edit as deemed fit for your organization. Therefore download it now.
-
 Health And Safety Metrics Dashboard Showing Total Incidents
This slide shows dashboard representing health and safety key performance indicators of an organization. It includes details related to serious incidents, lost time incidents, reported injuries, total incidents, most at risk employee types etc. Introducing our Health And Safety Metrics Dashboard Showing Total Incidents set of slides. The topics discussed in these slides are Health And Safety, Metrics Dashboard, Total Incidents. This is an immediately available PowerPoint presentation that can be conveniently customized. Download it and convince your audience.
-
 Organizational Health And Safety Measurement Dashboard With Key Metrics
This slide shows the dashboard representing information related to measurement of safety and health performance of an organization. It includes details related to incidents and injuries etc. Introducing our Organizational Health And Safety Measurement Dashboard With Key Metrics set of slides. The topics discussed in these slides are Organizational Health, Safety Measurement, Dashboard. This is an immediately available PowerPoint presentation that can be conveniently customized. Download it and convince your audience.
-
 Organizations Safety And Incident Management Dashboard With Key Metrics
This slide represents dashboard showing safety and incident management performance of an organization. It shows details related to total case incident rate, days since reported by hazard type, deficiencies by number of items reviewed, sum of corrective actions by company etc. Introducing our Organizations Safety And Incident Management Dashboard With Key Metrics set of slides. The topics discussed in these slides are Employee Injuries, Incident Analysis, Observations. This is an immediately available PowerPoint presentation that can be conveniently customized. Download it and convince your audience.


