Powerpoint Templates and Google slides for Measure
Save Your Time and attract your audience with our fully editable PPT Templates and Slides.
-
 Average cost of automated measured reported improved kpis ppt slide
Presenting average cost of automated measured reported improved kpis ppt slide. This presentation slide shows three Key Performance Indicators or KPIs in a Dashboard style design. The first KPI that can be shown is Average Cost of Automated Measurement Per KPI. The second KPI is percentage of KPIs Reported According to Approved Plan and the third is percentage of KPIs That are Improved. These KPI Powerpoint graphics are all data driven, and the shape automatically adjusts according to your data. Just right click on the KPI graphic, enter the right value and the shape will adjust automatically. Make a visual impact with our KPI slides.
-
 Kpi for benchmarking manual automated measurement cost presentation slide
Presenting kpi for benchmarking manual automated measurement cost presentation slide. This presentation slide shows three Key Performance Indicators or KPIs in a Dashboard style design. The first KPI that can be shown is Cost of KPI Benchmarking. The second KPI is Cost of Manual KPI Measurement and the third is Cost of Automated Measurement of KPIs. These KPI Powerpoint graphics are all data driven, and the shape automatically adjusts according to your data. Just right click on the KPI graphic, enter the right value and the shape will adjust automatically. Make a visual impact with our KPI slides.
-
 Kpi for ratio cost between automated and manual measurement updates time presentation slide
Presenting kpi for ratio cost between automated and manual measurement updates time presentation slide. This presentation slide shows three Key Performance Indicators or KPIs in a Dashboard style design. The first KPI that can be shown is Ratio Between Cost of Automated and Manual KPI Measurement. The second KPI is Average Time Between Updates of KPIs and the third is Average Cost of Manual Measurement Per KPI. These KPI Powerpoint graphics are all data driven, and the shape automatically adjusts according to your data. Just right click on the KPI graphic, enter the right value and the shape will adjust automatically. Make a visual impact with our KPI slides.
-
 Manually measured compared against benchmarks benchmarking cost per kpi ppt slide
Presenting manually measured compared against benchmarks benchmarking cost per kpi ppt slide. This presentation slide shows three Key Performance Indicators or KPIs in a Dashboard style design. The first KPI that can be shown is percentage of KPIs That are Manually Measured. The second KPI is percentage of KPIs Compared Against Benchmarks and the third is Average Cost of Benchmarking Per KPI. These KPI Powerpoint graphics are all data driven, and the shape automatically adjusts according to your data. Just right click on the KPI graphic, enter the right value and the shape will adjust automatically. Make a visual impact with our KPI slides.
-
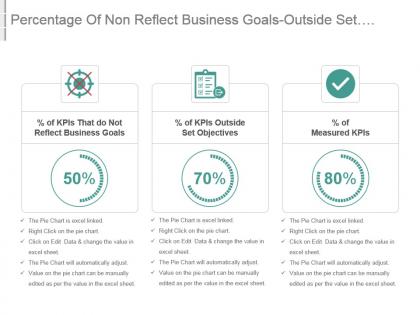 Percentage of non reflect business goals outside set objectives measured kpis ppt slide
Presenting percentage of non reflect business goals outside set objectives measured kpis ppt slide. This presentation slide shows three Key Performance Indicators or KPIs in a Dashboard style design. The first KPI that can be shown is percentage of KPIs That do Not Reflect Business Goals. The second KPI is percentage of KPIs Outside Set Objectives and the third is percentage of Measured KPIs. These KPI Powerpoint graphics are all data driven, and the shape automatically adjusts according to your data. Just right click on the KPI graphic, enter the right value and the shape will adjust automatically. Make a visual impact with our KPI slides.
-
 Percentage of set objectives measurement cost automatically measured kpis powerpoint slide
Presenting percentage of set objectives measurement cost automatically measured kpis powerpoint slide. This presentation slide shows three Key Performance Indicators or KPIs in a Dashboard style design. The first KPI that can be shown is percentage of KPIs Within Set Objectives. The second KPI is Cost of KPI Measurement and the third is percentage of KPIs That are Automatically Measured. These KPI Powerpoint graphics are all data driven, and the shape automatically adjusts according to your data. Just right click on the KPI graphic, enter the right value and the shape will adjust automatically. Make a visual impact with our KPI slides.
-
 Update time between automated and manual measurement kpis data collection sources presentation slide
Presenting update time between automated and manual measurement kpis data collection sources presentation slide. This presentation slide shows three Key Performance Indicators or KPIs in a Dashboard style design. The first KPI that can be shown is Average Time Between Updates of KPIs with Automated Measurement. The second KPI is Average Time Between Updates of KPIs with Manual Measurement and the third is Number of Sources used for Data Collection. These KPI Powerpoint graphics are all data driven, and the shape automatically adjusts according to your data. Just right click on the KPI graphic, enter the right value and the shape will adjust automatically. Make a visual impact with our KPI slides.
-
 Business highlights of financial measures of year over year
Presenting this set of slides with name - Business Highlights Of Financial Measures Of Year Over Year. This is a three stage process. The stages in this process are Business Highlights, Company Highlights, Business Key Points.
-
 Business highlights showing liabilities measures of year over year
Presenting this set of slides with name - Business Highlights Showing Liabilities Measures Of Year Over Year. This is a five stage process. The stages in this process are Business Highlights, Company Highlights, Business Key Points.
-
 Magnitude of dimension for size measurement by ruler or tape measure
Presenting this set of slides with name - Magnitude Of Dimension For Size Measurement By Ruler Or Tape Measure. This is a three stage process. The stages in this process are Size, Dimensions, Measurements.
-
 Measure level tool for size measurement showing man working on project
Presenting this set of slides with name - Measure Level Tool For Size Measurement Showing Man Working On Project. This is a three stage process. The stages in this process are Size, Dimensions, Measurements.
-
 Measuring size with the help of ruler or scale showing magnitude of dimension
Presenting this set of slides with name - Measuring Size With The Help Of Ruler Or Scale Showing Magnitude Of Dimension. This is a four stage process. The stages in this process are Size, Dimensions, Measurements.
-
 Measuring tape for size dimension magnitude
Presenting this set of slides with name - Measuring Tape For Size Dimension Magnitude. This is a three stage process. The stages in this process are Size, Dimensions, Measurements.
-
 Size measurement showing different categories as small medium and large
Presenting this set of slides with name - Size Measurement Showing Different Categories As Small Medium And Large. This is a four stage process. The stages in this process are Size, Dimensions, Measurements.
-
 Small medium and large size showing different categories of measurement
Presenting this set of slides with name - Small Medium And Large Size Showing Different Categories Of Measurement. This is a three stage process. The stages in this process are Size, Dimensions, Measurements.
-
 Project metric dashboard for tracking with measure status trend
Presenting this set of slides with name - Project Metric Dashboard For Tracking With Measure Status Trend. This is a two stage process. The stages in this process are Project Kpis, Project Dashboard, Project Metrics.
-
 List of measure of efficiency of contributors in organisation development in percent
Presenting this set of slides with name - List Of Measure Of Efficiency Of Contributors In Organisation Development In Percent. This is a five stage process. The stages in this process are Contributor, Writer, Reporter.
-
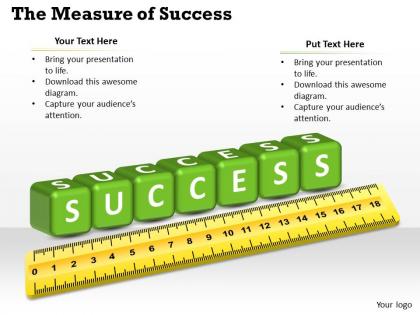 Measuring Success Powerpoint Template Slide
Bother free, easy and fast download. Completely modifiable text as per your need. Change the color scheme and contrast to suit the contextual requirement. Thoroughly editable orientation and size of PPT icons. Include your own company logo, tagline, watermark, trademark etc. to personalize. No alteration in original resolution of presentation images post editing. The stages in this process are success, growth.
-
 Quality dashboard with quality index by measures and quality index
Presenting this set of slides with name - Quality Dashboard With Quality Index By Measures And Quality Index. This is a three stage process. The stages in this process are Quality Dashboard, Quality Kpi, Quality Metircs.
-
 Employee performance levels measuring effectiveness analysis
Presenting this set of slides with name - Employee Performance Levels Measuring Effectiveness Analysis. This is a four stage process. The stages in this process are Employee Performance, Employee Engagement, Employee Evaluation.
-
 Contract management measuring the performance status of contract activities
Presenting this set of slides with name - Contract Management Measuring The Performance Status Of Contract Activities. This is a five stage process. The stages in this process are Contract Negotiation, Contract Management, Deal Making.
-
 Event based marketing customer data insight social influencer measures cpb
This is an editabletwo stages graphic that deals with topics like Event Based Marketing, Customer Data Insight, Social Influencer Measures to help convey your message better graphically. This product is a premium product available for immediate download, and is 100 percent editable in Powerpoint. Download this now and use it in your presentations to impress your audience.
-
 Supply chain risks employee selection criteria impact measurement cpb
Presenting this set of slides with name - Supply Chain Risks Employee Selection Criteria Impact Measurement Cpb. This is an editable three stages graphic that deals with topics like Supply Chain Risks, Employee Selection Criteria, Impact Measurement to help convey your message better graphically. This product is a premium product available for immediate download, and is 100 percent editable in Powerpoint. Download this now and use it in your presentations to impress your audience.
-
 Global mindset agenda template reputational risk business measurements cpb
Presenting this set of slides with name - Global Mindset Agenda Template Reputational Risk Business Measurements Cpb. This is an editable four stages graphic that deals with topics like Global Mindset, Agenda Template, Reputational Risk, Business Measurements to help convey your message better graphically. This product is a premium product available for immediate download,and is 100 percent editable in Powerpoint. Download this now and use it in your presentations to impress your audience.
-
 Product management employee engagement measure core values business cpb
Presenting this set of slides with name - Product Management Employee Engagement Measure Core Values Business Cpb. This is an editable six stages graphic that deals with topics like Product Management, Employee Engagement Measure, Core Values Business to help convey your message better graphically. This product is a premium product available for immediate download, and is 100 percent editable in Powerpoint. Download this now and use it in your presentations to impress your audience.
-
 Measuring forces ppt powerpoint presentation infographics templates cpb
Presenting this set of slides with name - Measuring Forces Ppt Powerpoint Presentation Infographics Templates Cpb. This is an editable three stages graphic that deals with topics like Measuring Forces to help convey your message better graphically. This product is a premium product available for immediate download, and is 100 percent editable in Powerpoint. Download this now and use it in your presentations to impress your audience.
-
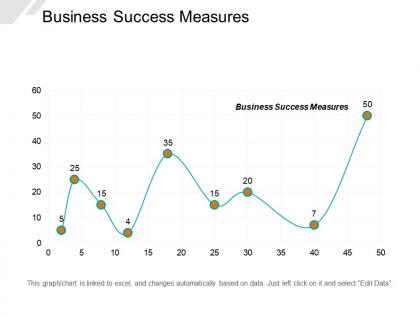 Business success measures ppt powerpoint presentation layouts layouts cpb
Presenting this set of slides with name - Business Success Measures Ppt Powerpoint Presentation Layouts Layouts Cpb. This is an editable one stages graphic that deals with topics like Business Success Measures to help convey your message better graphically. This product is a premium product available for immediate download, and is 100 percent editable in Powerpoint. Download this now and use it in your presentations to impress your audience.
-
 Performance management measure ppt powerpoint presentation layouts layout cpb
Presenting this set of slides with name - Performance Management Measure Ppt Powerpoint Presentation Layouts Layout Cpb. This is an editable three stages graphic that deals with topics like Performance Management Measure to help convey your message better graphically. This product is a premium product available for immediate download, and is 100 percent editable in Powerpoint. Download this now and use it in your presentations to impress your audience.
-
 Marketing performance analysis marketing performance measures reviews products cpb
Presenting this set of slides with name - Marketing Performance Analysis Marketing Performance Measures Reviews Products Cpb. This is an editable three stages graphic that deals with topics like Marketing Performance Analysis, Marketing Performance Measures, Reviews Products to help convey your message better graphically. This product is a premium product available for immediate download,and is 100 percent editable in Powerpoint. Download this now and use it in your presentations to impress your audience.
-
 Advertising measurement ppt powerpoint presentation diagram ppt cpb
Presenting this set of slides with name - Advertising Measurement Ppt Powerpoint Presentation Diagram Ppt Cpb. This is an editable five stages graphic that deals with topics like Advertising Measurement to help convey your message better graphically. This product is a premium product available for immediate download, and is 100 percent editable in Powerpoint. Download this now and use it in your presentations to impress your audience.
-
 Performance advertising measurement ppt powerpoint presentation file example introduction cpb
Presenting this set of slides with name - Performance Advertising Measurement Ppt Powerpoint Presentation File Example Introduction Cpb. This is an editable ten stages graphic that deals with topics like Performance Advertising Measurement to help convey your message better graphically. This product is a premium product available for immediate download, and is 100 percent editable in Powerpoint. Download this now and use it in your presentations to impress your audience.
-
 Sales measurement tools ppt powerpoint presentation gallery background image cpb
Presenting this set of slides with name - Sales Measurement Tools Ppt Powerpoint Presentation Gallery Background Image Cpb. This is an editable six stages graphic that deals with topics like Sales Measurement Tools to help convey your message better graphically. This product is a premium product available for immediate download, and is 100 percent editable in Powerpoint. Download this now and use it in your presentations to impress your audience.
-
 Key metrics measure ppt powerpoint presentation diagram templates cpb
Presenting this set of slides with name - Key Metrics Measure Ppt Powerpoint Presentation Diagram Templates Cpb. This is an editable three stages graphic that deals with topics like Key Metrics to help convey your message better graphically. This product is a premium product available for immediate download, and is 100 percent editable in Powerpoint. Download this now and use it in your presentations to impress your audience.
-
 Measures effectiveness ppt powerpoint presentation gallery skills cpb
Presenting this set of slides with name - Measures Effectiveness Ppt Powerpoint Presentation Gallery Skills Cpb. This is an editable seven stages graphic that deals with topics like Measures Effectiveness to help convey your message better graphically. This product is a premium product available for immediate download, and is 100 percent editable in Powerpoint. Download this now and use it in your presentations to impress your audience.
-
 Measuring benefits employee engagement ppt powerpoint presentation gallery professional cpb
Presenting this set of slides with name - Measuring Benefits Employee Engagement Ppt Powerpoint Presentation Gallery Professional Cpb. This is an editable three stages graphic that deals with topics like Measuring Benefits Employee Engagement to help convey your message better graphically. This product is a premium product available for immediate download, and is 100 percent editable in Powerpoint. Download this now and use it in your presentations to impress your audience.
-
 Measuring conversion ppt powerpoint presentation ideas designs download cpb
Presenting this set of slides with name - Measuring Conversion Ppt Powerpoint Presentation Ideas Designs Download Cpb. This is an editable three stages graphic that deals with topics like Measuring Conversion to help convey your message better graphically. This product is a premium product available for immediate download, and is 100 percent editable in Powerpoint. Download this now and use it in your presentations to impress your audience.
-
 Measures effectiveness ppt powerpoint presentation infographic template summary cpb
Presenting this set of slides with name - Measures Effectiveness Ppt Powerpoint Presentation Infographic Template Summary Cpb. This is an editable seven stages graphic that deals with topics like Measures Effectiveness to help convey your message better graphically. This product is a premium product available for immediate download, and is 100 percent editable in Powerpoint. Download this now and use it in your presentations to impress your audience.
-
 Measurement c suite ppt powerpoint presentation styles structure cpb
Presenting this set of slides with name - Measurement C Suite Ppt Powerpoint Presentation Styles Structure Cpb. This is an editable three stages graphic that deals with topics like Measurement C Suite to help convey your message better graphically. This product is a premium product available for immediate download, and is 100 percent editable in Powerpoint. Download this now and use it in your presentations to impress your audience.
-
 Different measuring parameters for quality improvement
Presenting this set of slides with name - Different Measuring Parameters For Quality Improvement. This is a four stage process. The stages in this process are Measuring Improvement, Product Innovation, Business.
-
 Key essentials for measuring improvement
Presenting this set of slides with name - Key Essentials For Measuring Improvement. This is a ten stage process. The stages in this process are Measuring Improvement, Product Innovation, Business.
-
 Measure blood pressure image
Presenting this set of slides with name - Measure Blood Pressure Image. This is a four stage process. The stages in this process are Measure, Marketing, Measurement.
-
 Measure liquid in the lab
Presenting this set of slides with name - Measure Liquid In The Lab. This is a three stage process. The stages in this process are Measure, Marketing, Measurement.
-
 Measure tape for cloths image
Presenting this set of slides with name - Measure Tape For Cloths Image. This is a three stage process. The stages in this process are Measure, Marketing, Measurement.
-
 Weight measure by weighing machine image
Presenting this set of slides with name - Weight Measure By Weighing Machine Image. This is a four stage process. The stages in this process are Measure, Marketing, Measurement.
-
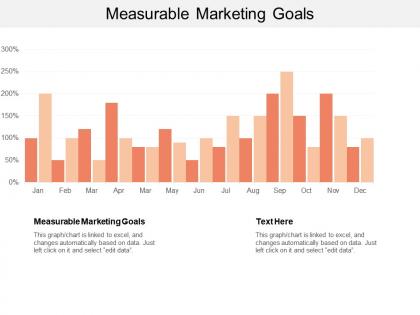 Measurable marketing goals ppt powerpoint presentation outline layout ideas cpb
Presenting this set of slides with name - Measurable Marketing Goals Ppt Powerpoint Presentation Outline Layout Ideas Cpb. This is an editable two stages graphic that deals with topics like Measurable Marketing Goals to help convey your message better graphically. This product is a premium product available for immediate download, and is 100 percent editable in Powerpoint. Download this now and use it in your presentations to impress your audience.
-
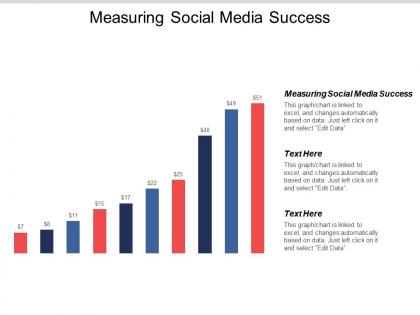 Measuring social media success ppt powerpoint presentation layouts icons cpb
Presenting this set of slides with name - Measuring Social Media Success Ppt Powerpoint Presentation Layouts Icons Cpb. This is an editable three stages graphic that deals with topics like Measuring Social Media Success to help convey your message better graphically. This product is a premium product available for immediate download, and is 100 percent editable in Powerpoint. Download this now and use it in your presentations to impress your audience.
-
 Track and measure buzz marketing about your business
Presenting this set of slides with name Track And Measure Buzz Marketing About Your Business. This is a six process. The stages in this process are stages Buzz Marketing, Buzz Marketing Campaign, Business. This is a completely editable PowerPoint presentation and is available for immediate download. Download now and impress your audience.
-
 Human resources measurement ppt powerpoint presentation gallery introduction cpb
Presenting this set of slides with name - Human Resources Measurement Ppt Powerpoint Presentation Gallery Introduction Cpb. This is an editable seven stages graphic that deals with topics like Human Resources Measurement to help convey your message better graphically. This product is a premium product available for immediate download, and is 100 percent editable in Powerpoint. Download this now and use it in your presentations to impress your audience.
-
 Risk measurement using caliper for creating framework
Presenting this set of slides with name Risk Measurement Using Caliper For Creating Framework. This is a one stage process. The stages in this process are Risk Framework, Management, Process. This is a completely editable PowerPoint presentation and is available for immediate download. Download now and impress your audience.
-
 Marketing roi measurement ppt powerpoint presentation professional example cpb
Presenting this set of slides with name Marketing ROI Measurement Ppt Powerpoint Presentation Professional Example Cpb. This is an editable Powerpoint five stages graphic that deals with topics like Marketing ROI Measurement to help convey your message better graphically. This product is a premium product available for immediate download and is 100 percent editable in Powerpoint. Download this now and use it in your presentations to impress your audience.
-
 Agenda for how to measure and improve the business value of it service
Introducing Agenda For How To Measure And Improve The Business Value Of IT Service to increase your presentation threshold. Encompassed with four stages, this template is a great option to educate and entice your audience. Dispence information on Value Information, Technology, Organizations Goal, Strategic, Communicate, using this template. Grab it now to reap its full benefits.
-
 How to measure and improve the business value of it service capture business value drivers what executives
This template covers what executives care most about by identifying their top priorities by reviewing the internal information sources for initial indications of executive focus and primary objectives such as Project charter documents and annual reports. Deliver an outstanding presentation on the topic using this How To Measure And Improve The Business Value Of IT Service Capture Business Value Drivers What Executives. Dispense information and present a thorough explanation of Revenue Impact, Cost Efficiency, Risk Mitigation, Value Impact, Business Value using the slides given. This template can be altered and personalized to fit your needs. It is also available for immediate download. So grab it now.
-
 How to measure and improve the business value of it service challenges with it metrics while aligning
This template covers the problems while aligning IT metrics to business values. Some of these challenges are fear of transparency, misaligned terminology, analysis lag time, labor or time intensive, etc. Introducing How To Measure And Improve The Business Value Of IT Service Challenges With IT Metrics While Aligning to increase your presentation threshold. Encompassed with five stages, this template is a great option to educate and entice your audience. Dispence information on Bad Data, Fear Transparency, Analysis Lag Time, Misaligned Terminology, Labor, Time Intensive, using this template. Grab it now to reap its full benefits.
-
 How to measure and improve the business value of it service delivery metrics service delivery meetings
This template covers service delivery metrics aligned to a business value, such as percent of projects on time, on budget, on spec, and percent of business facing services meeting service level agreements slas. Present the topic in a bit more detail with this How To Measure And Improve The Business Value Of IT Service Delivery Metrics Service Delivery Meetings. Use it as a tool for discussion and navigation on IT Project Investments, Run Business, Grow Business, Transform Business. This template is free to edit as deemed fit for your organization. Therefore download it now.
-
 How to measure and improve the business value of it service how to over come the challenges
This template covers the solutions or recommendations for managers seeking to increase their credibility, trust, and status with business stakeholders on IT finance, risk, and value through communication. Introducing How To Measure And Improve The Business Value Of IT Service How To Over Come The Challenges to increase your presentation threshold. Encompassed with three stages, this template is a great option to educate and entice your audience. Dispence information on Enhance Message, Business Value, Goals, Leadership, Objectives, using this template. Grab it now to reap its full benefits.
-
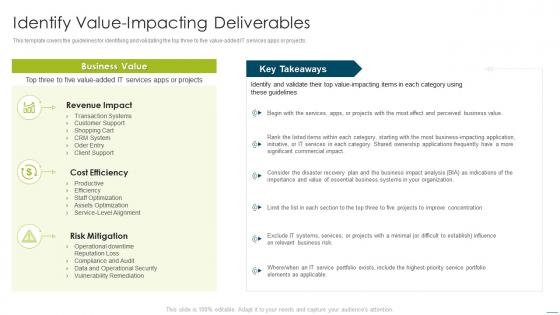 How to measure and improve the business value of it service identify value impacting deliverables
This template covers the guidelines for identifying and validating the top three to five value-added IT services apps or projects. Deliver an outstanding presentation on the topic using this How To Measure And Improve The Business Value Of IT Service Identify Value Impacting Deliverables. Dispense information and present a thorough explanation of Business Value, Revenue Impact, Cost Efficiency, Risk Mitigation using the slides given. This template can be altered and personalized to fit your needs. It is also available for immediate download. So grab it now.
-
 How to measure and improve the business value of it service key challenges faced while communicating
This template covers the challenges faced by the companies or leaders to drive IT values through communication. Increase audience engagement and knowledge by dispensing information using How To Measure And Improve The Business Value Of IT Service Key Challenges Faced While Communicating. This template helps you present information on three stages. You can also present information on IT Business Value Journey, Business Outcomes, Business Executives using this PPT design. This layout is completely editable so personaize it now to meet your audiences expectations.
-
 How to measure and improve the business value of it service link it deliverables to applications services
This template depicts that after documenting business value drivers, there is a need to shift towards how IT affects business goals or results. Introducing How To Measure And Improve The Business Value Of IT Service Link IT Deliverables To Applications Services to increase your presentation threshold. Encompassed with six stages, this template is a great option to educate and entice your audience. Dispence information on Business Goals, Business Value Drivers, Information Technology Services, Business Outcomes, using this template. Grab it now to reap its full benefits.
-
 How to measure and improve the business value of it service metrics that communicate the efficiency
This template covers the set of KPIs that most effectively represent the efficiency and effectiveness business contribution of the documented business impacting services, apps, or projects. Increase audience engagement and knowledge by dispensing information using How To Measure And Improve The Business Value Of IT Service Metrics That Communicate The Efficiency. This template helps you present information on four stages. You can also present information on Sales Closed, Time, Cost Effectively, Business Effect using this PPT design. This layout is completely editable so personaize it now to meet your audiences expectations.
-
 How to measure and improve the business value of it service plan for execution of communication strategies
This template covers the objectives and plans for communication strategies, such as increasing financing approval rates through focusing on technical deliverables rather than business impacting outcomes. Increase audience engagement and knowledge by dispensing information using How To Measure And Improve The Business Value Of IT Service Plan For Execution Of Communication Strategies. This template helps you present information on two stages. You can also present information on Objective, Plan, Mission, Increase Finance, Communication using this PPT design. This layout is completely editable so personaize it now to meet your audiences expectations.


