Powerpoint Templates and Google slides for KPI For Accounting
Save Your Time and attract your audience with our fully editable PPT Templates and Slides.
-
 Non Profit Operational Plan KPIs For Enhancing Accountability
This slide showcases non profit operational plan KPIs for providing systematic way to track progress, demonstrate impact and drive continuous improvement. It includes aspects such as year, objective, KPIs, target and quantitative figure. Presenting our well structured Non Profit Operational Plan Kpis For Enhancing Accountability. The topics discussed in this slide are Develop Strategic Operational Plan, Build Organizational Capacity, Assess Program Impact. This is an instantly available PowerPoint presentation that can be edited conveniently. Download it right away and captivate your audience.
-
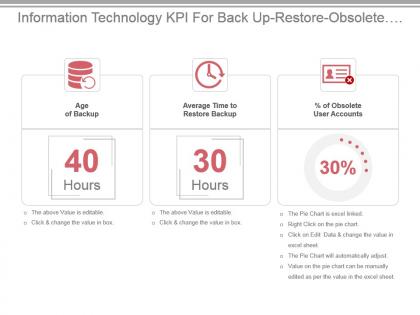
 Information technology kpi for back up restore obsolete user accounts presentation slide
Presenting information technology kpi for back up restore obsolete user accounts presentation slide. This presentation slide shows three Key Performance Indicators or KPIs in a Dashboard style design. The first KPI that can be shown is Age of Backup. The second KPI is Average Time to Restore Backup and the third is percentage of Obsolete User Accounts. These KPI Powerpoint graphics are all data driven,and the shape automatically adjusts according to your data. Just right click on the KPI graphic,enter the right value and the shape will adjust automatically. Make a visual impact with our KPI slides.
-
 Kpi for compliance loe reviewed accounts change request issues resolved presentation slide
Presenting kpi for compliance loe reviewed accounts change request issues resolved presentation slide. This presentation slide shows three Key Performance Indicators or KPIs in a Dashboard style design. The first KPI that can be shown is QAR IT Compliance LOE Quarterly. The second KPI is of Terminated Employee User Accounts Reviewed for Compliance and the third is of Non compliant Change Request Issues Resolved. These KPI Powerpoint graphics are all data driven,and the shape automatically adjusts according to your data. Just right click on the KPI graphic,enter the right value and the shape will adjust automatically. Make a visual impact with our KPI slides.
-
 Kpi for regulatory compliance time regulation and initiation time user active accounts ppt slide
Presenting kpi for regulatory compliance time regulation and initiation time user active accounts ppt slide. This presentation slide shows three Key Performance Indicators or KPIs in a Dashboard style design. The first KPI that can be shown is Regulatory Compliance on Time. The second KPI is Average Time Lag Between New Regulation and Initiation of Review and the third is percentage of Terminated Employee AD User Accounts Active. These KPI Powerpoint graphics are all data driven,and the shape automatically adjusts according to your data. Just right click on the KPI graphic,enter the right value and the shape will adjust automatically. Make a visual impact with our KPI slides.
-
 Kpi for inventory accounts payable holding costs powerpoint slide
Presenting kpi for inventory accounts payable holding costs powerpoint slide. This presentation slide shows Two Key Performance Indicators or KPIs in a Dashboard style design. The first KPI that can be shown is Percentage of Inventory in Accounts Payable. The second KPI is Inventory Holding Costs or IHC as Percentage of Inventory Value. These KPI Powerpoint graphics are all data driven, and the shape automatically adjusts according to your data. Just right click on the KPI graphic, enter the right value and the shape will adjust automatically. Make a visual impact with our KPI slides.
-
 Kpi for account users non existing account users page stories presentation slide
Presenting kpi for account users non existing account users page stories presentation slide. This presentation slide shows three Key Performance Indicators or KPIs in a Dashboard style design. The first KPI that can be shown is Number of Views of Page From Logged in Users. The second KPI is Number of Views of Page From Not Logged in Users and the third is Number of Stories Created About Your Page. These KPI Powerpoint graphics are all data driven, and the shape automatically adjusts according to your data. Just right click on the KPI graphic, enter the right value and the shape will adjust automatically. Make a visual impact with our KPI slides.


