Powerpoint Templates and Google slides for KPI Analytics
Save Your Time and attract your audience with our fully editable PPT Templates and Slides.
-
 HR Analytics KPIs Powerpoint Ppt Template Bundles
Deliver a credible and compelling presentation by deploying this HR Analytics KPIs Powerpoint Ppt Template Bundles. Intensify your message with the right graphics, images, icons, etc. presented in this complete deck. This PPT template is a great starting point to convey your messages and build a good collaboration. The Twelve slides added to this PowerPoint slideshow helps you present a thorough explanation of the topic. You can use it to study and present various kinds of information in the form of stats, figures, data charts, and many more. This HR KPIs Powerpoint Ppt Template Bundles PPT slideshow is available for use in standard and widescreen aspects ratios. So, you can use it as per your convenience. Apart from this, it can be downloaded in PNG, JPG, and PDF formats, all completely editable and modifiable. The most profound feature of this PPT design is that it is fully compatible with Google Slides making it suitable for every industry and business domain.
-
 Project kpis content planned processes analytics measure performance
Introduce your topic and host expert discussion sessions with this Project Kpis Content Planned Processes Analytics Measure Performance. This template is designed using high-quality visuals, images, graphics, etc, that can be used to showcase your expertise. Different topics can be tackled using the twelve slides included in this template. You can present each topic on a different slide to help your audience interpret the information more effectively. Apart from this, this PPT slideshow is available in two screen sizes, standard and widescreen making its delivery more impactful. This will not only help in presenting a birds-eye view of the topic but also keep your audience engaged. Since this PPT slideshow utilizes well-researched content, it induces strategic thinking and helps you convey your message in the best possible manner. The biggest feature of this design is that it comes with a host of editable features like color, font, background, etc. So, grab it now to deliver a unique presentation every time.
-
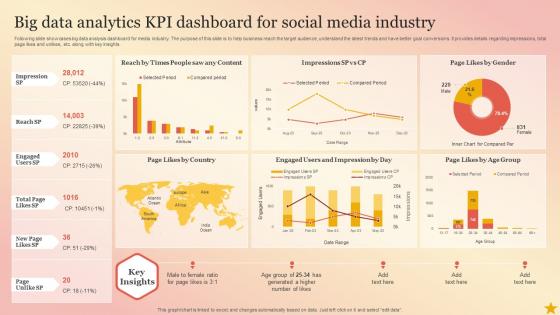 Big Data Analytics Kpi Dashboard For Social Media Industry
Following slide showcases big data analysis dashboard for media industry. The purpose of this slide is to help business reach the target audience, understand the latest trends and have better goal conversions. It provides details regarding impressions, total page likes and unlikes, etc. along with key insights. Introducing our Big Data Analytics Kpi Dashboard For Social Media Industry set of slides. The topics discussed in these slides are Page Likes By Gender, Page Likes By Country. This is an immediately available PowerPoint presentation that can be conveniently customized. Download it and convince your audience.
-
 KPI Dashboard To Assess M And A Analytics Report Guide Of Business Merger And Acquisition Plan Strategy SS V
This slide covers KPI dashboard to assess MAndA analytics report. It involves key details such as percentage of total number of MAndA, nature of business acquired and digital focused acquisitions. Present the topic in a bit more detail with this KPI Dashboard To Assess M And A Analytics Report Guide Of Business Merger And Acquisition Plan Strategy SS V. Use it as a tool for discussion and navigation on Digital Focused Acquisitions, Nature Of Business Acquired. This template is free to edit as deemed fit for your organization. Therefore download it now.
-
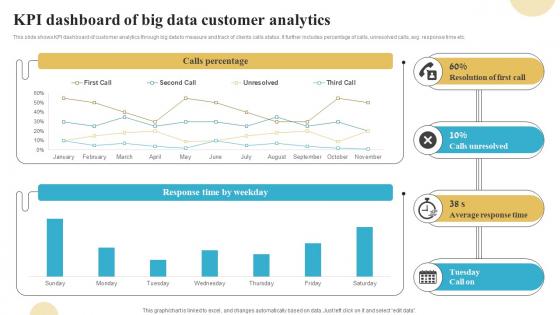 Kpi Dashboard Of Big Data Customer Analytics
This slide shows KPI dashboard of customer analytics through big data to measure and track of clients calls status. It further includes percentage of calls, unresolved calls, avg. response time etc. Presenting our well structured Kpi Dashboard Of Big Data Customer Analytics. The topics discussed in this slide are Calls Percentage, Resolution Of First Call, Calls Unresolved. This is an instantly available PowerPoint presentation that can be edited conveniently. Download it right away and captivate your audience.
-
 KPI Dashboard To Assess IOT Analytics In Healthcare Guide Of Integrating Industrial Internet
This slide covers dashboard to assess patient data by integrating IoT to enhance healthcare services. It involves details such as heart rate, temperature and oxygen level. Present the topic in a bit more detail with this KPI Dashboard To Assess IOT Analytics In Healthcare Guide Of Integrating Industrial Internet. Use it as a tool for discussion and navigation on Blood Pressure, Temperature. This template is free to edit as deemed fit for your organization. Therefore download it now.
-
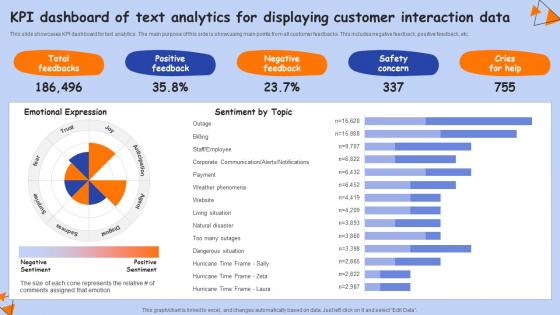 KPI Dashboard Of Text Analytics For Displaying Customer Interaction Data
This slide showcases KPI dashboard for text analytics. The main purpose of this side is showcasing main points from all customer feedbacks. This includes negative feedback, positive feedback, etc.Introducing our KPI Dashboard Of Text Analytics For Displaying Customer Interaction Data set of slides. The topics discussed in these slides are Corporate Communication, Weather Phenomena, Natural Disaster. This is an immediately available PowerPoint presentation that can be conveniently customized. Download it and convince your audience.
-
 KPI Analytics Dashboard For Smart Home Unlocking Potential Of Aiot IoT SS
The purpose of this slide is to showcase key performance indicators KPIs dashboard for smart homes. The metrics mentioned in slide are indoor temperature, humidity, light intensity, etc. Present the topic in a bit more detail with this KPI Analytics Dashboard For Smart Home Unlocking Potential Of Aiot IoT SS. Use it as a tool for discussion and navigation on Living Room, Bedroom. This template is free to edit as deemed fit for your organization. Therefore download it now.
-
 Agile Financial Analytics Kpi Dashboard
This slide showcases financial analytics KPI dashboard. This slide aims to provide in depth insights into company financial status to add value to the company. It helps in improving financial performance through proper information about the expenses and revenue of the organization. Presenting our well structured Agile Financial Analytics Kpi Dashboard. The topics discussed in this slide are Current Ratio Mom Trend, Dimension Breakdown.This is an instantly available PowerPoint presentation that can be edited conveniently. Download it right away and captivate your audience.
-
 Agile Risk Analytics Kpi Dashboard
This slide highlights KPI dashboard for agile risk analytics. The purpose of this template is to identify internal and external risk for the business entity and employ techniques for risk mitigation. It includes components such as total risk, initial risk level, risk status, risk trends and top risks of the entity. Presenting our well structured Agile Risk Analytics Kpi Dashboard. The topics discussed in this slide are Identify Goals, Risk Assessment.This is an instantly available PowerPoint presentation that can be edited conveniently. Download it right away and captivate your audience.
-
 Linkedin Analytics Kpi Dashboard To Gain Strategic Insights
This slide highlights power BI dashboard for LinkedIn analytics. The purpose of this template is to provide businesses with at-a-glance visual feedback for comparing various key performance indicators. It includes elements such as connections, companies, reactions, etc. Presenting our well structured Linkedin Analytics Kpi Dashboard To Gain Strategic Insights The topics discussed in this slide are This slide highlights power BI dashboard for LinkedIn analytics. The purpose of this template is to provide businesses with at-a-glance visual feedback for comparing various key performance indicators. It includes elements such as connections, companies, reactions, etc. This is an instantly available PowerPoint presentation that can be edited conveniently. Download it right away and captivate your audience.
-
 Linkedin Impressions Analytics Kpi Dashboard
This slide highlights the LinkedIn analytics KPI dashboard. The purpose of this slide is to help businesses in analyzing the performance of their content for reaching with target audience. It includes elements such as followers, click-through rate, engagement, etc. Presenting our well structured Linkedin Impressions Analytics Kpi Dashboard The topics discussed in this slide are Company Industry, Job Function, Job Seniority This is an instantly available PowerPoint presentation that can be edited conveniently. Download it right away and captivate your audience.
-
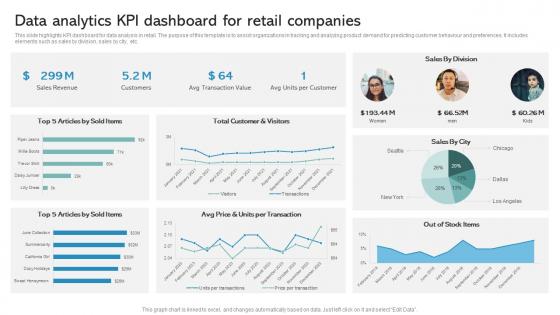 Data Analytics KPI Dashboard For Retail Companies
This slide highlights KPI dashboard for data analysis in retail. The purpose of this template is to assist organizations in tracking and analyzing product demand for predicting customer behaviour and preferences. It includes elements such as sales by division, sales by city, etc. Presenting our well structured Data Analytics KPI Dashboard For Retail Companies. The topics discussed in this slide are Total Customer And Visitors, Units Per Transaction, Articles By Sold Items. This is an instantly available PowerPoint presentation that can be edited conveniently. Download it right away and captivate your audience.
-
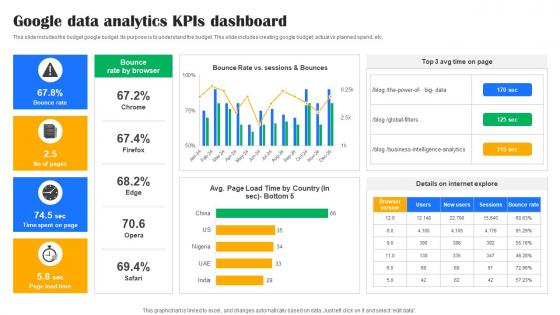 Google Data Analytics KPIS Dashboard
This slide includes the budget google budget. Its purpose is to understand the budget. This slide includes creating google budget, actual vs planned spend, etc. Introducing our Google Data Analytics KPIS Dashboard set of slides. The topics discussed in these slides are Data Analytics, KPIS Dashboard This is an immediately available PowerPoint presentation that can be conveniently customized. Download it and convince your audience.
-
 Pinterest Affiliate Marketing Analytics Kpi Dashboard
This slide represents pinterest affiliate marketing KPI dashboard which assists to diversify revenue and drive conversion for products. It includes key components such as total impressions, total audience reach, etc Presenting our well structured Pinterest Affiliate Marketing Analytics Kpi Dashboard The topics discussed in this slide are Impressions, Total Audience, Engagement. This is an instantly available PowerPoint presentation that can be edited conveniently. Download it right away and captivate your audience.
-
 A Comprehensive Guide Step 6 Kpi Dashboard To Configure User Experience Data Analytics SS
This slide illustrates a dashboard tracking customer experience on website page to make necessary improvements. It covers data on KPIs such as sessions, page sessions, average duration, new sessions, bounce rate, etc Deliver an outstanding presentation on the topic using this A Comprehensive Guide Step 6 Kpi Dashboard To Configure User Experience Data Analytics SS Dispense information and present a thorough explanation of Bounce Rate, New Sessions, Average Session Duration using the slides given. This template can be altered and personalized to fit your needs. It is also available for immediate download. So grab it now.
-
 Product Analytics Kpi Enhancing Business Insights Implementing Product Data Analytics SS V
This slide illustrates a dashboard to monitor the lead generation on website page using product analytics aimed at making necessary improvements. It covers insights regarding analysis of lead conversions, event retention rate and page views. Deliver an outstanding presentation on the topic using this Product Analytics Kpi Enhancing Business Insights Implementing Product Data Analytics SS V. Dispense information and present a thorough explanation of Product Analytics, KPI Dashboard, Lead Generation using the slides given. This template can be altered and personalized to fit your needs. It is also available for immediate download. So grab it now.
-
 Kpi Dashboard Showcasing Cybersecurity In Big Data Analytics
This slide highlights big data analytics cybersecurity threats showcasing KPI dashboard for user awareness against insecure systems. It further covers risk and compliance, threat detection, top threat by class, security control table, etc. Presenting our well structured Kpi Dashboard Showcasing Cybersecurity In Big Data Analytics. The topics discussed in this slide are KPI Dashboard, Showcasing Cybersecurity, Big Data Analytics, Security Control Table. This is an instantly available PowerPoint presentation that can be edited conveniently. Download it right away and captivate your audience.
-
 Health Insurance Claim Analysis KPI Navigating The Future Of Insurance Data Analytics SS
This slide provides a dashboard utilising data analytics to assess and evaluate number of health insurance claims. It covers insights generated by metrics such as revenue and expenses generated, list of agents and medical insurance. Deliver an outstanding presentation on the topic using this Health Insurance Claim Analysis KPI Navigating The Future Of Insurance Data Analytics SS. Dispense information and present a thorough explanation of Revenue Generated, Medical Insurance, Expenses Made using the slides given. This template can be altered and personalized to fit your needs. It is also available for immediate download. So grab it now.
-
 Kpi Dashboard For Tracking Efficiency Of Spark Data Analytics
This slide showcases spark data analytics measuring KPI dashboard. This slide includes executors, executors memory usage, driver memory usage, total failed tasks, total completed tasks, max tasks on executor. Introducing our Kpi Dashboard For Tracking Efficiency Of Spark Data Analytics set of slides. The topics discussed in these slides are Dashboard, Efficiency, Data Analytics. This is an immediately available PowerPoint presentation that can be conveniently customized. Download it and convince your audience.
-
 Insurance Customer Analysis KPI Dashboard Navigating The Future Of Insurance Data Analytics SS
This slide outlines a dashboard graphically representing analysis of existing as well as newly acquired insurance customers. It covers metrics such as premium amount, claim amount, claims per month, claims by status, etc. Present the topic in a bit more detail with this Insurance Customer Analysis KPI Dashboard Navigating The Future Of Insurance Data Analytics SS. Use it as a tool for discussion and navigation on Premium Amount Generated, Claim Amount Generated, Customers By Age Group. This template is free to edit as deemed fit for your organization. Therefore download it now.
-
 Kpi Dashboard Clinical Trials Leveraging Data Analytics For Clinical Success Data Analytics SS
This slide provides an analytics dashboard aimed ta helping pharma businesses maintain patient summary for effective trials. It covers drug trial monitoring on the basis of cost, participants, hours and cost by status Deliver an outstanding presentation on the topic using this Kpi Dashboard Clinical Trials Leveraging Data Analytics For Clinical Success Data Analytics SS. Dispense information and present a thorough explanation of Dashboard, Analyse, Average Enrolment using the slides given. This template can be altered and personalized to fit your needs. It is also available for immediate download. So grab it now.
-
 Kpi Dashboard Monitor Patient Trials Leveraging Data Analytics For Clinical Success Data Analytics SS
This slide provides a dashboard aimed at analysing patient details to evaluate trials. It covers a patient dashboard to evaluate tasks routine, contact referral and progress Present the topic in a bit more detail with this Kpi Dashboard Monitor Patient Trials Leveraging Data Analytics For Clinical Success Data Analytics SS. Use it as a tool for discussion and navigation on Dashboard, Evaluate, Analysing. This template is free to edit as deemed fit for your organization. Therefore download it now.
-
 Kpi Dashboard Monitoring Leveraging Data Analytics For Clinical Success Data Analytics SS
This slide provides a dashboard highlighting use of site selection and monitoring aimed at helping pharma businesses make wide decisions. It covers metrics such as actual vs planned sites, approved sites, sites as per status, etc Deliver an outstanding presentation on the topic using this Kpi Dashboard Monitoring Leveraging Data Analytics For Clinical Success Data Analytics SS. Dispense information and present a thorough explanation of Dashboard, Effective, Monitoring using the slides given. This template can be altered and personalized to fit your needs. It is also available for immediate download. So grab it now.
-
 Kpi Dashboard Surveillance Of Medical Leveraging Data Analytics For Clinical Success Data Analytics SS
This slide outlines a dashboard illustrating monitoring of medical device released after clinical trials. It covers data on adverse events, recall events, product recalls, injury, death, malfunction, etc Present the topic in a bit more detail with this Kpi Dashboard Surveillance Of Medical Leveraging Data Analytics For Clinical Success Data Analytics SS. Use it as a tool for discussion and navigation on Dashboard, Marketing, Surveillance. This template is free to edit as deemed fit for your organization. Therefore download it now.
-
 Kpi Dashboard To Drug Events Leveraging Data Analytics For Clinical Success Data Analytics SS
This slide provides an analytics dashboard aimed ta helping pharma businesses monitor adverse drug events. It covers ADE counts by drug use based on distribution, repetition, etc Deliver an outstanding presentation on the topic using this Kpi Dashboard To Drug Events Leveraging Data Analytics For Clinical Success Data Analytics SS. Dispense information and present a thorough explanation of Dashboard, Drug Events, Pharma Businesses using the slides given. This template can be altered and personalized to fit your needs. It is also available for immediate download. So grab it now.
-
 Kpi Dashboard To Monitor Drug Trials Leveraging Data Analytics For Clinical Success Data Analytics SS
This slide provides an analytics dashboard aimed ta helping pharma businesses track drug trials. It covers drug trial monitoring on the basis of cost, participants, hours and cost by status Present the topic in a bit more detail with this Kpi Dashboard To Monitor Drug Trials Leveraging Data Analytics For Clinical Success Data Analytics SS. Use it as a tool for discussion and navigation on Dashboard, Pharma Businesses, Monitoring. This template is free to edit as deemed fit for your organization. Therefore download it now.
-
 Kpi Patient Summary For Trials Leveraging Data Analytics For Clinical Success Data Analytics SS
This slide provides an analytics dashboard aimed ta helping pharma businesses track drug trials. It covers drug trial monitoring on the basis of cost, participants, hours and cost by status Deliver an outstanding presentation on the topic using this Kpi Patient Summary For Trials Leveraging Data Analytics For Clinical Success Data Analytics SS. Dispense information and present a thorough explanation of Dashboard, Clinical Patient, Pharma Businesses using the slides given. This template can be altered and personalized to fit your needs. It is also available for immediate download. So grab it now.
-
 Kpi Recruitment For Clinical Trials Leveraging Data Analytics For Clinical Success Data Analytics SS
This slide provides a dashboard aimed at analysing participants recruited to achieve target of clinical trials. It covers metrics such as participants recruited, on target performance, recruitment per week and enrolment completion date Present the topic in a bit more detail with this Kpi Recruitment For Clinical Trials Leveraging Data Analytics For Clinical Success Data Analytics SS. Use it as a tool for discussion and navigation on Analyse, Dashboard, Recruitment. This template is free to edit as deemed fit for your organization. Therefore download it now.
-
 Kpi data analytics ppt powerpoint presentation ideas images cpb
Presenting KPI Data Analytics Ppt Powerpoint Presentation Ideas Images Cpb slide which is completely adaptable. The graphics in this PowerPoint slide showcase three stages that will help you succinctly convey the information. In addition, you can alternate the color, font size, font type, and shapes of this PPT layout according to your content. This PPT presentation can be accessed with Google Slides and is available in both standard screen and widescreen aspect ratios. It is also a useful set to elucidate topics like KPI Data Analytics. This well structured design can be downloaded in different formats like PDF, JPG, and PNG. So, without any delay, click on the download button now.
-
 Advanced Data Analytics Kpis To Measure Business Growth
This slide highlights the major advanced data analytics KPIs to measure business growth. The purpose of this template is to determine the efficiency of the data analytics team and help improve deficiencies through the adoption of appropriate strategies.Introducing our Advanced Data Analytics Kpis To Measure Business Growth set of slides. The topics discussed in these slides are Improvement Methods, Generated Month, Result Generation. This is an immediately available PowerPoint presentation that can be conveniently customized. Download it and convince your audience.
-
 KPIs To Track Performance Of CRM Analytics
This slide highlights the major KPIs which can be used to track CRM analytics. The purpose of this template is to help the business manager in assessing CRM strategy performance in order to determine areas of improvement.Introducing our KPIs To Track Performance Of CRM Analytics set of slides. The topics discussed in these slides are Measuring Sales, Measuring Customer, Revenue Generation. This is an immediately available PowerPoint presentation that can be conveniently customized. Download it and convince your audience.
-
 Social Media Mix KPI Analytics
This slide outlines the specific KPIs and improvement measurement that based on social media strategy and objectives. It includes various KPIs such as followers, engagement rate, reach, impressions and conversion rate. Presenting our well structured Social Media Mix KPI Analytics. The topics discussed in this slide are Engagement, Impressions, Conversion. This is an instantly available PowerPoint presentation that can be edited conveniently. Download it right away and captivate your audience.
-
 KPIs To Track Big Data Analytics Efficiency
This slide highlights the various KPIs for evaluating the efficiency of the big data analytics process. The purpose of this slide is to help assess the effectiveness of big data analytics techniques and identify weaknesses to improve them. It includes KPIs such as the number of insights generated per month, accuracy of predictions made, number of models generated per month, etc.Presenting our well structured KPIs To Track Big Data Analytics Efficiency. The topics discussed in this slide are Insights Generated, Predications Made, Developed Per Month. This is an instantly available PowerPoint presentation that can be edited conveniently. Download it right away and captivate your audience.
-
 Product Management Analytics KPIs And Metrics
This slide showcases KPIs and metrics of product management analytics for analysis performance. It further includes engagement, retention, activation, acquisition, and monetization metrics. Introducing our premium set of slides with Product Management Analytics KPIs And Metrics. Ellicudate the Five stages and present information using this PPT slide. This is a completely adaptable PowerPoint template design that can be used to interpret topics like Engagement Metrics, Activation Metrics, Acquisition Metrics. So download instantly and tailor it with your information.
-
 Mastering Lead Generation Lead Generation KPIs For Marketing Analytics
This slide presents key performance indicators KPIs for measuring lead generation success and marketing analytics, enabling managers to track and analyze the effectiveness of their lead generation strategies. Major KPIs relate to the number of leads, number of sessions, engagement, conversion rate, etc. Present the topic in a bit more detail with this Mastering Lead Generation Lead Generation KPIs For Marketing Analytics. Use it as a tool for discussion and navigation on Customer Acquisition Cost, Revenue From A Customer, Customer Lifetime Value. This template is free to edit as deemed fit for your organization. Therefore download it now.
-
 Kpi Dashboard Icon Of Big Data In Customer Analytics
Introducing our Kpi Dashboard Icon Of Big Data In Customer Analytics set of slides. The topics discussed in these slides are Kpi Dashboard Icon Of Big, Data In Customer Analytics. This is an immediately available PowerPoint presentation that can be conveniently customized. Download it and convince your audience.
-
 Data Analytics KPI For IT Industry
This slide outlines certain key performance indicators to measure data analytics in information technology industry to track performance and impact of data on business decision. It involves metrics such as business impact, time period, data quality, data literacy level and risk Introducing our Data Analytics KPI For IT Industry set of slides. The topics discussed in these slides are Business, Quality, Literacy. This is an immediately available PowerPoint presentation that can be conveniently customized. Download it and convince your audience.
-
 HR Analytics KPI Evaluation Checklist Icon
Presenting our set of slides with HR Analytics KPI Evaluation Checklist Icon. This exhibits information on Three stages of the process. This is an easy to edit and innovatively designed PowerPoint template. So download immediately and highlight information on HR KPI Evaluation, Checklist Icon.
-
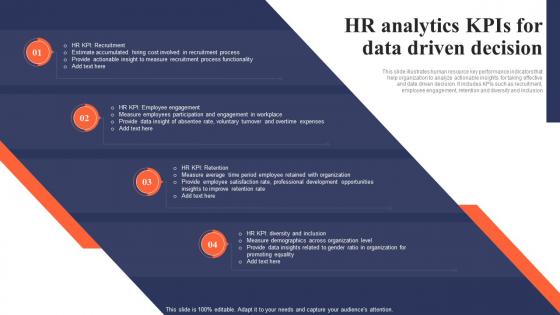 HR Analytics KPIs For Data Driven Decision
This slide illustrates human resource key performance indicators that help organization to analyze actionable insights for taking effective and date driven decision. It includes KPIs such as recruitment, employee engagement, retention and diversity and inclusion. Introducing our premium set of slides with HR Analytics KPIs For Data Driven Decision. Ellicudate the Four stages and present information using this PPT slide. This is a completely adaptable PowerPoint template design that can be used to interpret topics like Process Functionality, Overtime Expenses, Development Opportunities. So download instantly and tailor it with your information.
-
 HR Analytics KPIs For Measuring Training Effectiveness
This slide showcases key performance indicators for HR department that can help organization to analyze training outcomes. Various elements includes are KPIs, type of training, budget training cost, actual training cost and training outcomes Introducing our HR Analytics KPIs For Measuring Training Effectiveness. The topics discussed in these slides are Type Of Training, Budgeted Training Cost . This is an immediately available PowerPoint presentation that can be conveniently customized. Download it and convince your audience.
-
 HR Analytics KPIs With Benchmark And Actual Progress
This slides showcase version of actual and target KPIs that helps the organization to analyze workforce efficiency and effectiveness. It also showcases comparison of benchmark and actual value and strategies to improve. Presenting our set of slides with HR Analytics KPIs With Benchmark And Actual Progress. This exhibits information on One stages of the process. This is an easy to edit and innovatively designed PowerPoint template. So download immediately and highlight information on Benchmark, Actual, Strategies To Improve .
-
 Human Resource Analytics KPIs For Business Startups
This slide illustrates KPI for human resource department that help organization to analyze current workforce performance efficiency. It include key performance indicators such as turnover ratio, talent rating, training cost etc. Presenting our set of slides with Human Resource Analytics KPIs For Business Startups. This exhibits information on Five stages of the process. This is an easy to edit and innovatively designed PowerPoint template. So download immediately and highlight information on Hiring Cost, Talent Rating, Training Costs.
-
 Human Resource Analytics KPIs Improvement Strategies
This slide showcases strategies that can help organization to improve HR key performance indicator. It also includes results before and after implementation of tactics to improve efficiency and effectiveness. Introducing our premium set of slides with Human Resource Analytics KPIs Improvement Strategies. Ellicudate the One stages and present information using this PPT slide. This is a completely adaptable PowerPoint template design that can be used to interpret topics like Improvement Strategy, Results Before Implementation, Result After Implementation. So download instantly and tailor it with your information.
-
 Recruitment KPIs For Human Resource Analytics Management
This slide showcase key performance indicator that can help organization to measure effectiveness of recruitment process. It includes key pointers such as time to hire, sourcing channel efficiency, number of qualified candidates and submit to interview ratio. Introducing our premium set of slides with Recruitment KPIs For Human Resource Analytics Management. Ellicudate the Four stages and present information using this PPT slide. This is a completely adaptable PowerPoint template design that can be used to interpret topics like Time To Hire, Sourcing Channel Efficiency, Submit To Interview Ratio . So download instantly and tailor it with your information.
-
 Various KPIs For HR Analytics Department Evaluation
This slide showcase key performance indicator that help organization to analyze functioning of human resource department with strategies to improve. It include indicators such as employee productivity rate, absence rate, benefit satisfaction and internal promotion rate. Presenting our set of slides with Various KPIs For HR Analytics Department Evaluation. This exhibits information on Four stages of the process. This is an easy to edit and innovatively designed PowerPoint template. So download immediately and highlight information on Benefits Satisfaction, Absence Rate, Internal Promotion Rate .
-
 Operational Analytics Implementation And Kpis Steps
This slide showcases the implementation and KPI steps of operational analytics. It further includes steps such as determine goals, evaluate KPIs for goal support, ensure data accuracy, choose analytical platform, etc. Introducing our Operational Analytics Implementation And Kpis Steps set of slides. The topics discussed in these slides are Optimize Operations, Choose Analytical Platform, Determine Goals. This is an immediately available PowerPoint presentation that can be conveniently customized. Download it and convince your audience.
-
 Procurement Kpis For Big Data Analytics
The purpose of this slide is to represent procurement KPIs for big data analytics to ensure efficiency and productivity. It includes various KPIs such as spend under management, spend vs. budget, total cost of ownership, cost of savings, cost of avoidance etc. Introducing our premium set of slides with Procurement Kpis For Big Data Analytics. Ellicudate the seven stages and present information using this PPT slide. This is a completely adaptable PowerPoint template design that can be used to interpret topics like Spend Under Management, Total Cost Of Ownership, Contract Average. So download instantly and tailor it with your information.
-
 KPIS For Digital Marketing Performance Analytics
This slide displays KPIs for digital marketing that helps to analyze campaign performance annually. It includes various KPIs such as cost per lead, conversion rate, click-through rate, and customer acquisition cost. Introducing our KPIS For Digital Marketing Performance Analytics set of slides. The topics discussed in these slides are Conversion Rate, Customer Acquisition Cost, Standard Performance This is an immediately available PowerPoint presentation that can be conveniently customized. Download it and convince your audience.
-
 HR Analytics KPIS And Performance Analysis
The slide emphasizes key factors such as recruitment, employee turnover, engagement, performance management, and training and development, showcasing HR Analytics KPIs and performance analysis. This aids in making informed HR decisions and evaluating performance. Presenting our well structured HR Analytics KPIS And Performance Analysis. The topics discussed in this slide are Employee Turnover, Employee Engagement, Performance Management. This is an instantly available PowerPoint presentation that can be edited conveniently. Download it right away and captivate your audience.
-
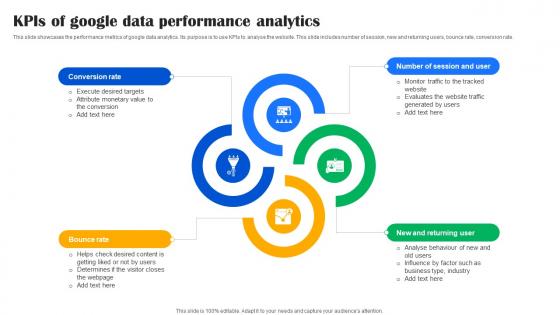 KPIS Of Google Data Performance Analytics
This slide showcases the performance metrics of google data analytics. Its purpose is to use KPIs to analyse the website. This slide includes number of session, new and returning users, bounce rate, conversion rate. Presenting our set of slides with KPIS Of Google Data Performance Analytics This exhibits information on four stages of the process. This is an easy to edit and innovatively designed PowerPoint template. So download immediately and highlight information on Conversion Rate, Bounce Rate, New And Returning User
-
 Implementing Workforce Analytics Kpi Metrics To Be Analyzed In Workforce Analytics Data Analytics SS
This slide showcases workforce analytics KPI metrics which can be tracked by business to enhance staff performance and retention rates. It provides information regarding employee engagement, team productivity, operational efficiency and staff monitoring. Introducing Implementing Workforce Analytics Kpi Metrics To Be Analyzed In Workforce Analytics Data Analytics SS to increase your presentation threshold. Encompassed with three stages, this template is a great option to educate and entice your audience. Dispence information on Staff Performance Monitoring, Work Efficiency, Compensation Or Company Culture, Absenteeism Rate, using this template. Grab it now to reap its full benefits.
-
 Tracking Procurement KPIs For Effective Supplier Analytics
This slide represents various procurement KPIs that assist companies in tracking supplier performance reducing risks for supply chain disruptions. It includes KPIs such as number of suppliers, supplier diversity, delivery time, supplier availability, etc. Presenting our well structured Tracking Procurement KPIs For Effective Supplier Analytics. The topics discussed in this slide are Suppliers Increased, Order Fulfillment. This is an instantly available PowerPoint presentation that can be edited conveniently. Download it right away and captivate your audience.
-
 Kpis For Paid Social Media Analytics
This slide represents the key performance indicators to track for paid social media analytics which include number of ads, total spend, clicks, cost per action, etc. Presenting our set of slides with Kpis For Paid Social Media Analytics. This exhibits information on seven stages of the process. This is an easy to edit and innovatively designed PowerPoint template. So download immediately and highlight information on Cost Per Engagement, Cost Per Action, Total Spend.
-
 Kpis To Measure Analytics Training Effectiveness Data Visualization DTE SS
This slide brings forth post-training improvements in IT team skill KPIs, offering managers a clear overview of the enhanced skills and capabilities within the team, and facilitating the assessment of training program effectiveness. Increase audience engagement and knowledge by dispensing information using Kpis To Measure Analytics Training Effectiveness Data Visualization DTE SS. This template helps you present information on four stages. You can also present information on KPI, Team Proficiency Level, Business using this PPT design. This layout is completely editable so personaize it now to meet your audiences expectations.
-
 KPI Metrics To Track Customer Engagement Leveraging Digital Analytics To Develop Data Analytics SS
This slide highlights various engagement metrics which can be tracked to analyzing customer behavior and purchasing patterns . It provides information regarding bounce rate, page per visit, customer satisfaction score, time on site and average benchmarks. Increase audience engagement and knowledge by dispensing information using KPI Metrics To Track Customer Engagement Leveraging Digital Analytics To Develop Data Analytics SS. This template helps you present information on four stages. You can also present information on Bounce Rate, Page Per Visits, Customer Satisfaction Score using this PPT design. This layout is completely editable so personaize it now to meet your audiences expectations.
-
 SEO Kpis For Website Performance Evaluation Leveraging Digital Analytics To Develop Data Analytics SS
This slide showcases various SEO driven KPI metrics which helps in tracking website performance. It provides information regarding organic traffic, click through rate, search visibility and keyword rankings with average benchmarks. Introducing SEO Kpis For Website Performance Evaluation Leveraging Digital Analytics To Develop Data Analytics SS to increase your presentation threshold. Encompassed with four stages, this template is a great option to educate and entice your audience. Dispence information on Search Visibility, Keyword Ranking, Click Through Rate, Organic Traffic, using this template. Grab it now to reap its full benefits.
-
 Social Media Analytics KPIs Measured For Leveraging Digital Analytics To Develop Data Analytics SS
This slide showcases various KPI metrics which are tracked in social media analytics to check campaign performance across various channels . It provides information regarding impressions, reach, audience , click through rate and average benchmarks. Increase audience engagement and knowledge by dispensing information using Social Media Analytics KPIs Measured For Leveraging Digital Analytics To Develop Data Analytics SS. This template helps you present information on four stages. You can also present information on Impressions, Audience Growth Rate, Click Through Rate using this PPT design. This layout is completely editable so personaize it now to meet your audiences expectations.
-
 Download kpis digital marketing analytics measurement strategy diagram ppt slides
Presenting download kpis digital marketing analytics measurement strategy diagram ppt slides. This is a kpis digital marketing analytics measurement strategy diagram ppt slides. This is a six stage process. The stages in this process are increase customer conversion, lead generation, website goal quick and easy purchases, kpl conversion rate purchases, segments revenue per purchase time on site geography, website goal get people to read about the services offered and sign up, kpl e mail sign-up conversion rate target 15 percentage, segments time on site geography 1 2 3 visit tiers.
-
 Visual Analytical KPI Dashboard Snapshot For Data Warehouse
Presenting our well structured Visual Analytical KPI Dashboard Snapshot For Data Warehouse. The topics discussed in this slide are Profit, Revenue Change, Analysis. This is an instantly available PowerPoint presentation that can be edited conveniently. Download it right away and captivate your audience.


