Powerpoint Templates and Google slides for Information Technology Dashboard
Save Your Time and attract your audience with our fully editable PPT Templates and Slides.
-
 Information Technology Dashboard Powerpoint PPT Template Bundles
Introduce your topic and host expert discussion sessions with this Information Technology Dashboard Powerpoint PPT Template Bundles. This template is designed using high-quality visuals, images, graphics, etc, that can be used to showcase your expertise. Different topics can be tackled using the twelve slides included in this template. You can present each topic on a different slide to help your audience interpret the information more effectively. Apart from this, this PPT slideshow is available in two screen sizes, standard and widescreen making its delivery more impactful. This will not only help in presenting a birds eye view of the topic but also keep your audience engaged. Since this PPT slideshow utilizes well-researched content, it induces strategic thinking and helps you convey your message in the best possible manner. The biggest feature of this design is that it comes with a host of editable features like color, font, background, etc. So, grab it now to deliver a unique presentation every time
-
 Financial Dashboard To Track Organization Expenses State Of The Information Technology Industry MKT SS V
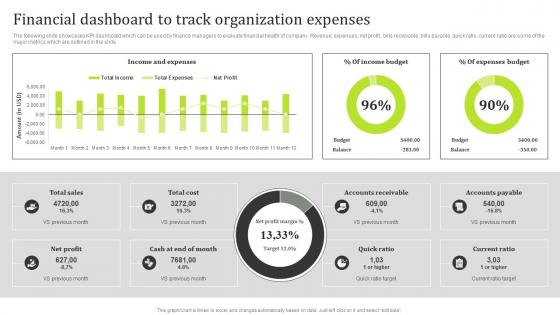
The following slide showcases KPI dashboard which can be used by finance managers to evaluate financial health of company. Revenue, expenses, net profit, bills receivable, bills payable, quick ratio, current ratio are some of the major metrics which are outlined in the slide. Present the topic in a bit more detail with this Financial Dashboard To Track Organization Expenses State Of The Information Technology Industry MKT SS V. Use it as a tool for discussion and navigation on Income And Expenses, Income Budget. This template is free to edit as deemed fit for your organization. Therefore download it now.
-
 Marketing Campaign Dashboard For B2B Marketers State Of The Information Technology Industry MKT SS V
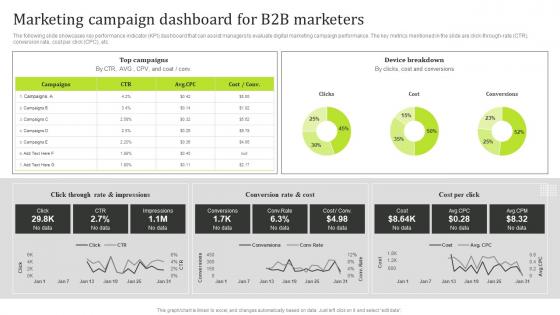
The following slide showcases key performance indicator KPI dashboard that can assist managers to evaluate digital marketing campaign performance. The key metrics mentioned in the slide are click-through-rate CTR, conversion rate, cost per click CPC, etc. Present the topic in a bit more detail with this Marketing Campaign Dashboard For B2B Marketers State Of The Information Technology Industry MKT SS V. Use it as a tool for discussion and navigation on Device Breakdown, Cost Per Click. This template is free to edit as deemed fit for your organization. Therefore download it now.
-
 KPI Dashboard For Information Technology Strategy Plan
This slide showcases various indicators for IT strategic plan. The main purpose of this slide is to keep tracking risks, project budget, and overdue target, it includes planning, designing, developments and testing. Introducing our KPI Dashboard For Information Technology Strategy Plan set of slides. The topics discussed in these slides are Overall Analysis Progress, Upcoming Deadlines. This is an immediately available PowerPoint presentation that can be conveniently customized. Download it and convince your audience.
-
 Financial Dashboard To Track Organization Information Technology Industry Forecast MKT SS V
The following slide showcases KPI dashboard which can be used by finance managers to evaluate financial health of company. Revenue, expenses, net profit, bills receivable, bills payable, quick ratio, current ratio are some of the major metrics which are outlined in the slide. Present the topic in a bit more detail with this Financial Dashboard To Track Organization Information Technology Industry Forecast MKT SS V. Use it as a tool for discussion and navigation on Financial, Organization, Expenses. This template is free to edit as deemed fit for your organization. Therefore download it now.
-
 Marketing Campaign Dashboard For B2B Information Technology Industry Forecast MKT SS V
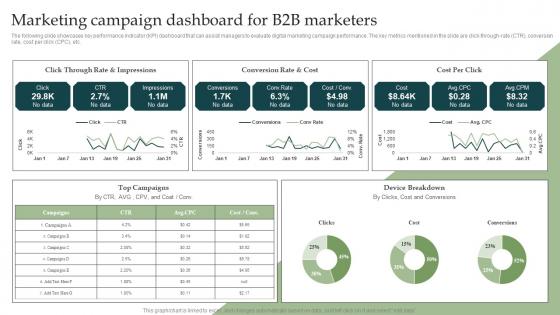
The following slide showcases key performance indicator KPI dashboard that can assist managers to evaluate digital marketing campaign performance. The key metrics mentioned in the slide are click through rate CTR, conversion rate, cost per click CPC, etc. Present the topic in a bit more detail with this Marketing Campaign Dashboard For B2B Information Technology Industry Forecast MKT SS V. Use it as a tool for discussion and navigation on Marketing, Marketers, Rate. This template is free to edit as deemed fit for your organization. Therefore download it now.
-
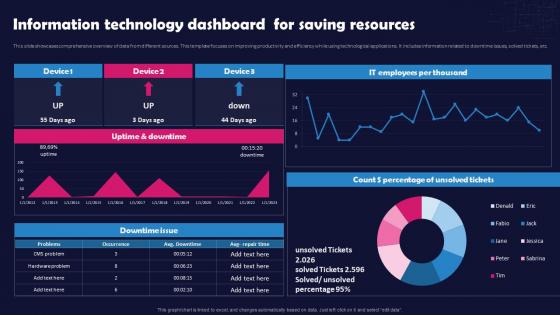 Unlocking The Impact Of Technology Information Technology Dashboard For Saving Resources
This slide showcases comprehensive overview of data from different sources. This template focuses on improving productivity and efficiency while using technological applications. It includes information related to downtime issues, solved tickets, etc. Present the topic in a bit more detail with this Unlocking The Impact Of Technology Information Technology Dashboard For Saving Resources. Use it as a tool for discussion and navigation on Information Technology Dashboard, Saving Resources, Technological Applications, Comprehensive Overview. This template is free to edit as deemed fit for your organization. Therefore download it now.
-
 Information Technology Virtualization KPI Dashboard
This slide covers various metrics of virtualization and provides details about system types, performance of machines in organization. It includes elements such as memory, CPU, disk, etc. Introducing our Information Technology Virtualization KPI Dashboard set of slides. The topics discussed in these slides are Virtualization Platforms, VM Status Over Time, VM Platform. This is an immediately available PowerPoint presentation that can be conveniently customized. Download it and convince your audience.
-
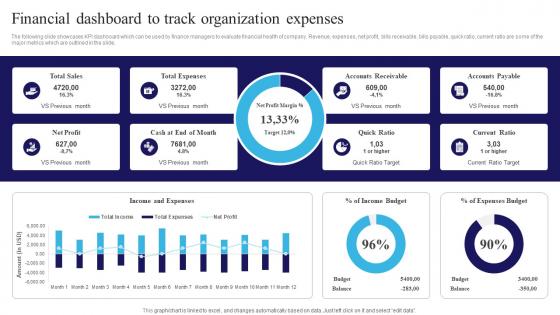 Financial Dashboard To Track Organization Expenses Navigating The Information Technology Landscape MKT SS V
The following slide showcases KPI dashboard which can be used by finance managers to evaluate financial health of company. Revenue, expenses, net profit, bills receivable, bills payable, quick ratio, current ratio are some of the major metrics which are outlined in the slide. Deliver an outstanding presentation on the topic using this Financial Dashboard To Track Organization Expenses Navigating The Information Technology Landscape MKT SS V. Dispense information and present a thorough explanation of Income Budget, Expenses Budget using the slides given. This template can be altered and personalized to fit your needs. It is also available for immediate download. So grab it now.
-
 Marketing Campaign Dashboard For B2B Marketers Navigating The Information Technology Landscape MKT SS V
The following slide showcases key performance indicator KPI dashboard that can assist managers to evaluate digital marketing campaign performance. The key metrics mentioned in the slide are click-through-rate CTR, conversion rate, cost per click CPC, etc. Present the topic in a bit more detail with this Marketing Campaign Dashboard For B2B Marketers Navigating The Information Technology Landscape MKT SS V. Use it as a tool for discussion and navigation on Cost Per Click, Device Breakdown. This template is free to edit as deemed fit for your organization. Therefore download it now.
-
 Information Technology Expenditure Summary Dashboard Implementing Cyber Risk Management Process
The following slide showcases the cyber security expense overview to better allocateplus budget. It includes elements such as IT cost, revenue, security incidents, services down, issue status summary, total business hours lost etc. Present the topic in a bit more detail with this Information Technology Expenditure Summary Dashboard Implementing Cyber Risk Management Process. Use it as a tool for discussion and navigation on Issue Status Summary, Costs And Revenue. This template is free to edit as deemed fit for your organization. Therefore download it now.
-
 Information Technology Dashboard To Track Industrial Manufacturing Productivity
This slide showcases the IT dashboard to monitor industrial manufacturing industry productivity. The purpose of this slide is to help the business monitor its industrial production and output. It includes elements such as downtime analysis, return items, etc. Presenting our well structured Information Technology Dashboard To Track Industrial Manufacturing Productivity The topics discussed in this slide are Product, Information Technology, Manufacturing Productivity This is an instantly available PowerPoint presentation that can be edited conveniently. Download it right away and captivate your audience.
-
 Information Technology Expenditure Summary Dashboard Cyber Risk Assessment
The following slide showcases the cyber security expense overview to better allocate budget. It includes elements such as IT cost, revenue, security incidents, services down, issue status summary, total business hours lost etc. Deliver an outstanding presentation on the topic using this Information Technology Expenditure Summary Dashboard Cyber Risk Assessment Dispense information and present a thorough explanation of Security Incidents, Costs And Revenue, Issue Status Summary using the slides given. This template can be altered and personalized to fit your needs. It is also available for immediate download. So grab it now.
-
 Information Technology Expenditure Summary Dashboard Creating Cyber Security Awareness
The following slide showcases the cyber security expense overview to better allocate budget. It includes elements such as IT cost, revenue, security incidents, services down, issue status summary, total business hours lost etc. Deliver an outstanding presentation on the topic using this Information Technology Expenditure Summary Dashboard Creating Cyber Security Awareness Dispense information and present a thorough explanation of Inadequate Security Guidelines, Inappropriate Privacy Policies, Insufficient Security Failure By Management using the slides given. This template can be altered and personalized to fit your needs. It is also available for immediate download. So grab it now.
-
 Global Information Technology Market Analysis Dashboard
This slide shows analytical report for global IT market. The purpose of this slide is to provide market regional insights to business leaders for technological decisions. It covers market size, regional analysis, key players and segmental overview of various IT services. Introducing our Global Information Technology Market Analysis Dashboard set of slides. The topics discussed in these slides are Global Information, Technology Market Analysis Dashboard. This is an immediately available PowerPoint presentation that can be conveniently customized. Download it and convince your audience.
-
 Information Technology Security Assessment Dashboard
This slide represents dashboard for information technology security assessment which includes elements such as intrusion attempts, mean resolve time, mean detect time, etc. Introducing our Information Technology Security Assessment Dashboard set of slides. The topics discussed in these slides are Intrusion Attempts, IT Security Rating, Phishing Test Success Rate. This is an immediately available PowerPoint presentation that can be conveniently customized. Download it and convince your audience.
-
 Infrastructure Monitoring Dashboard Information Technology Maintenance Ppt Styles Show
This slide covers the dashboard which can be used to monitor the server count, geo activity, processor, memory space, network security, etc. Deliver an outstanding presentation on the topic using this Infrastructure Monitoring Dashboard Information Technology Maintenance Ppt Styles Show. Dispense information and present a thorough explanation of Change Tracking, Assessment, Network Security using the slides given. This template can be altered and personalized to fit your needs. It is also available for immediate download. So grab it now.
-
 How We Built Our MRR Dashboard Information Technology MSPS
This slide covers the dashboard which will help the company to study the monthly recurring revenue of the organization.Present the topic in a bit more detail with this How We Built Our MRR Dashboard Information Technology MSPS. Use it as a tool for discussion and navigation on How We Built, Our MRR Dashboard. This template is free to edit as deemed fit for your organization. Therefore download it now.
-
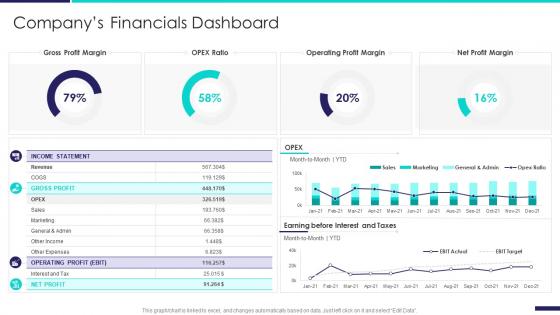 Company profile information technology companys financials dashboard snapshot
This graph or chart is linked to excel, and changes automatically based on data. Just left click on it and select Edit Data. Present the topic in a bit more detail with this Company Profile Information Technology Companys Financials Dashboard snapshot. Use it as a tool for discussion and navigation on Gross Profit Margin, OPEX Ratio, Operating Profit Margin, Net Profit Margin. This template is free to edit as deemed fit for your organization. Therefore download it now.
-
 Information Technology Dashboard Depicting User Activity
This slide shows information technology dashboard depicting user activity which can be referred by IT managers to track leads and make decisions. It includes information about sessions, signups, position, size, industry, customers, quality leads, etc. Introducing our Information Technology Dashboard Depicting User Activity set of slides. The topics discussed in these slides are Customers, Monthly Recurring Revenue, Quality Leads. This is an immediately available PowerPoint presentation that can be conveniently customized. Download it and convince your audience.
-
 Information Technology Dashboard For Server Performance Monitoring
This slide shows information technology dashboard for server performance monitoring which can be referred by technical heads to improve the working of servers. It includes information about server uptime and downtime, IT support, downtime issue, unsolved tickets, etc. Presenting our well structured Information Technology Dashboard For Server Performance Monitoring. The topics discussed in this slide are Information Technology Dashboard For Server Performance Monitoring. This is an instantly available PowerPoint presentation that can be edited conveniently. Download it right away and captivate your audience.
-
 Information Technology Dashboard Indicating Website Traffic Analysis
This slide shows information technology dashboard indicating website traffic analysis which can be beneficial for IT managers for making changes to drive more visitors into their websites. It includes information about locational sessions, bounce rate, medium classification, user vs new user, etc. Introducing our Information Technology Dashboard Indicating Website Traffic Analysis set of slides. The topics discussed in these slides are Bounce Rate, Medium Classification, Users Vs New Users. This is an immediately available PowerPoint presentation that can be conveniently customized. Download it and convince your audience.
-
 Information Technology Dashboard To Monitor Performance Of Technical Operations
This slide shows information technology dashboard to monitor performance of technical operations which can be referred by IT heads to control the backend working of resources. It contains information such as status of tickets, classification, customer, service level agreement, response, etc. Presenting our well structured Information Technology Dashboard To Monitor Performance Of Technical Operations. The topics discussed in this slide are Service Level Agreement Breach, Satisfaction Rate, Customer Wise Tickets. This is an instantly available PowerPoint presentation that can be edited conveniently. Download it right away and captivate your audience.
-
 Information Technology Project Management Dashboard
This slide shows information technology project management dashboard which can be referred by companies looking for efficient outlining and execution of project tasks. It contains information about planning, design, development, testing, project budget, overdue tasks, workload, tasks and deadlines. Introducing our Information Technology Project Management Dashboard set of slides. The topics discussed in these slides are Planning, Development, Testing. This is an immediately available PowerPoint presentation that can be conveniently customized. Download it and convince your audience.
-
 Information Technology System Dashboard For Monitoring Business Operations
This slide shows information technology system dashboard for monitoring business operations which can be beneficial for making decisions for their growth. It contains information about learning, internal, finance or customers and users. Presenting our well structured Information Technology System Dashboard For Monitoring Business Operations. The topics discussed in this slide are Learning, Finance And Customers, Users. This is an instantly available PowerPoint presentation that can be edited conveniently. Download it right away and captivate your audience.
-
 Information Technology System Dashboard With Visitors And Signups Information
This slide shows information technology system dashboard with visitors and signups information which can be beneficial for businesses to track and approach their leads. It includes information about page visits, new signups, rate of signups, month end signups, organic and paid signups, etc. Introducing our Information Technology System Dashboard With Visitors And Signups Information set of slides. The topics discussed in these slides are Information Technology System Dashboard With Visitors And Signups Information. This is an immediately available PowerPoint presentation that can be conveniently customized. Download it and convince your audience.
-
 KPI Dashboard For Informational Technology Department To Analyze Key Financials
This slide shows KPI dashboard for informational technology department to analyze key financials of companies which assists in decision making for growth. It also includes information about IT department ROI, expenditure vs Allocated budget, it cost breakdown and it expenditure vs Revenue. Presenting our well structured KPI Dashboard For Informational Technology Department To Analyze Key Financials. The topics discussed in this slide are Expenditure Vs Allocated Budget, IT Expenditure Vs Revenue, IT Cost Break Down. This is an instantly available PowerPoint presentation that can be edited conveniently. Download it right away and captivate your audience.
-
 KPI Dashboard For Measuring Information Technology Business Performance
This slide shows KPI dashboard for measuring information technology business performance which can be referred by technical organizations to analyze their annual performance. It includes information about monthly recurring revenue, customer acquisition cost, signups and paying customers, visitors and signups, runway, etc. Introducing our KPI Dashboard For Measuring Information Technology Business Performance set of slides. The topics discussed in these slides are Monthly Recurring Revenue, Customer Acquisition Cost, Monthly Growth. This is an immediately available PowerPoint presentation that can be conveniently customized. Download it and convince your audience.
-
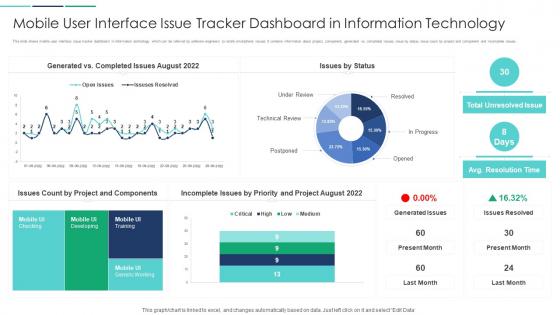 Mobile User Interface Issue Tracker Dashboard In Information Technology
This slide shows mobile user interface issue tracker dashboard in information technology which can be referred by software engineers to rectify smartphone issues. It contains information about project, component, generated vs completed issues, issue by status, issue count by project and component and incomplete issues. Presenting our well structured Mobile User Interface Issue Tracker Dashboard In Information Technology. The topics discussed in this slide are Mobile User Interface Issue Tracker Dashboard In Information Technology. This is an instantly available PowerPoint presentation that can be edited conveniently. Download it right away and captivate your audience.
-
 Information Technology Team Performance Management Dashboard
This slide shows IT team performance management dashboard. It provides information about person, design, research and development, testing, launch, timeline, etc. Introducing our Information Technology Team Performance Management Dashboard set of slides. The topics discussed in these slides are Information Technology Team Performance Management Dashboard. This is an immediately available PowerPoint presentation that can be conveniently customized. Download it and convince your audience.
-
 Dashboard For Information Technology Incident Risk Assessment SLA Warnings
This slide highlights detailed assessment of open incident and service requests by team and management for ensuring smooth operations of IT department. Presenting our well structured Dashboard For Information Technology Incident Risk Assessment SLA Warnings. The topics discussed in this slide are Dashboard For Information Technology Incident Risk Assessment SLA Warnings. This is an instantly available PowerPoint presentation that can be edited conveniently. Download it right away and captivate your audience.
-
 Corporate Dashboard Showing Information Technology Bugs And Project Accuracy Rate
This graph or chart is linked to excel, and changes automatically based on data. Just left click on it and select edit data. Introducing our Corporate Dashboard Showing Information Technology Bugs And Project Accuracy Rate set of slides. The topics discussed in these slides are Learning, Internal, Finance, Customers. This is an immediately available PowerPoint presentation that can be conveniently customized. Download it and convince your audience.
-
 Information Technology Infrastructure Library Itil It Dashboard For Itil Implementation
This slide depicts the implementation dashboard that covers the details of pending tickets, open incidents, SLA performance, survey results, top item categories, resolved tickets, and so on. Deliver an outstanding presentation on the topic using this Information Technology Infrastructure Library Itil It Dashboard For Itil Implementation. Dispense information and present a thorough explanation of Dashboard For ITIL Implementation using the slides given. This template can be altered and personalized to fit your needs. It is also available for immediate download. So grab it now.
-
 Information Technology Security Compliance Dashboard Snapshot For Information Technology Security
This slide depicts the cyber security compliance report on how data and hardware are monitored in different categories such as standard, regulation, and asset type control. Present the topic in a bit more detail with this Information Technology Security Compliance Dashboard Snapshot For Information Technology Security. Use it as a tool for discussion and navigation on Dashboard, Information, Technology. This template is free to edit as deemed fit for your organization. Therefore download it now.
-
 Information Technology Security Dashboard Snapshot Threat Tracking Information Technology Security
This slide depicts the dashboard for threat tracking in cyber security by covering monthly threat status, current risk status, threat-based on the role, threats by owners, risk by threats, and threat report. Present the topic in a bit more detail with this Information Technology Security Dashboard Threat Tracking Information Technology Security. Use it as a tool for discussion and navigation on Dashboard, Information, Technology. This template is free to edit as deemed fit for your organization. Therefore download it now.
-
 Financial Report Of An Information Technology Financials Dashboard
Present the topic in a bit more detail with this Financial Report Of An Information Technology Financials Dashboard. Use it as a tool for discussion and navigation on Companys Financials Dashboard. This template is free to edit as deemed fit for your organization. Therefore download it now.
-
 Dashboard For Edge Computing Tracking Distributed Information Technology
This slide depicts the edge computing dashboard to monitor the security of networks and devices in the organization by covering threat prevention and detection details. Deliver an outstanding presentation on the topic using this Dashboard For Edge Computing Tracking Distributed Information Technology. Dispense information and present a thorough explanation of Dashboard For Edge Computing Tracking using the slides given. This template can be altered and personalized to fit your needs. It is also available for immediate download. So grab it now.
-
 Information Technology Security Dashboard With Incident And Threat Management
This slide shows the dashboard of cyber security with incidents and threat management. It includes overall progress, risk identified , number of critical incidents, initiative , incident and threat management etc. Introducing our Information Technology Security Dashboard With Incident And Threat Management set of slides. The topics discussed in these slides are Threat Management, Incident Management, Critical Risks Identified. This is an immediately available PowerPoint presentation that can be conveniently customized. Download it and convince your audience.
-
 Dashboard Showing Information Technology Risk Management
This slide shows the dashboard that depicts the information technology risk management which focuses on the percentage of potential risks, risk analysis progress, response progress, risk rating breakdown with vulnerabilities such as encryption vulnerabilities, physical security , etc. Deliver an outstanding presentation on the topic using this Dashboard Showing Information Technology Risk Management. Dispense information and present a thorough explanation of Risk Rating Breakdown, Risk Heat Map, Action Plan Breakdown using the slides given. This template can be altered and personalized to fit your needs. It is also available for immediate download. So grab it now.
-
 Information Technology Project Analysis With KPI Dashboard
The following slide highlights various key performance indicators to ensure successful information technology IT project completion. It also includes components such as risks, status, budget, deadlines, average task handle time, overdue activities etc. Introducing our Information Technology Project Analysis With KPI Dashboard set of slides. The topics discussed in these slides are Planning Completed, Design Completed, Development, Testing Waiting. This is an immediately available PowerPoint presentation that can be conveniently customized. Download it and convince your audience.
-
 Metric Dashboard Snapshot To Measure Health Information Technology
This slide illustrates health information technology dashboard showcasing hospital KPIs. It covers indicators such as outpatient and inpatient trend, average waiting time, patient satisfaction etc. Presenting our well-structured Metric Dashboard Snapshot To Measure Health Information Technology. The topics discussed in this slide are Metric Dashboard, Measure, Health Information Technology. This is an instantly available PowerPoint presentation that can be edited conveniently. Download it right away and captivate your audience.
-
 F652 Security Automation In Information Technology Security Automation Dashboard Highlighting Phishing
This slide highlights the dashboard for security automation which includes total automations performed, hours saved, cost savings, records created, automation ratio, incidents by group and incident timeline. Present the topic in a bit more detail with this F652 Security Automation In Information Technology Security Automation Dashboard Highlighting Phishing. Use it as a tool for discussion and navigation on Automation, Dashboard, Phishing Alerts. This template is free to edit as deemed fit for your organization. Therefore download it now.
-
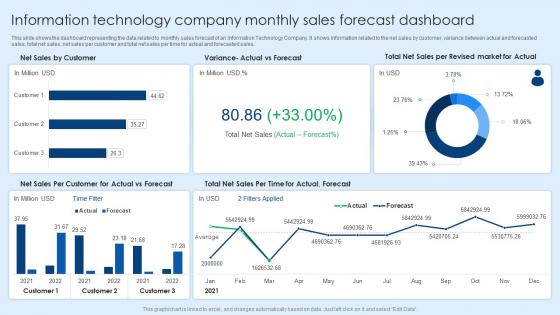 Information Technology Company Monthly Sales Forecast Dashboard
This slide shows the dashboard representing the data related to monthly sales forecast of an Information Technology Company. It shows information related to the net sales by customer, variance between actual and forecasted sales, total net sales, net sales per customer and total net sales per time for actual and forecasted sales. Introducing our Information Technology Company Monthly Sales Forecast Dashboard set of slides. The topics discussed in these slides are Information, Technology, Sales Forecast Dashboard. This is an immediately available PowerPoint presentation that can be conveniently customized. Download it and convince your audience.
-
 Security Automation Dashboard Highlighting Resolved Events Security Automation In Information Technology
This slide highlights the security automation dashboard which includes resolved events, mean dwell time, time and dollar saved, workload, events by status and top actions. Deliver an outstanding presentation on the topic using this Security Automation Dashboard Highlighting Resolved Events Security Automation In Information Technology. Dispense information and present a thorough explanation of Automation, Dashboard, Workload using the slides given. This template can be altered and personalized to fit your needs. It is also available for immediate download. So grab it now.
-
 IT Infrastructure Management Dashboard To Track Incidents Information Technology Infrastructure Library
This slide provides information regarding IT infrastructure management dashboard to track incidents, address servers performance, track unexpected problems, etc. Deliver an outstanding presentation on the topic using this IT Infrastructure Management Dashboard To Track Incidents Information Technology Infrastructure Library. Dispense information and present a thorough explanation of Percentage Unsolved, Thousand Endures, Support Employee using the slides given. This template can be altered and personalized to fit your needs. It is also available for immediate download. So grab it now.
-
 Overall IT Cost Management Dashboard Information Technology Infrastructure Library
This slide provides information regarding IT cost management dashboard to track IT costs breakdown, return on investment, budget monitoring, etc. Deliver an outstanding presentation on the topic using this Overall IT Cost Management Dashboard Information Technology Infrastructure Library. Dispense information and present a thorough explanation of Investment Department, Costs Revenue, Administration using the slides given. This template can be altered and personalized to fit your needs. It is also available for immediate download. So grab it now.
-
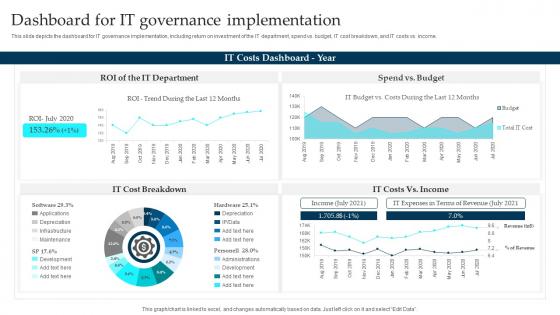 Dashboard For It Governance Implementation Enterprise Governance Of Information Technology EGIT
This slide depicts the dashboard for IT governance implementation, including return on investment of the IT department, spend vs. budget, IT cost breakdown, and IT costs vs income. Deliver an outstanding presentation on the topic using this Dashboard For It Governance Implementation Enterprise Governance Of Information Technology EGIT. Dispense information and present a thorough explanation of ROI Of The IT Department, IT Cost Breakdown, Spend Vs Budget using the slides given. This template can be altered and personalized to fit your needs. It is also available for immediate download. So grab it now.
-
 Information Technology Problem Management Dashboard
The following slide showcases IT problem management dashboard to minimize impact of issues on organization operations. It includes support requests, average hour spent to resolve issue, problem type and category. Introducing our Information Technology Problem Management Dashboard set of slides. The topics discussed in these slides are Information Technology, Problem Management, Dashboard. This is an immediately available PowerPoint presentation that can be conveniently customized. Download it and convince your audience.
-
 Information Technology Service Problem Management Dashboard
The following slide showcases IT service problem management dashboard that highlights recurrent incidents at workplace. It includes critical and resolved issues, problem by priority and new incidents. Presenting our well structured Information Technology Service Problem Management Dashboard. The topics discussed in this slide are Information Technology, Service Problem, Management Dashboard. This is an instantly available PowerPoint presentation that can be edited conveniently. Download it right away and captivate your audience.
-
 Dashboard For It Governance Implementation Corporate Governance Of Information Technology Cgit
This slide depicts the dashboard for IT governance implementation, including return on investment of the IT department, spend vs. Budget, IT cost breakdown, and IT costs vs. income. Deliver an outstanding presentation on the topic using this Dashboard For It Governance Implementation Corporate Governance Of Information Technology Cgit. Dispense information and present a thorough explanation of Governance, Implementation, Dashboard using the slides given. This template can be altered and personalized to fit your needs. It is also available for immediate download. So grab it now.
-
 Market Analysis Of Information Technology Financial Dashboard To Track Organization Expenses
The following slide showcases KPI dashboard which can be used by finance managers to evaluate financial health of company. Revenue, expenses, net profit, bills receivable, bills payable, quick ratio, current ratio are some of the major metrics which are outlined in the slide. Present the topic in a bit more detail with this Market Analysis Of Information Technology Financial Dashboard To Track Organization Expenses. Use it as a tool for discussion and navigation on Financial Dashboard, Track Organization Expenses, Expenses Budget. This template is free to edit as deemed fit for your organization. Therefore download it now.
-
 Market Analysis Of Information Technology Marketing Campaign Dashboard For B2B Marketers
The following slide showcases key performance indicator KPI dashboard that can assist managers to evaluate digital marketing campaign performance. The key metrics mentioned in the slide are click through rate CTR, conversion rate, cost per click CPC, etc. Present the topic in a bit more detail with this Market Analysis Of Information Technology Marketing Campaign Dashboard For B2B Marketers. Use it as a tool for discussion and navigation on Marketing Campaign, Dashboard, B2B Marketers. This template is free to edit as deemed fit for your organization. Therefore download it now.
-
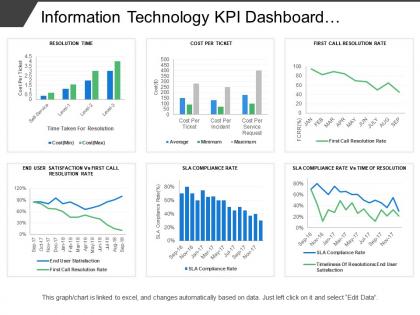 Information technology kpi dashboard showing cost per ticket sla compliance rate
Presenting this set of slides with name - Information Technology Kpi Dashboard Showing Cost Per Ticket Sla Compliance Rate. This is a six stage process. The stages in this process are Information Technology, It, Iot.
-
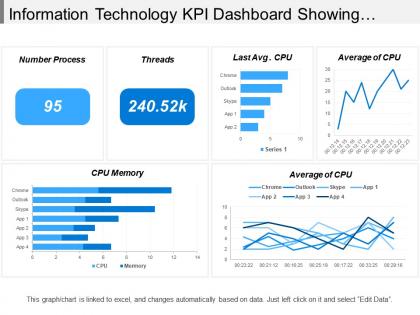 Information technology kpi dashboard showing cpu memory average of cpu
Presenting this set of slides with name - Information Technology Kpi Dashboard Showing Cpu Memory Average Of Cpu. This is a six stage process. The stages in this process are Information Technology, It, Iot.
-
 Information technology kpi dashboard showing downtime issues unsolved tickets
Presenting this set of slides with name - Information Technology Kpi Dashboard Showing Downtime Issues Unsolved Tickets. This is a four stage process. The stages in this process are Information Technology, It, Iot.
-
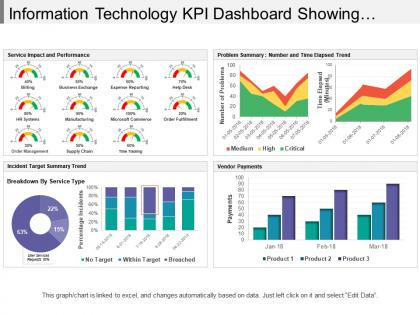 Information technology kpi dashboard showing incident target summary trend
Presenting this set of slides with name - Information Technology Kpi Dashboard Showing Incident Target Summary Trend. This is a five stage process. The stages in this process are Information Technology, It, Iot.
-
 Information technology kpi dashboard showing network traffic system availability
Presenting information technology KPI dashboard showing network traffic system PowerPoint template. Choice to view PowerPoint design in standard and widescreen view. Fully editable Presentation dashboards that can be edited as needed. Easy to download and insert in the ongoing presentation. Convertible into Jpeg and Pdf document. Suitable for managers, leaders, sales and marketing people, analysts, etc. Slides are designed using latest management tools and techniques. The high-resolution view is altogether an experience with a brilliant impact.
-
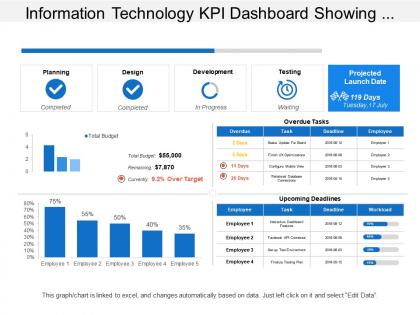 Information technology kpi dashboard showing overdue tasks deadlines
Introducing information technology KPI dashboard showing overdue tasks deadlines PowerPoint template. PPT slides offer a thorough editable customization of font, color, and orientation of high powered info-graphics. Quick and easy downloading process. Suitable for business managers and professionals. Sufficient space is available for the easy placement of desired content. Templates are compatible with wide range of software such as pdf/jpeg/Jpg. PPT design can be access in standard and widescreen view. Editing instructions are explained step by step.
-
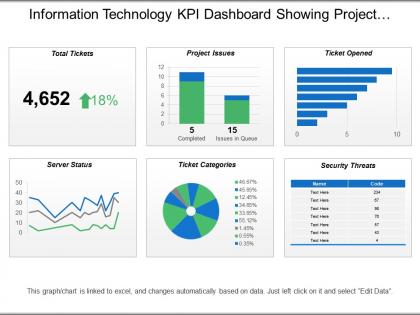 Information technology kpi dashboard showing project issues server status
Presenting this set of slides with name - Information Technology Kpi Dashboard Showing Project Issues Server Status. This is a six stage process. The stages in this process are Information Technology, It, Iot.
-
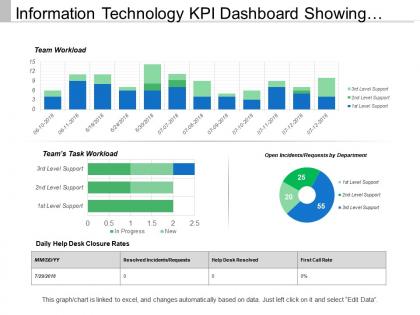 Information technology kpi dashboard showing team task workload
Presenting this set of slides with name - Information Technology Kpi Dashboard Showing Team Task Workload. This is a three stage process. The stages in this process are Information Technology, It, Iot.


