Powerpoint Templates and Google slides for Infograph
Save Your Time and attract your audience with our fully editable PPT Templates and Slides.
-
 Percentage circle visual for financial data analysis infographic template
This is our Percentage Circle Visual For Financial Data Analysis Infographic Template designed in PowerPoint, however, you can also access it in Google Slides. It comes in two aspect ratios standard and widescreen, with fully editable visual content.
-
 Circular progress bar diagram for business to business trading infographic template
This is a single slide titled Circular Progress Bar Diagram For Business To Business Trading Infographic Template. It is crafted using high quality vector based visuals that are 100 percent editable and available for immediate download in standard and widescreen aspect ratios.
-
 Circular progress bar diagram for exit strategy business plan infographic template
This is our Circular Progress Bar Diagram For Exit Strategy Business Plan Infographic Template designed in PowerPoint, however, you can also access it in Google Slides. It comes in two aspect ratios standard and widescreen, with fully editable visual content.
-
 Circular progress bar graphics for business customer satisfaction infographic template
Deploy our Circular Progress Bar Graphics For Business Customer Satisfaction Infographic Template to present high quality presentations. It is designed in PowerPoint and is available for immediate download in standard and widescreen sizes. Not only this, but this layout is also 100 percent editable, giving you full control over its applications.
-
 Circular progress bar graphics for marketing plans in strategic management infographic template
This is a single slide titled Circular Progress Bar Graphics For Marketing Plans In Strategic Management Infographic Template. It is crafted using high quality vector based visuals that are 100 percent editable and available for immediate download in standard and widescreen aspect ratios.
-
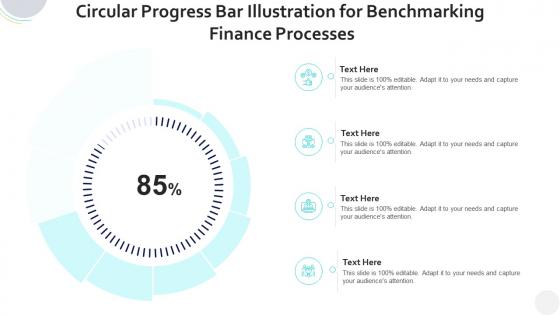 Circular progress bar illustration for benchmarking finance processes infographic template
This is our Circular Progress Bar Illustration For Benchmarking Finance Processes Infographic Template designed in PowerPoint, however, you can also access it in Google Slides. It comes in two aspect ratios standard and widescreen, with fully editable visual content.
-
 Circular progress bar infographics for build customer service approach template
Deploy our Circular Progress Bar Infographics For Build Customer Service Approach Template to present high quality presentations. It is designed in PowerPoint and is available for immediate download in standard and widescreen sizes. Not only this, but this layout is also 100 percent editable, giving you full control over its applications.
-
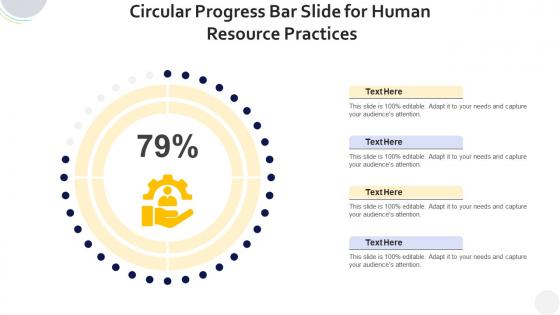 Circular progress bar slide for human resource practices infographic template
This is a single slide titled Circular Progress Bar Slide For Human Resource Practices Infographic Template. It is crafted using high quality vector based visuals that are 100 percent editable and available for immediate download in standard and widescreen aspect ratios.
-
 Circular progress bar slide for small business marketing ideas infographic template
This is our Circular Progress Bar Slide For Small Business Marketing Ideas Infographic Template designed in PowerPoint, however, you can also access it in Google Slides. It comes in two aspect ratios standard and widescreen, with fully editable visual content.
-
 Circular progress bar slide to focus on the existing customers infographic template
Deploy our Circular Progress Bar Slide To Focus On The Existing Customers Infographic Template to present high quality presentations. It is designed in PowerPoint and is available for immediate download in standard and widescreen sizes. Not only this, but this layout is also 100 percent editable, giving you full control over its applications.
-
 Circular progress bar visual for forecasting expected results infographic template
This is a single slide titled Circular Progress Bar Visual For Forecasting Expected Results Infographic Template. It is crafted using high quality vector based visuals that are 100 percent editable and available for immediate download in standard and widescreen aspect ratios.
-
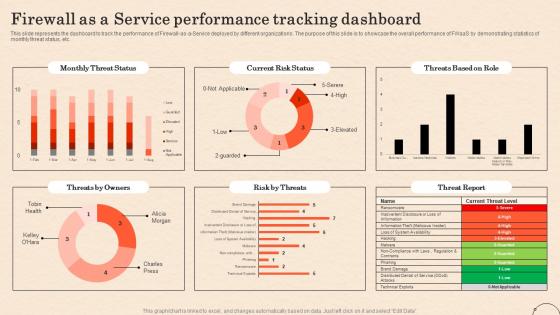 Firewall As A Service Performance Tracking Dashboard Ppt Infographic Template Outline
This slide represents the dashboard to track the performance of Firewall-as-a-Service deployed by different organizations. The purpose of this slide is to showcase the overall performance of FWaaS by demonstrating statistics of monthly threat status, etc. Deliver an outstanding presentation on the topic using this Firewall As A Service Performance Tracking Dashboard Ppt Infographic Template Outline. Dispense information and present a thorough explanation of Dashboard To Track, Firewall As A Service, Performance Of Fwaas, Demonstrating Statistics using the slides given. This template can be altered and personalized to fit your needs. It is also available for immediate download. So grab it now.
-
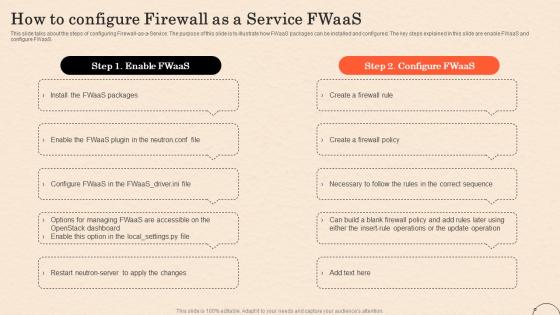 How To Configure Firewall As A Service Fwaas Ppt Infographic Template Good
This slide talks about the steps of configuring Firewall-as-a-Service. The purpose of this slide is to illustrate how FWaaS packages can be installed and configured. The key steps explained in this slide are enable FWaaS and configure FWaaS. Increase audience engagement and knowledge by dispensing information using How To Configure Firewall As A Service Fwaas Ppt Infographic Template Good. This template helps you present information on ten stages. You can also present information on Fwaas Packages, Installed And Configured, Fwaas And Configure Fwaas, Firewall As A Service Fwaas using this PPT design. This layout is completely editable so personaize it now to meet your audiences expectations.
-
 Table Of Contents For Understanding Human Workplace Behavior Ppt Ideas Infographic Template
Introducing Table Of Contents For Understanding Human Workplace Behavior Ppt Ideas Infographic Template to increase your presentation threshold. Encompassed with seven stages, this template is a great option to educate and entice your audience. Dispence information on Management Of Organizational Behaviour Summary, Organizational Behaviour Model, Role Of Manager In Organizational, Significance Of Learning In Organizational, using this template. Grab it now to reap its full benefits.
-
 Series A Investor Funding Elevator Key Facts Ppt File Infographic Template
This slide covers key facts related to real estate sector based on houses sold annually, median sales prices, realtor commission received. The purpose of this template is to provide an overview on massiveness of real estate market as compared with used autos, food segments along with fragmented incumbents, etc. Deliver an outstanding presentation on the topic using this Series A Investor Funding Elevator Key Facts Ppt File Infographic Template. Dispense information and present a thorough explanation of Median Sales Price, Real Estate Market, Food Segments, Fragmented Incumbents using the slides given. This template can be altered and personalized to fit your needs. It is also available for immediate download. So grab it now.
-
 Table Of Contents For Organizational Behavior Theory Ppt Infographic Template Guide
Increase audience engagement and knowledge by dispensing information using Table Of Contents For Organizational Behavior Theory Ppt Infographic Template Guide. This template helps you present information on seven stages. You can also present information on Organizational Behavior Summary, Organizational Behavior Model, Organizational Behavior Management, Personality, Motivation And Perception using this PPT design. This layout is completely editable so personaize it now to meet your audiences expectations.
-
 Snowflake Company Profile Cash Flows Ppt Infographics CP SS
The following slide shows cash inflows and outflows of Spotify company for five consecutive financial years i.e. from financial year ending 2021 to 2023. It highlights cash flow from operating, investing and financing activities. Deliver an outstanding presentation on the topic using this Snowflake Company Profile Cash Flows Ppt Infographics CP SS. Dispense information and present a thorough explanation of Cash Flows using the slides given. This template can be altered and personalized to fit your needs. It is also available for immediate download. So grab it now.
-
 Table Of Contents For ChatGPT V2 Ppt Infographic Template Files
Introducing Table Of Contents For ChatGPT V2 Ppt Infographic Template Files to increase your presentation threshold. Encompassed with five stages, this template is a great option to educate and entice your audience. Dispence information on Marketing And Advertisement, Banking And Finance, Entertainment Industry, Cyber Crimes Prevention, using this template. Grab it now to reap its full benefits.
-
 Ashok Leyland Company Profile Dividend Per Share Ppt Infographics CP SS
The following slide showcases dividends paid by Ashok Leyland company to its shareholders for five consecutive years i.e. from FY2018-19 to FY2022-23. It outlines the value of profits attribute to shareholders based on face value. Deliver an outstanding presentation on the topic using this Ashok Leyland Company Profile Dividend Per Share Ppt Infographics CP SS. Dispense information and present a thorough explanation of Ashok Leyland using the slides given. This template can be altered and personalized to fit your needs. It is also available for immediate download. So grab it now.
-
 Fashion Company Profile Key Facts Ppt Infographics CP SS
The following slide highlights various stats about a fashion retail company. It consists of its key strategic metrics such as active customers, total orders, total visits and average order frequency. Present the topic in a bit more detail with this Fashion Company Profile Key Facts Ppt Infographics CP SS. Use it as a tool for discussion and navigation on Active Customers, Average Order Frequency. This template is free to edit as deemed fit for your organization. Therefore download it now.
-
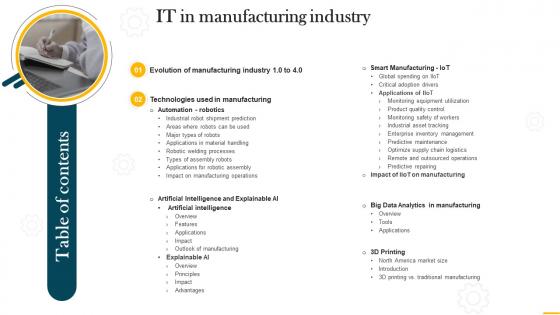 Table Of Contents For IT In Manufacturing Industry V2 Ppt Infographic Template Inspiration
Introducing Table Of Contents For IT In Manufacturing Industry V2 Ppt Infographic Template Inspiration to increase your presentation threshold. Encompassed with two stages, this template is a great option to educate and entice your audience. Dispence information on Artificial Intelligence, Technologies Used In Manufacturing, Evolution Of Manufacturing Industry, using this template. Grab it now to reap its full benefits.
-
 Before Vs After Secops V2 Implementation Ppt Infographics Inspiration
This slide represents the impact of the successful implementation of SecOps in the organization by showing the reduced number of malware attacks on departments. The purpose of this slide is to highlight the reduced number of malware attacks on different departments after implementing SecOps. Present the topic in a bit more detail with this Before Vs After Secops V2 Implementation Ppt Infographics Inspiration. Use it as a tool for discussion and navigation on Malware Attacks On Departments, Spyware Attacks, Secops Implementation. This template is free to edit as deemed fit for your organization. Therefore download it now.
-
 Secops V2 Problems With Current Network System Ppt Infographics Outline
This slide represents the severity level of application vulnerabilities and the number of total attacks. The purpose of this slide is to showcase the various threats caused by security vulnerabilities. The main threats include sensitive data leakage, unauthorized access to data and apps, and so on. Deliver an outstanding presentation on the topic using this Secops V2 Problems With Current Network System Ppt Infographics Outline. Dispense information and present a thorough explanation of Application Vulnerabilities, Security Vulnerabilities, Sensitive Data Leakage using the slides given. This template can be altered and personalized to fit your needs. It is also available for immediate download. So grab it now.
-
 Swiggy Company Profile Profit Loss Ppt Infographics CP SS
The slide showcase profit and loss of Swiggy company. It includes profit loss in crores and key insights. Present the topic in a bit more detail with this Swiggy Company Profile Profit Loss Ppt Infographics CP SS. Use it as a tool for discussion and navigation on Profit Loss. This template is free to edit as deemed fit for your organization. Therefore download it now.
-
 Table Of Contents Hybrid Wan Ppt Powerpoint Presentation Infographics Example
Increase audience engagement and knowledge by dispensing information using Table Of Contents Hybrid Wan Ppt Powerpoint Presentation Infographics Example. This template helps you present information on eight stages. You can also present information on Sd Wan Overview, Sd Wan Importance using this PPT design. This layout is completely editable so personaize it now to meet your audiences expectations.
-
 Table Of Contents For Emerging Technologies Ppt Powerpoint Presentation Infographics Grid
Introducing Table Of Contents For Emerging Technologies Ppt Powerpoint Presentation Infographics Grid to increase your presentation threshold. Encompassed with five stages, this template is a great option to educate and entice your audience. Dispence information on Latest Technologies, Quantum Computing, using this template. Grab it now to reap its full benefits.
-
 Case Study Serverless Computing V2 System Ppt Ideas Infographic Template
This slide represents a case study on serverless computing proposed by Centizen. The purpose of this slide is to discuss the background, challenges and solution provided by the company. This slide also outlines the business values as a outcome of the provided solution. Deliver an outstanding presentation on the topic using this Case Study Serverless Computing V2 System Ppt Ideas Infographic Template. Dispense information and present a thorough explanation of Serverless Computing System, Monitoring Or Debugging, Streaming Mobile Application using the slides given. This template can be altered and personalized to fit your needs. It is also available for immediate download. So grab it now.
-
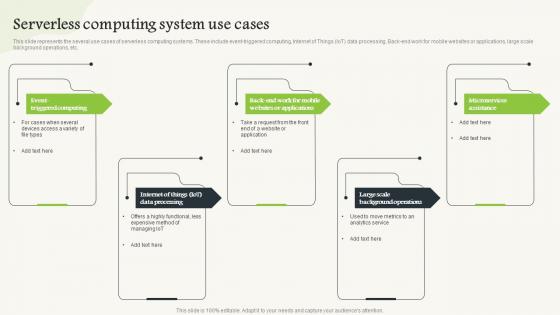 Serverless Computing V2 System Use Cases Ppt Infographic Template Infographic Template
This slide represents the several use cases of serverless computing systems. These include event-triggered computing, Internet of Things IoT data processing, Back-end work for mobile websites or applications, large scale background operations, etc. Introducing Serverless Computing V2 System Use Cases Ppt Infographic Template Infographic Template to increase your presentation threshold. Encompassed with five stages, this template is a great option to educate and entice your audience. Dispence information on Event Triggered Computing, Microservices Assistance, Large Scale Background Operations, using this template. Grab it now to reap its full benefits.
-
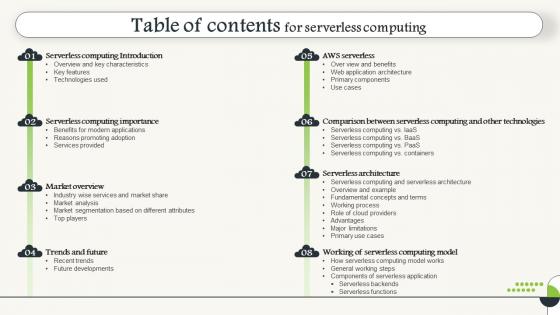 Table Of Contents For Serverless Computing V2 Ppt Infographic Template Pictures
Introducing Table Of Contents For Serverless Computing V2 Ppt Infographic Template Pictures to increase your presentation threshold. Encompassed with eight stages, this template is a great option to educate and entice your audience. Dispence information on Serverless Computing Importance, Serverless Architecture, Serverless Computing Introduction, Serverless Application, using this template. Grab it now to reap its full benefits.
-
 Industrial Robots V2 Applications In Different Areas Ppt Infographic Template Deck
The purpose of this slide is to justify the huge investments made by industries in robotics and automation. The applications of industrial robots are product assembly, non-conventional machining, palletizing and depalletizing, welding, painting and coating. Deliver an outstanding presentation on the topic using this Industrial Robots V2 Applications In Different Areas Ppt Infographic Template Deck. Dispense information and present a thorough explanation of Painting And Coating, Palletizing And Depalletizing, Product Assembly, Robots Applications using the slides given. This template can be altered and personalized to fit your needs. It is also available for immediate download. So grab it now.
-
 Table Of Contents For Industrial Robots V2 Ppt Infographic Template Icon
Introducing Table Of Contents For Industrial Robots V2 Ppt Infographic Template Icon to increase your presentation threshold. Encompassed with five stages, this template is a great option to educate and entice your audience. Dispence information on Industrial Robot Applications, Industrial Robots Challenges, Industrial Robots Introduction, Industrial Robots Market Overview And Trends, using this template. Grab it now to reap its full benefits.
-
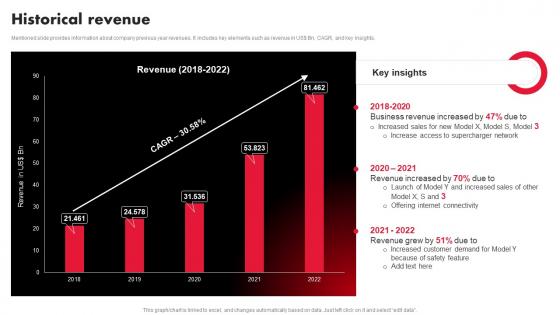 Tesla Company Profile Historical Revenue Ppt Infographics CP SS
Mentioned slide provides information about company previous year revenues. It includes key elements such as revenue in US dollar Bn, CAGR, and key insights. Present the topic in a bit more detail with this Tesla Company Profile Historical Revenue Ppt Infographics CP SS. Use it as a tool for discussion and navigation on Business, Revenue, Supercharger. This template is free to edit as deemed fit for your organization. Therefore download it now.
-
 Revenue Split By Ownership Mcdonalds Company Profile Ppt Infographics
Mentioned slide provides insights into business revenue distribution by restaurant ownership type. It includes revenue from company operated restaurant, franchises, and others. Deliver an outstanding presentation on the topic using this Revenue Split By Ownership Mcdonalds Company Profile Ppt Infographics. Dispense information and present a thorough explanation of Revenue Bifurcation, Ownership Type using the slides given. This template can be altered and personalized to fit your needs. It is also available for immediate download. So grab it now.
-
 Table Of Contents For Confidential Computing V2 Ppt Infographics Demonstration
Introducing Table Of Contents For Confidential Computing V2 Ppt Infographics Demonstration to increase your presentation threshold. Encompassed with six stages, this template is a great option to educate and entice your audience. Dispence information on Confidential Computing Overview, Confidential Computing Hardware, Technologies Overview, Confidential Computing Consortium, using this template. Grab it now to reap its full benefits.
-
 Financial Comparison Airbnb Company Profile Ppt Infographics CP SS
Mentioned slide showcases comparative analysis of multiple traveling and lodging companies comparison on financial parameters such as revenue, operating profit and net profit. Deliver an outstanding presentation on the topic using this Financial Comparison Airbnb Company Profile Ppt Infographics CP SS. Dispense information and present a thorough explanation of Revenue, Net Profit using the slides given. This template can be altered and personalized to fit your needs. It is also available for immediate download. So grab it now.
-
 Liabilities And Shareholder Equity Airbnb Company Profile Ppt Infographics CP SS
Mentioned slide provides insights into about company balance sheet. It includes key elements such as total liabilities and total shareholders equity. Deliver an outstanding presentation on the topic using this Liabilities And Shareholder Equity Airbnb Company Profile Ppt Infographics CP SS. Dispense information and present a thorough explanation of Total Liabilities, Shareholders Equity using the slides given. This template can be altered and personalized to fit your needs. It is also available for immediate download. So grab it now.
-
 Research And Development Expenses Airbnb Company Profile Ppt Infographics CP SS
Mentioned slide demonstrates business spending on product development. It includes yearly RandD expenses, expenses as a revenue percentage and key takeaways. Present the topic in a bit more detail with this Research And Development Expenses Airbnb Company Profile Ppt Infographics CP SS. Use it as a tool for discussion and navigation on Research And Development Expenses. This template is free to edit as deemed fit for your organization. Therefore download it now.
-
 Infographic Showing KPIs To Track And Manage Various Projects
This slide covers an infographic showing the management of more than projects. This slide highlights the main KPIs that help track projects that work simultaneously in an organization. It includes project progress and a comparison of actual and planned hours.Introducing our Infographic Showing KPIs To Track And Manage Various Projects set of slides. The topics discussed in these slides are Resource Collection, Team Building, Planned Actual. This is an immediately available PowerPoint presentation that can be conveniently customized. Download it and convince your audience.
-
 Table Of Contents For Cloud WAN Ppt Infographics
Increase audience engagement and knowledge by dispensing information using Table Of Contents For Cloud WAN Ppt Infographics. This template helps you present information on eight stages. You can also present information on Service, Architecture, Improve using this PPT design. This layout is completely editable so personaize it now to meet your audiences expectations.
-
 Tech Company Profile Gross Profit Ppt Infographics CP SS
This slide showcases the gross profit of tech company. It measures the money your goods or services earned after subtracting the total costs to produce and sell them. Present the topic in a bit more detail with this Tech Company Profile Gross Profit Ppt Infographics CP SS. Use it as a tool for discussion and navigation on Gross Profit. This template is free to edit as deemed fit for your organization. Therefore download it now.
-
 Table Of Contents For Muslim Banking Ppt Ideas Infographic Template Fin SS V
Introducing Table Of Contents For Muslim Banking Ppt Ideas Infographic Template Fin SS V to increase your presentation threshold. Encompassed with five stages, this template is a great option to educate and entice your audience. Dispence information on Islamic Economic System, Islamic And Conventional Banking, Islamic Banking And Financing, using this template. Grab it now to reap its full benefits.
-
 Honda Company Profile Asia Ppt Slides Infographic Template CP SS
The following slide showcases details of revenue from sales of Honda company in Asia regions through all business segments. It highlights details of five consecutive financial years i.e. from 2018 to 2022. Present the topic in a bit more detail with this Honda Company Profile Asia Ppt Slides Infographic Template CP SS. Use it as a tool for discussion and navigation on Business Segments, Consecutive Financial, Revenue. This template is free to edit as deemed fit for your organization. Therefore download it now.
-
 Financial Performance IFL Intel Company Profile Ppt Infographics CP SS
This slide showcases the financial performance of IFL Intel foundry services segment. It includes IFL total revenue and its operating income. Present the topic in a bit more detail with this Financial Performance IFL Intel Company Profile Ppt Infographics CP SS. Use it as a tool for discussion and navigation on Financial Performance. This template is free to edit as deemed fit for your organization. Therefore download it now.
-
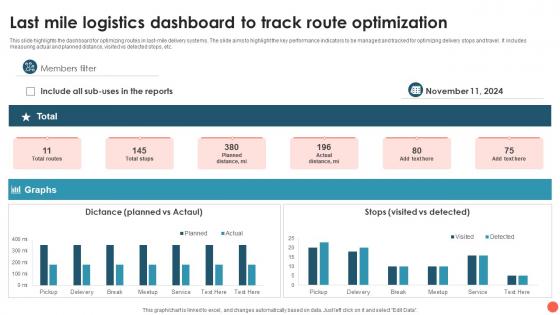 Last Mile Logistics Dashboard To Track Route Optimization Infographic Template Visual Aids
This slide highlights the dashboard for optimizing routes in last mile delivery systems. The slide aims to highlight the key performance indicators to be managed and tracked for optimizing delivery stops and travel. It includes measuring actual and planned distance, visited vs detected stops, etc. Presenting our well structured Last Mile Logistics Dashboard To Track Route Optimization Infographic Template Visual Aids. The topics discussed in this slide are Include Logistics Dashboard, Distance, Stops. This is an instantly available PowerPoint presentation that can be edited conveniently. Download it right away and captivate your audience.
-
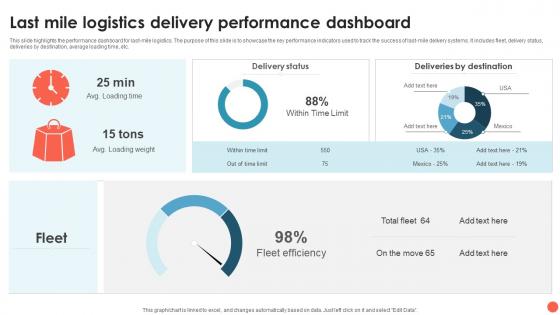 Last Mile Logistics Delivery Performance Dashboard Infographic Template Inspiration
This slide highlights the performance dashboard for last mile logistics. The purpose of this slide is to showcase the key performance indicators used to track the success of last mile delivery systems. It includes fleet, delivery status, deliveries by destination, average loading time, etc. Introducing our Last Mile Logistics Delivery Performance Dashboard Infographic Template Inspiration set of slides. The topics discussed in these slides are Delivery Status, Deliveries By Destination, Fleet Efficiency. This is an immediately available PowerPoint presentation that can be conveniently customized. Download it and convince your audience.
-
 Statistical Share Of Various Last Mile Logistics Challenges Infographic Template Example
This slide highlights the major challenges of last mile logistics. The purpose of this slide is to showcase the percentage of different problems of last mile logistics. It includes delivery efficiency, margins, customer demands, costs, end customer interaction, etc. Introducing our Statistical Share Of Various Last Mile Logistics Challenges Infographic Template Example set of slides. The topics discussed in these slides are Statistical Share, Biggest Challenge, Last Mile Deliveries. This is an immediately available PowerPoint presentation that can be conveniently customized. Download it and convince your audience.
-
 Total Deals Alibaba Company Profile Ppt Infographics CP SS
This slide showcases the total number of deals done by Alibaba. It includes total number of deals in five years and also the total value of deals in every year. Present the topic in a bit more detail with this Total Deals Alibaba Company Profile Ppt Infographics CP SS. Use it as a tool for discussion and navigation on Number Of Deals, Deal Value. This template is free to edit as deemed fit for your organization. Therefore download it now.
-
 Financial Projections Pfizer Business Model Ppt File Infographics BMC SS
This slide presents the financial projections showcasing the company anticipated growth, net income, cost, and risk. The predictions are based on comprehensive market analysis and historical performance. Deliver an outstanding presentation on the topic using this Financial Projections Pfizer Business Model Ppt File Infographics BMC SS. Dispense information and present a thorough explanation of Financial Projections, Comprehensive Market Analysis, Historical Performance using the slides given. This template can be altered and personalized to fit your needs. It is also available for immediate download. So grab it now.
-
 Revenue Model Business Model Of Shopify Ppt File Infographics BMC SS
This slide showcases the revenue steam of the company including earning from subscription-based solutions, and merchant solutions contributing to financial success. Deliver an outstanding presentation on the topic using this Revenue Model Business Model Of Shopify Ppt File Infographics BMC SS. Dispense information and present a thorough explanation of Payment Processing Services, Shipping Fulfilment Services, Financial Success, Merchants Services using the slides given. This template can be altered and personalized to fit your needs. It is also available for immediate download. So grab it now.
-
 Financial Projections Gojeks Business Model Ppt File Infographics BMC SS
This slide presents the financial projections showcasing the company anticipated revenue growth, cost, net income. The predictions are based on comprehensive market analysis and historical performance. Present the topic in a bit more detail with this Financial Projections Gojeks Business Model Ppt File Infographics BMC SS. Use it as a tool for discussion and navigation on Financial Projections, Comprehensive Market Analysis, Historical Performance. This template is free to edit as deemed fit for your organization. Therefore download it now.
-
 Net Profit Ppt Infographics Huawei Company Profile CP SS
The slide showcases the net income loss earned by Huawei company for five consecutive years i.e. from FY2018 to FY2022, which is the profit loss business is left with after deducting all costs, allowances, and taxes. Present the topic in a bit more detail with this Net Profit Ppt Infographics Huawei Company Profile CP SS. Use it as a tool for discussion and navigation on Expenses, Finance, Income. This template is free to edit as deemed fit for your organization. Therefore download it now.
-
 Alibaba Business Model Financial Projection Ppt File Infographics BMC SS
This slide presents the financial projections showcasing company anticipated growth. The projections are based on comprehensive market analysis and historical performance. Present the topic in a bit more detail with this Alibaba Business Model Financial Projection Ppt File Infographics BMC SS. Use it as a tool for discussion and navigation on Financial Projection, Comprehensive Market Analysis, Historical Performance, Compound Annual Growth Rate. This template is free to edit as deemed fit for your organization. Therefore download it now.
-
 Table Of Contents For Edtech Industry Report Ppt Infographic Template Deck IR SS
Increase audience engagement and knowledge by dispensing information using Table Of Contents For Edtech Industry Report Ppt Infographic Template Deck IR SS. This template helps you present information on eight stages. You can also present information on Competitive Landscape, Industry Segmentation, Blueprint Of Global Edtech Industry, Statistics Associated using this PPT design. This layout is completely editable so personaize it now to meet your audiences expectations.
-
 Zara Company Profile Competitors Financial Comparison Ppt Infographics CP SS
The slide showcase Zara competitors financial comparison. It includes revenue comparison brand valuation comparison and brand such as Zara, HandM, PVH, zalando etc. Present the topic in a bit more detail with this Zara Company Profile Competitors Financial Comparison Ppt Infographics CP SS. Use it as a tool for discussion and navigation on Competitors Financial Comparison. This template is free to edit as deemed fit for your organization. Therefore download it now.
-
 Gross Profit E Commerce Company Profile Ppt Infographics CP SS
This slide displays information about company gross profit for the last 5 years. It includes key elements such as gross profit, and key insights. Present the topic in a bit more detail with this Gross Profit E Commerce Company Profile Ppt Infographics CP SS. Use it as a tool for discussion and navigation on Gross Income. This template is free to edit as deemed fit for your organization. Therefore download it now.
-
 Table Of Contents CASB Cloud Security Ppt Infographic Template Gallery
Increase audience engagement and knowledge by dispensing information using Table Of Contents CASB Cloud Security Ppt Infographic Template Gallery. This template helps you present information on six stages. You can also present information on Cloud Access Security Broker, Shadow IT Management Lifecycle, Emerging Cloud Security Risks using this PPT design. This layout is completely editable so personaize it now to meet your audiences expectations.
-
 Revenue By Line Of Services Pwc Company Profile Ppt Infographic Backgrounds CP SS
This slide showcases the revenue by line of services. It is the money that is produced by carrying out normal business operations and is calculated by multiplying the average sales price by the number of items sold. Deliver an outstanding presentation on the topic using this Revenue By Line Of Services Pwc Company Profile Ppt Infographic Backgrounds CP SS Dispense information and present a thorough explanation of Assurance Revenue, Advisory Revenue, Tax Revenue using the slides given. This template can be altered and personalized to fit your needs. It is also available for immediate download. So grab it now.
-
 Distribution Strategy Iphone Company Profile Ppt Infographics Styles CP SS V
Following slide provides information about Apple distribution strategy . It includes information about subcategories of distribution channels, Apple sales split, advantages, and key insights. Present the topic in a bit more detail with this Distribution Strategy Iphone Company Profile Ppt Infographics Styles CP SS V Use it as a tool for discussion and navigation on Sales Channels, Indirect, Direct This template is free to edit as deemed fit for your organization. Therefore download it now.
-
 Earning Per Share Amazon Company Profile Ppt Infographic Template Styles CP SS
The following slide outlines earning per share of Amazon business which assists investors to determine whether investing in company will yield maximized profits or not. Present the topic in a bit more detail with this Earning Per Share Amazon Company Profile Ppt Infographic Template Styles CP SS Use it as a tool for discussion and navigation on Earning Per Share This template is free to edit as deemed fit for your organization. Therefore download it now.
-
 Net Profit Tata Motors Company Profile Ppt Infographics Sample CP SS
This slide showcases the net income of Intel. It is the amount of profit or earnings a company has generated over a specific period after deducting all expenses, taxes, and other costs. Present the topic in a bit more detail with this Net Profit Tata Motors Company Profile Ppt Infographics Sample CP SS Use it as a tool for discussion and navigation on Net Profit This template is free to edit as deemed fit for your organization. Therefore download it now.


