Powerpoint Templates and Google slides for Indicating Data
Save Your Time and attract your audience with our fully editable PPT Templates and Slides.
-
 Delete Icon Database Business Indicating Presentation Sensitive
This complete deck covers various topics and highlights important concepts. It has PPT slides which cater to your business needs. This complete deck presentation emphasizes Delete Icon Database Business Indicating Presentation Sensitive and has templates with professional background images and relevant content. This deck consists of total of twelve slides. Our designers have created customizable templates, keeping your convenience in mind. You can edit the colour, text and font size with ease. Not just this, you can also add or delete the content if needed. Get access to this fully editable complete presentation by clicking the download button below.
-
 Key Indicator Dashboard For IOT Data Visualization
This slide represents IOT data visualization key indicator dashboard. This slide includes traffic loops, speed of cars average, patterns as per weekly and hourly and date wise traffic density low or high. Introducing our Key Indicator Dashboard For IOT Data Visualization set of slides. The topics discussed in these slides are Key Benefits With Data Visualization In IOT. This is an immediately available PowerPoint presentation that can be conveniently customized. Download it and convince your audience.
-
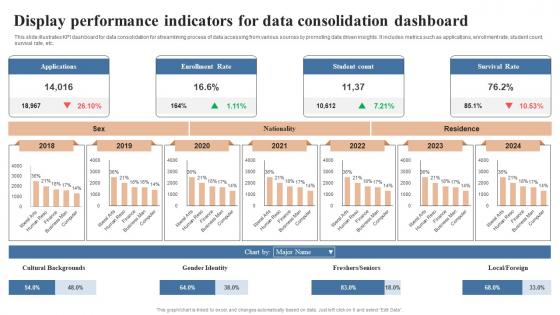 Display Performance Indicators For Data Consolidation Dashboard
This slide illustrates KPI dashboard for data consolidation for streamlining process of data accessing from various sources by promoting data driven insights. It includes metrics such as applications, enrollment rate, student count, survival rate, etc. Introducing our Display Performance Indicators For Data Consolidation Dashboard set of slides. The topics discussed in these slides are Applications, Enrollment Rate, Survival Rate This is an immediately available PowerPoint presentation that can be conveniently customized. Download it and convince your audience.
-
 Icon Indicating Data Growth With Laptop
Presenting our set of slides with Icon Indicating Data Growth With Laptop. This exhibits information on three stages of the process. This is an easy to edit and innovatively designed PowerPoint template. So download immediately and highlight information on Icon Indicating, Data Growth With Laptopv.
-
 Proposed Data Classification Levels To Indicate Degree Of Sensitivity
This slide presents four levels of data classification to manage risks of data losses and protect sensitive data. It covers description and examples of four major levels that are public, internal, confidential and restricted. Introducing our Proposed Data Classification Levels To Indicate Degree Of Sensitivity set of slides. The topics discussed in these slides are Contractual Information, Unpublished Research Data, Organizational Charts. This is an immediately available PowerPoint presentation that can be conveniently customized. Download it and convince your audience.
-
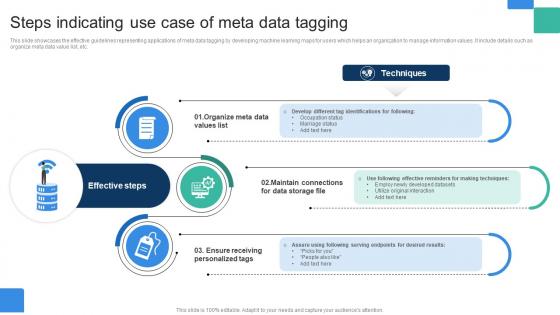 Steps Indicating Use Case Of Meta Data Tagging
This slide showcases the effective guidelines representing applications of meta data tagging by developing machine learning maps for users which helps an organization to manage information values. It include details such as organize meta data value list, etc. Introducing our premium set of slides with name Steps Indicating Use Case Of Meta Data Tagging. Ellicudate the three stages and present information using this PPT slide. This is a completely adaptable PowerPoint template design that can be used to interpret topics like Organize Meta Data,Effective Steps, Techniques. So download instantly and tailor it with your information.
-
 Data Privacy Project Key Performance Indicators
The purpose of this slide is to showcase how data privacy project key performance indicators quantifiably measure and enhance the effectiveness of data privacy initiatives, ensuring compliance and robust data protection. Introducing our Data Privacy Project Key Performance Indicators set of slides. The topics discussed in these slides are Kpi Category, Key Performance Indicator, Measurement Metric, Target Or Threshold. This is an immediately available PowerPoint presentation that can be conveniently customized. Download it and convince your audience.
-
 Data Migration Dashboard Snapshot Indicating Project And Provision Status
This slide showcase data migration best practices dashboard snapshot indicating overall project and provision status. It contains information about contains user, group and resource provision status. Presenting our well structured Data Migration Dashboard Indicating Project And Provision Status. The topics discussed in this slide are Data Migration Status, Overall Project Status, Resource Provision Status. This is an instantly available PowerPoint presentation that can be edited conveniently. Download it right away and captivate your audience.
-
 Crowdfunding Platforms Data Indicating Equity And Debt Raised For Real Estate
This slide exhibits crowdfunding platforms data indicating equity and debt raised for real estate. It includes information about platforms and amount collected which can be referred by investors to choose best platforms to gain maximum ROI. Presenting our well-structured Crowdfunding Platforms Data Indicating Equity And Debt Raised For Real Estate. The topics discussed in this slide are Crowdfunding Platforms, Data Indicating Equity, Debt Raised For Real Estate. This is an instantly available PowerPoint presentation that can be edited conveniently. Download it right away and captivate your audience.
-
 Data Profiling Dashboard Snapshot Indicating Row And Column Analysis
This slide illustrates data profiling dashboard snapshot indicating row and column analysis which can be referred by IT managers to maintain quality and consistency of data. It contains information about reports, checking, evaluation, overview, comparative, etc.Presenting our well structured Data Profiling Dashboard Indicating Row And Column Analysis. The topics discussed in this slide are Evaluation, Overview, Functional. This is an instantly available PowerPoint presentation that can be edited conveniently. Download it right away and captivate your audience.
-
 SQL Server Data Profiling Dashboard Indicating Business Intelligence Analytics
This slide showcase structured query language SQL server data profiling dashboard indicating business intelligence analytics which can be referred by IT managers to manage and allocate data sets. It includes information about tables, columns, elements, etc.Introducing our SQL Server Data Profiling Dashboard Indicating Business Intelligence Analytics set of slides. The topics discussed in these slides are Abbreviations, Column And Elements, Shortest Columns This is an immediately available PowerPoint presentation that can be conveniently customized. Download it and convince your audience.
-
 Data Quality Performance Indicator Dashboard
This slide covers data quality performance indicator dashboard. It involves details such as data weight percentage, number of records, total expectations, data quality trend and target. Presenting our well structured Data Quality Performance Indicator Dashboard. The topics discussed in this slide are Event Type, Event Subtype, Event Time, Advertiser Id. This is an instantly available PowerPoint presentation that can be edited conveniently. Download it right away and captivate your audience.
-
 Nl three steps for data flow indication powerpoint temptate
Presenting nl three steps for data flow indication powerpoint temptate. Three steps diagram has been used to craft this power point template diagram. This PPT diagram contains the concept of business data flow representation. Use this PPT diagram for business and marketing related presentations.
-
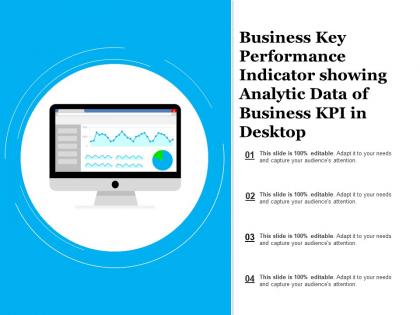 Business key performance indicator showing analytic data of business kpi in desktop
Presenting this set of slides with name - Business Key Performance Indicator Showing Analytic Data Of Business Kpi In Desktop. This is a four stage process. The stages in this process are Business Kpi, Business Dashboard, Business Metrics.
-
 Business kpi showing summary of key performance indicator data representation in line graph and pie chart
Presenting this set of slides with name - Business Kpi Showing Summary Of Key Performance Indicator Data Representation In Line Graph And Pie Chart. This is a three stage process. The stages in this process are Business Kpi, Business Dashboard, Business Metrics.
-
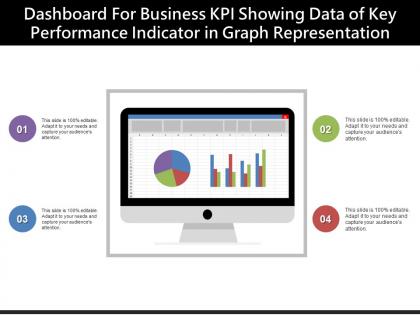 Dashboard for business kpi showing data of key performance indicator in graph representation
Presenting this set of slides with name - Dashboard For Business Kpi Showing Data Of Key Performance Indicator In Graph Representation. This is a four stage process. The stages in this process are Business Kpi, Business Dashboard, Business Metrics.
-
 Market Indicators Icon To Interpret Financial Data
Presenting our set of slides with name Market Indicators Icon To Interpret Financial Data. This exhibits information on three stages of the process. This is an easy-to-edit and innovatively designed PowerPoint template. So download immediately and highlight information on Market Indicators Icon To Interpret Financial Data.
-
 Platform Migration Icon Indicating Data Transfer
Presenting our set of slides with Platform Migration Icon Indicating Data Transfer. This exhibits information on four stages of the process. This is an easy to edit and innovatively designed PowerPoint template. So download immediately and highlight information on Platform Migration Icon Indicating Data Transfer.
-
 Data Mining Flowchart Indicating Customer Profiling
This slide showcase flowchart indicating customer profiling by using data mining which can assist companies in gathering reliable data to streamline the process of profiling. It contains details about individual data, regulations, professional, verification, mechanist, cancelled, approved and so on.Introducing our Data Mining Flowchart Indicating Customer Profiling set of slides. The topics discussed in these slides are Individual Data, Individual Regulations, Cancelled Regulations This is an immediately available PowerPoint presentation that can be conveniently customized. Download it and convince your audience.
-
 Key Performance Indicators Of Recruitment Data
The following slide showcases most relevant KPIs that help to develop data-driven recruitment policy. The KPIs included are time to hire, time to acceptance, retention rate, applications per job, cost per hire and applications per channel. Introducing our Key Performance Indicators Of Recruitment Data set of slides. The topics discussed in these slides are Cost Based Recruitment, Quality Based Recruitment, Speed Based Recruitment. This is an immediately available PowerPoint presentation that can be conveniently customized. Download it and convince your audience.
-
 Key Performance Indicators Related To Customer Data Analytics
This slide consists of major key performance indicators related to customer data analytics which can be used by organizations to improve customer value. Major KPIs relate to customers acquired, customers retained, customer satisfaction rate, value delivered etc.Presenting our well structured Key Performance Indicators Related To Customer Data Analytics. The topics discussed in this slide are Customers retained, existing customers, Measures percentage. This is an instantly available PowerPoint presentation that can be edited conveniently. Download it right away and captivate your audience.
-
 Export database icon with right indicating arrow
Presenting export database icon with right indicating arrow. This is a export database icon with right indicating arrow. This is a four stage process. The stages in this process are goods selling, freight transport, international trade.
-
 Economic risk indices competitive landscape database maintenance forecasting models
Presenting this set of slides with name - Economic Risk Indices Competitive Landscape Database Maintenance Forecasting Models. This is an editable eight graphic that deals with topics like Economic Risk Indices, Competitive Landscape, Database Maintenance, Forecasting Models to help convey your message better graphically. This product is a premium product available for immediate download, and is 100 percent editable in Powerpoint. Download this now and use it in your presentations to impress your audience.
-
 Evaluate actions scenarios indicator construction calculation data collection
Presenting this set of slides with name - Evaluate Actions Scenarios Indicator Construction Calculation Data Collection. This is an editable one stages graphic that deals with topics like Evaluate Actions Scenarios, Indicator Construction Calculation, Data Collection to help convey your message better graphically. This product is a premium product available for immediate download, and is 100 percent editable in Powerpoint. Download this now and use it in your presentations to impress your audience.
-
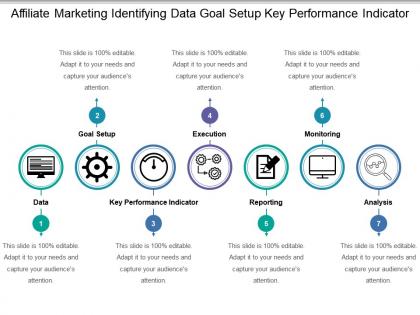 Affiliate marketing identifying data goal setup key performance indicator
Presenting this set of slides with name - Affiliate Marketing Identifying Data Goal Setup Key Performance Indicator. This is a seven stage process. The stages in this process are Affiliate Marketing, Referral Marketing, Pay Per Sale.
-
 Data information human rights indicator conference global survey
Presenting this set of slides with name - Data Information Human Rights Indicator Conference Global Survey. This is an editable four stages graphic that deals with topics like Data Information, Human Rights, Indicator Conference, Global Survey to help convey your message better graphically. This product is a premium product available for immediate download and is 100 percent editable in Powerpoint. Download this now and use it in your presentations to impress your audience.
-
 Data indication growth chart flat powerpoint design
We are proud to present our data indication growth chart flat powerpoint design. A X-Y chart with growth arrow has been used to design this power point template. This PPT diagram contains the growth indication based on data. Use this PPT diagram for business and sales based data representation in any presentation.
-
 0115 four human hands with text boxes for data indication powerpoint template
We are proud to present our 0115 four human hands with text boxes for data indication powerpoint template. Graphic of four human hands with text boxes are used to design this power point template. This PPT depicts the concept of data indication. Use this PPT for your data related topics in any presentation.
-
 Client data indicators ppt powerpoint presentation diagrams cpb
Presenting this set of slides with name Client Data Indicators Ppt Powerpoint Presentation Diagrams Cpb. This is an editable Powerpoint three stages graphic that deals with topics like Client Data Indicators to help convey your message better graphically. This product is a premium product available for immediate download and is 100 percent editable in Powerpoint. Download this now and use it in your presentations to impress your audience.
-
 Data visualization indicators ppt powerpoint presentation gallery backgrounds cpb
Presenting this set of slides with name Data Visualization Indicators Ppt Powerpoint Presentation Gallery Backgrounds Cpb. This is an editable Powerpoint seven stages graphic that deals with topics like Data Visualization Indicators to help convey your message better graphically. This product is a premium product available for immediate download and is 100 percent editable in Powerpoint. Download this now and use it in your presentations to impress your audience.
-
 Four circular infographics for business data indication flat powerpoint design
We are proud to present our four circular infographics for business data indication flat powerpoint design. Graphic of four circular info graphics has been used to craft this PPT diagram. This PPT diagram contains the concept of business data indication. Use this PPT diagram for business and marketing related presentations.
-
 Four signpost infographics for data indication flat powerpoint design
We are proud to present our four signpost infographics for data indication flat powerpoint design. Graphic of four signpost info graphics with technical icons has been used to craft this power point template diagram. This PPT diagram contains the concept of business data representation. Use this PPT diagram for business and marketing related presentations.
-
 Three levels of circular chart for business data indication flat powerpoint design
We are proud to present our three levels of circular chart for business data indication flat powerpoint design. Three levels of circular chart has been used to design this power point template diagram. This PPT diagram contains the concept of business data indication. Use this PPT diagram for business and sales related presentations.
-
 Four colored steps for business data indication flat powerpoint design
We are proud to present our four colored steps for business data indication flat powerpoint design. Four colored steps has been used to craft this power point template diagram. This PPT diagram contains the concept of business data representation. Use this PPT diagram for business and data related presentations.
-
 Three staged triangle diagram for data and process indication flat powerpoint design
We are proud to present our three staged triangle diagram for data and process indication flat powerpoint design. Three staged triangle diagram has been used to design this power point template diagram. This PPT diagram contains the concept of data and process indication. Use this PPT diagram for data and business related presentations.
-
 Eg business charts with icons data indication flat powerpoint design
Presenting eg business charts with icons data indication flat powerpoint design. Graphic of business charts and icons has been used to design this power point template diagram. This PPT diagram contains the concept of data indication. Use this PPT diagram for business and marketing related presentations.
-
 Growth indication business deal data management funnel ppt icons graphics
Presenting growth indication business deal data management funnel ppt icons graphics. This Power Point template slide has been crafted with graphic of growth chart and other icons. This PPT slide contains the concept of growth indication and business deal representation. Use this PPT slide for business and finance related presentations.
-
 Financial data update process improvement growth indication ppt icons graphics
Presenting financial data update process improvement growth indication ppt icons graphics. This Power Point icons template has been crafted with graphic of finance and data icons. This icon PPT contains the concept of financial data update and global investment analysis. Use this icon PPT for business and finance related presentations.
-
 Two level bar graph for data indication flat powerpoint design
We are proud to present our two level bar graph for data indication flat powerpoint design. Concept of business data indication has been displayed in this power point template diagram. This PPT diagram contains the graphic of two level bar graph. Use this PPT diagram for business and marketing related presentations.
-
 Five staged process flow indication data search flat powerpoint design
Presentation templates run smoothly with each software capable of running slides. Effortlessly convert to JPG and PDF. Compatible with Google slides for ease of access. Convenient widescreen viewing without PPT graphics pixilation issues. High resolution PPT graphics. Customizable layout including font, text, color, design. This example of PPT presentation slide can be employed in businesses and startups, operations management, education.
-
 Safety data download indication banner diagram flat powerpoint design
We are proud to present our safety data download indication banner diagram flat powerpoint design. Concept of safety data download indication representation has been explained in this power point template diagram with suitable graphics. This PPT diagram contains the graphic of colored banner diagram. Use this PPT diagram for business and data related presentations.
-
 Business peoples with data driven growth indication powerpoint slides
We are proud to present our business peoples with data driven growth indication powerpoint slides. This power point template diagram has been designed with graphic of business peoples. This pie chart is data driven. This PPT diagram can be used for data driven growth indication. Use this PPT diagram can be used for marketing and business related presentations.
-
 Globe with bar graph data driven success indication powerpoint slides
We are proud to present our globe with bar graph data driven success indication powerpoint slides. Explain the global success indication with this power point template diagram. This PPT diagram contains the graphic of globe with bar graph. Use this PPT diagram for global marketing and business related presentations.
-
 Data performance indicators ppt powerpoint presentation show example file cpb
Presenting this set of slides with name Data Performance Indicators Ppt Powerpoint Presentation Show Example File Cpb. This is an editable Powerpoint four stages graphic that deals with topics like Data Performance Indicators to help convey your message better graphically. This product is a premium product available for immediate download and is 100 percent editable in Powerpoint. Download this now and use it in your presentations to impress your audience.
-
 Big data science analysis using key performance indicators
Presenting this set of slides with name Big Data Science Analysis Using Key Performance Indicators. This is a one stage process. The stage in this process is Big Data Science Analysis Using Key Performance Indicators. This is a completely editable PowerPoint presentation and is available for immediate download. Download now and impress your audience.
-
 Graphical representation of data quality index with performance indicator
Presenting this set of slides with name Graphical Representation Of Data Quality Index With Performance Indicator. The topics discussed in these slides are Graphical Representation Of Data Quality Index With Performance Indicator. This is a completely editable PowerPoint presentation and is available for immediate download. Download now and impress your audience.
-
 Customers communication preferences sample data indicate ppt powerpoint presentation show
Presenting this set of slides with name Customers Communication Preferences Sample Data Indicate Ppt Powerpoint Presentation Show. The topics discussed in these slides are Consumer Preferences, Brand, Communications, Product, Purchase. This is a completely editable PowerPoint presentation and is available for immediate download. Download now and impress your audience.
-
 Data performance indicators ppt powerpoint presentation styles example file cpb
Presenting this set of slides with name Data Performance Indicators Ppt Powerpoint Presentation Styles Example File Cpb. This is an editable Powerpoint four stages graphic that deals with topics like Data Performance Indicators to help convey your message better graphically. This product is a premium product available for immediate download and is 100 percent editable in Powerpoint. Download this now and use it in your presentations to impress your audience.
-
 Icon indicating data flow with control points
Presenting this set of slides with name Icon Indicating Data Flow With Control Points. This is a three stage process. The stages in this process are Icon Indicating Data Flow With Control Points. This is a completely editable PowerPoint presentation and is available for immediate download. Download now and impress your audience.
-
 5 part circular arrows indicating data processing steps
Presenting this set of slides with name 5 Part Circular Arrows Indicating Data Processing Steps. This is a five stage process. The stages in this process are Data Storage, Data Collection, Data Preparation, Data Input, Data Processing. This is a completely editable PowerPoint presentation and is available for immediate download. Download now and impress your audience.
-
 Circular phases indicating data migration process
Presenting this set of slides with name Circular Phases Indicating Data Migration Process. This is a five stage process. The stages in this process are Transform, Test, Integrate, Migrate, Archive. This is a completely editable PowerPoint presentation and is available for immediate download. Download now and impress your audience.
-
 Icon indicating online data migration to cloud
Introducing our premium set of slides with Icon Indicating Online Data Migration To Cloud. Ellicudate the one stage and present information using this PPT slide. This is a completely adaptable PowerPoint template design that can be used to interpret topics like Icon Indicating Online Data Migration To Cloud. So download instantly and tailor it with your information.
-
 Icon indicating common data storage interface for multiple devices
Presenting our set of slides with Icon Indicating Common Data Storage Interface For Multiple Devices. This exhibits information on one stage of the process. This is an easy-to-edit and innovatively designed PowerPoint template. So download immediately and highlight information on Icon Indicating Common Data Storage Interface For Multiple Devices.
-
 Rotation process indicating data processing cycle
Introducing our premium set of slides with Rotation Process Indicating Data Processing Cycle. Elucidate the six stages and present information using this PPT slide. This is a completely adaptable PowerPoint template design that can be used to interpret topics like Data Collection, Preparation, Validate Data, Process, Storage. So download instantly and tailor it with your information.
-
 Tick mark indicating successful data loading
Introducing our Tick Mark Indicating Successful Data Loading set of slides. The topics discussed in these slides are Tick Mark, Indicating Successful, Data Loading. This is an immediately available PowerPoint presentation that can be conveniently customized. Download it and convince your audience.
-
 In and out icon indicating data analysis
Presenting our set of slides with name In And Out Icon Indicating Data Analysis. This exhibits information on one stages of the process. This is an easy to edit and innovatively designed PowerPoint template. So download immediately and highlight information on In Out Icon, Indicating, Data Analysis.
-
 In and out icon indicating data process with funnel
Presenting our set of slides with name In And Out Icon Indicating Data Process With Funnel. This exhibits information on one stages of the process. This is an easy to edit and innovatively designed PowerPoint template. So download immediately and highlight information on In Out Icon, Indicating Data, Process Funnel.
-
 In and out icon indicating data processing
Presenting our set of slides with name In And Out Icon Indicating Data Processing. This exhibits information on one stages of the process. This is an easy to edit and innovatively designed PowerPoint template. So download immediately and highlight information on In Out Icon, Indicating Data, Processing.
-
 Information in and out icon indicating data management
Presenting our set of slides with name Information In And Out Icon Indicating Data Management. This exhibits information on one stages of the process. This is an easy to edit and innovatively designed PowerPoint template. So download immediately and highlight information on Information, In Out Icon, Indicating, Data Management.
-
 Data quality performance indicators ppt powerpoint presentation professional inspiration cpb
Presenting our Data Quality Performance Indicators Ppt Powerpoint Presentation Professional Inspiration Cpb PowerPoint template design. This PowerPoint slide showcases four stages. It is useful to share insightful information on Data Quality Performance Indicators This PPT slide can be easily accessed in standard screen and widescreen aspect ratios. It is also available in various formats like PDF, PNG, and JPG. Not only this, the PowerPoint slideshow is completely editable and you can effortlessly modify the font size, font type, and shapes according to your wish. Our PPT layout is compatible with Google Slides as well, so download and edit it as per your knowledge.


