Powerpoint Templates and Google slides for Indicates
Save Your Time and attract your audience with our fully editable PPT Templates and Slides.
-
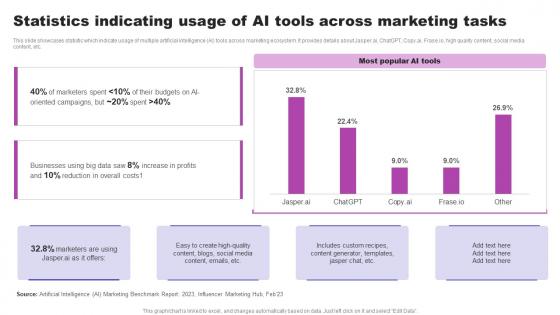 Statistics Indicating Usage Of AI Tools Across Marketing Tasks AI Marketing Strategies AI SS V
This slide showcases statistic which indicate usage of multiple artificial intelligence AI tools across marketing ecosystem. It provides details about Jasper.ai, ChatGPT, Copy.ai, Frase.io, high quality content, social media content, etc. Present the topic in a bit more detail with this Statistics Indicating Usage Of AI Tools Across Marketing Tasks AI Marketing Strategies AI SS V. Use it as a tool for discussion and navigation on Most Popular, Marketers, Statistics Indicating. This template is free to edit as deemed fit for your organization. Therefore download it now.
-
 Key Indicators For An Effective CRM Software Leveraging Effective CRM Tool In Real Estate Company
This slide covers major considerations for selecting an effective CRM software system. It includes insights on improved customer relationships, improved productivity, business cost reduction and improve process along with lower spend and higher ROI. Deliver an outstanding presentation on the topic using this Key Indicators For An Effective CRM Software Leveraging Effective CRM Tool In Real Estate Company. Dispense information and present a thorough explanation of Improve Productivity, Business Cost Reduction, Improve Process using the slides given. This template can be altered and personalized to fit your needs. It is also available for immediate download. So grab it now.
-
 Eight staged arrow circle with business planning indication powerpoint template slide
We are proud to present our eight staged arrow circle with business planning indication powerpoint template slide. Eight staged arrow circle diagram has been used to craft this power point template diagram. This PPT diagram contains the concept of business planning. Use this PPT diagram for business and marketing related presentations.
-
 1214 six staged battery diagram with charging indication powerpoint template
We are proud to present our 1214 six staged battery diagram with charging indication powerpoint template. This power point template has been designed with graphic of six staged battery diagram. This PPT displays the concept of charging. Use this PPT for technology related presentations.
-
 Parallel Tracks Horizontal Countryside Indication Arrows
This complete deck covers various topics and highlights important concepts. It has PPT slides which cater to your business needs. This complete deck presentation emphasizes Parallel Tracks Horizontal Countryside Indication Arrows and has templates with professional background images and relevant content. This deck consists of total of eleven slides. Our designers have created customizable templates, keeping your convenience in mind. You can edit the colour, text and font size with ease. Not just this, you can also add or delete the content if needed. Get access to this fully editable complete presentation by clicking the download button below.
-
 Winning The Race Athletics Competing Individual Sprinting Cyclist Indicated
It covers all the important concepts and has relevant templates which cater to your business needs. This complete deck has PPT slides on Winning The Race Athletics Competing Individual Sprinting Cyclist Indicated with well suited graphics and subject driven content. This deck consists of total of eleven slides. All templates are completely editable for your convenience. You can change the colour, text and font size of these slides. You can add or delete the content as per your requirement. Get access to this professionally designed complete deck presentation by clicking the download button below.
-
 Emotion Icon Candidate Expressing Conference Reflecting Indicating
It covers all the important concepts and has relevant templates which cater to your business needs. This complete deck has PPT slides on Emotion Icon Candidate Expressing Conference Reflecting Indicating with well suited graphics and subject driven content. This deck consists of total of eleven slides. All templates are completely editable for your convenience. You can change the colour, text and font size of these slides. You can add or delete the content as per your requirement. Get access to this professionally designed complete deck presentation by clicking the download button below.
-
 Current situation company performance indicators organization management organizational behavior
This slide is depicting the performance of the companys website with some KPIs such as attraction, retention, engagement and values Deliver an outstanding presentation on the topic using this Current Situation Company Performance Indicators Organization Management Organizational Behavior. Dispense information and present a thorough explanation of Producing Engaging Content, Measuring Content Effectiveness, Measuring The ROI Of Content using the slides given. This template can be altered and personalized to fit your needs. It is also available for immediate download. So grab it now.
-
 Key performance indicators in oil and gas industry
Introducing our Key Performance Indicators In Oil And Gas Industry set of slides. The topics discussed in these slides are Planned Benefits, Planned Cost, Actual Cost. This is an immediately available PowerPoint presentation that can be conveniently customized. Download it and convince your audience.
-
 Team Coordination Strategies Kpi Dashboard Indicating Teams Performances
The following slide exhibits the dashboard showcasing team performances and the best performers team members. Its key elements include product sales by team, customer satisfaction rating, revenue earned by teams, top revenue earners, etc. Present the topic in a bit more detail with this Team Coordination Strategies Kpi Dashboard Indicating Teams Performances. Use it as a tool for discussion and navigation on Product Sales By Team, Customer Satisfaction Ratings. This template is free to edit as deemed fit for your organization. Therefore download it now.
-
 Key Performance Indicators Highlighting Technology Deployment Plan To Improve Organizations
This slide represents the key performance indicators to track the problems faced by organization and draw effective strategies to tackle the problems. It includes key performance indicators of decline in organizational sales and customer engagement rate. Deliver an outstanding presentation on the topic using this Key Performance Indicators Highlighting Technology Deployment Plan To Improve Organizations. Dispense information and present a thorough explanation of Performance, Indicators, Current using the slides given. This template can be altered and personalized to fit your needs. It is also available for immediate download. So grab it now.
-
 Key Indicator Dashboard For Measuring Retail KPI Performance
This slide showcases ways to mesure retail KPI performance with key indicator dashboard. This further includes average shopping time, average basket money spend, online vs offline sales etc. Introducing our Key Indicator Dashboard For Measuring Retail KPI Performance set of slides. The topics discussed in these slides are Average Shopping Time, Average Basket Spend. This is an immediately available PowerPoint presentation that can be conveniently customized. Download it and convince your audience.
-
 Key Indicator Dashboard To Measure Reverse Factoring
This slide showcases measure of reverse factoring key indicator dashboard. This further includes amount financed, breakdown for invoices, currencies etc. Presenting our well structured Key Indicator Dashboard To Measure Reverse Factoring. The topics discussed in this slide are Amount Financed, Invoice Financed.This is an instantly available PowerPoint presentation that can be edited conveniently. Download it right away and captivate your audience.
-
 Key Indicator Dashboard For Workforce Development Planning
This slide represents workforce development planning for key indicator dashboard. This further includes supply, skills demand and gap, skill supply, skill analysis, surplus deficit, headcount vs competency etc. Introducing our Key Indicator Dashboard For Workforce Development Planning set of slides. The topics discussed in these slides are Skill Supply, Surplus Deficit, Headcount Competency. This is an immediately available PowerPoint presentation that can be conveniently customized. Download it and convince your audience.
-
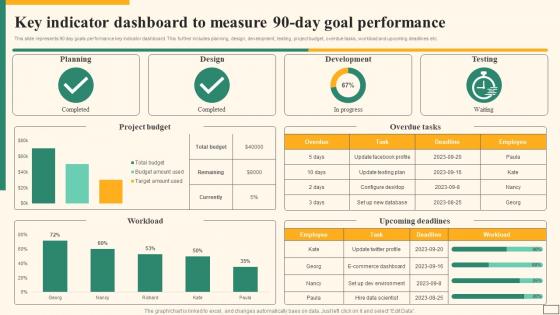 Key Indicator Dashboard To Measure 90 Day Goal Performance
This slide represents 90 day goals performance key indicator dashboard. This further includes planning, design, development, testing, project budget, overdue tasks, workload and upcoming deadlines etc. Introducing our Key Indicator Dashboard To Measure 90 Day Goal Performance set of slides. The topics discussed in these slides are Planning,Design,Development. This is an immediately available PowerPoint presentation that can be conveniently customized. Download it and convince your audience.
-
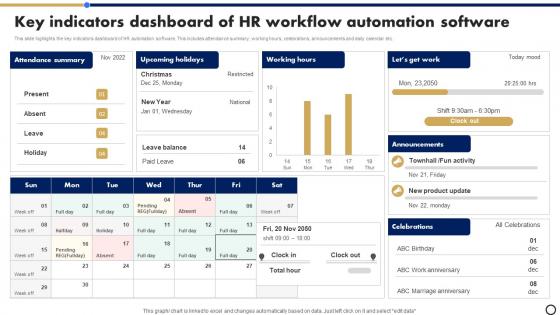 Key Indicators Dashboard Of HR Workflow Automation Software
This slide highlights the key indicators dashboard of HR automation software. This includes attendance summary, working hours, celebrations, announcements and daily calendar etc. Introducing our Key Indicators Dashboard Of HR Workflow Automation Software set of slides. The topics discussed in these slides are Attendance Summary, Upcoming Holidays, Working Hours. This is an immediately available PowerPoint presentation that can be conveniently customized. Download it and convince your audience.
-
 Key Indicator Dashboard To Measure Budget Report Projection
This slide represents ways to measure budget report projection with key indicator dashboard. This includes budget, spent, left to spend, budget by projects, budget vs spend etc. Presenting our well structured Key Indicator Dashboard To Measure Budget Report Projection. The topics discussed in this slide are Budget, Spent, Left To Spend. This is an instantly available PowerPoint presentation that can be edited conveniently. Download it right away and captivate your audience.
-
 Key Indicator Dashboard For Crisis Management For Employees And Customers
This slide showcases crisis management for employees and customers key indicator dashboard. This slide includes articles published, total interaction, overtime change in public interest and overtime change in media interest. Presenting our well structured Key Indicator Dashboard For Crisis Management For Employees And Customers. The topics discussed in this slide are Media Interest, Public Interest. This is an instantly available PowerPoint presentation that can be edited conveniently. Download it right away and captivate your audience.
-
 Key Indicator Dashboard For IOT Data Visualization
This slide represents IOT data visualization key indicator dashboard. This slide includes traffic loops, speed of cars average, patterns as per weekly and hourly and date wise traffic density low or high. Introducing our Key Indicator Dashboard For IOT Data Visualization set of slides. The topics discussed in these slides are Key Benefits With Data Visualization In IOT. This is an immediately available PowerPoint presentation that can be conveniently customized. Download it and convince your audience.
-
 Key Indicator Dashboard To Measure Brand Performance
This slide highlights brand performance key indicator dashboard. This further includes total impressions, total clicks, total acquisition and total cost per acquisition and campaigns with budget. Introducing our Key Indicator Dashboard To Measure Brand Performance set of slides. The topics discussed in these slides are Indicator, Measure, Brand. This is an immediately available PowerPoint presentation that can be conveniently customized. Download it and convince your audience.
-
 Key Indicators Dashboard Of HR Automation Software
This slide highlights the key indicators dashboard of HR automation software. This includes attendance summary, working hours, celebrations, announcements and daily calendar etc. Introducing our Key Indicators Dashboard Of HR Automation Software set of slides. The topics discussed in these slides are Attendance Summary, Upcoming Holidays, Working Hours. This is an immediately available PowerPoint presentation that can be conveniently customized. Download it and convince your audience.
-
 Graph Indicating Increase In Overall Multiple Strategies For Cost Effectiveness
The slide highlights the lack of cost efficiency in the company that leads to increase in overall business expenses. It includes comparison of previous year costs to evaluate the rise in total business expenditure Present the topic in a bit more detail with this Graph Indicating Increase In Overall Multiple Strategies For Cost Effectiveness. Use it as a tool for discussion and navigation on Graph, Increase, Business. This template is free to edit as deemed fit for your organization. Therefore download it now.
-
 Cost Efficiency Strategies For Reducing Graph Indicating Increase In Overall Business Costs
The slide highlights the lack of cost efficiency in the company that leads to increase in overall business expenses. It includes comparison of previous year costs to evaluate the rise in total business expenditure. Present the topic in a bit more detail with this Cost Efficiency Strategies For Reducing Graph Indicating Increase In Overall Business Costs. Use it as a tool for discussion and navigation on Business Costs. This template is free to edit as deemed fit for your organization. Therefore download it now.
-
 Graph Indicating Increase In Overall Business Costs Cost Reduction Techniques
The slide highlights the lack of cost efficiency in the company that leads to increase in overall business expenses. It includes comparison of previous year costs to evaluate the rise in total business expenditure. Present the topic in a bit more detail with this Graph Indicating Increase In Overall Business Costs Cost Reduction Techniques. Use it as a tool for discussion and navigation on According, Previous. This template is free to edit as deemed fit for your organization. Therefore download it now.
-
 Key Indicator Dashboard Of Export Market Software
This slide highlights the key indicators dashboard of export market software. This includes analytics, buyer analysis, seller countries and top importers to help business understand the performance. Presenting our well structured Key Indicator Dashboard Of Export Market Software. The topics discussed in this slide are Analytics, Analysis Of Buyers. This is an instantly available PowerPoint presentation that can be edited conveniently. Download it right away and captivate your audience.
-
 Key Indicator Dashboard For Predictive Analysis In Healthcare
This slide represents predictive analysis in healthcare key indicator dashboard. This further includes number of inpatients, number of outpatients, average wait in minutes and current patients by division etc. Presenting our well structured Key Indicator Dashboard For Predictive Analysis In Healthcare. The topics discussed in this slide are Number Of Inpatients, Current Patients.This is an instantly available PowerPoint presentation that can be edited conveniently. Download it right away and captivate your audience.
-
 Key Indicator Dashboard For Construction Quality Project
This slide showcases construction quality project key indicator dashboard. This further includes project work status, utilized budget, project duration and actual vs planned resources etc. Presenting our well structured Key Indicator Dashboard For Construction Quality Project. The topics discussed in this slide are Project Completion Percentage, Utilized Duration.This is an instantly available PowerPoint presentation that can be edited conveniently. Download it right away and captivate your audience.
-
 Key Indicator Dashboard Of Organization Resource Planning Software
This slide highlights the dashboard of organization resource planning software. It includes planned time for project, actual time taken for project and time variance in data and pie chart form. Introducing our Key Indicator Dashboard Of Organization Resource Planning Software set of slides. The topics discussed in these slides are Planned Time, Actual Time. This is an immediately available PowerPoint presentation that can be conveniently customized. Download it and convince your audience.
-
 Ad Campaign Performance Indicators Linkedin Marketing Channels To Improve Lead Generation MKT SS V
This slide covers dashboard to measure the performance of ad campaigns on LinkedIn platform. The purpose of this template is to provide the company an overview on the outcomes of running ad campaigns on LinkedIn. It includes performance based on impressions, CTR, engagement rates, CPC, CPM, etc. Present the topic in a bit more detail with this Ad Campaign Performance Indicators Linkedin Marketing Channels To Improve Lead Generation MKT SS V. Use it as a tool for discussion and navigation on Performance, Dashboard, Impressions. This template is free to edit as deemed fit for your organization. Therefore download it now.
-
 Audit Key Performance Indicators Dashboard
This slide showcases the effective audit key performance indicators dashboard which helps an organization to provide cloud based platform that transforms risk management system. It include details such as satisfactory, requires some improvement, unsatisfactory, etc. Introducing our Audit Key Performance Indicators Dashboard set of slides. The topics discussed in these slides are Planned Audits Status, Audit Observation Summary, Planned Audit Risk Rating, Completed Audits Results. This is an immediately available PowerPoint presentation that can be conveniently customized. Download it and convince your audience.
-
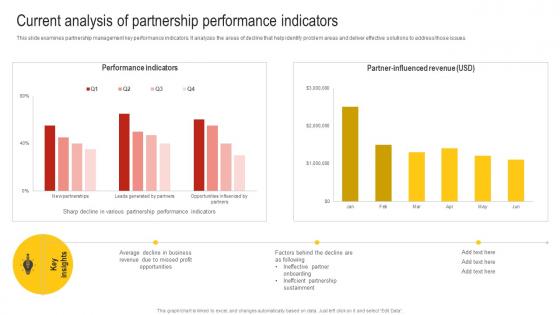 Current Analysis Of Partnership Performance Indicators Nurturing Relationships
This slide examines partnership management key performance indicators. It analyzes the areas of decline that help identify problem areas and deliver effective solutions to address those issues. Present the topic in a bit more detail with this Current Analysis Of Partnership Performance Indicators Nurturing Relationships Use it as a tool for discussion and navigation on Performance Indicators, Current Analysis, Partner Influenced Revenue This template is free to edit as deemed fit for your organization. Therefore download it now.
-
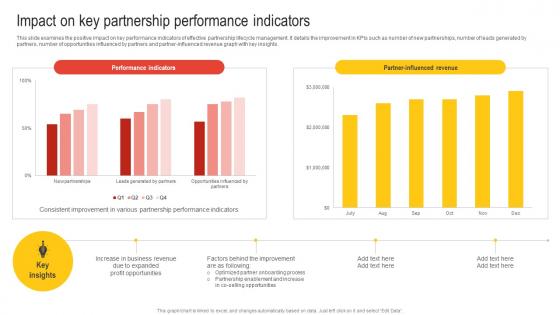 Impact On Key Partnership Performance Indicators Nurturing Relationships
This slide examines the positive impact on key performance indicators of effective partnership lifecycle management. It details the improvement in KPIs such as number of new partnerships, number of leads generated by partners, number of opportunities influenced by partners and partner-influenced revenue graph with key insights. Deliver an outstanding presentation on the topic using this Impact On Key Partnership Performance Indicators Nurturing Relationships Dispense information and present a thorough explanation of Performance Indicators, Partner Influenced Revenue using the slides given. This template can be altered and personalized to fit your needs. It is also available for immediate download. So grab it now.
-
 OKR Dashboard To Assess Business Performance Indicators
This slide depicts the OKR dashboard to evaluate the business performance indicators. The purpose of this slide is to help the business track its performance through measurement of indicators such as profitability rate, conversion rate, etc. Introducing our OKR Dashboard To Assess Business Performance Indicators set of slides. The topics discussed in these slides are Profitability Rate, Average Online, Conversion Rate Retail This is an immediately available PowerPoint presentation that can be conveniently customized. Download it and convince your audience.
-
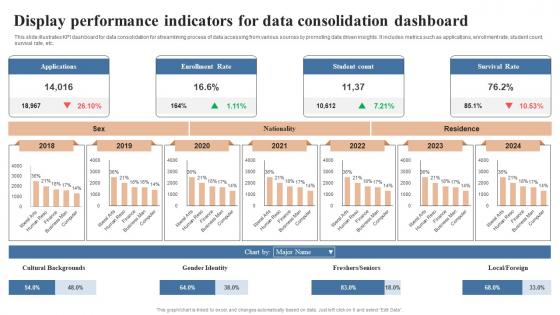 Display Performance Indicators For Data Consolidation Dashboard
This slide illustrates KPI dashboard for data consolidation for streamlining process of data accessing from various sources by promoting data driven insights. It includes metrics such as applications, enrollment rate, student count, survival rate, etc. Introducing our Display Performance Indicators For Data Consolidation Dashboard set of slides. The topics discussed in these slides are Applications, Enrollment Rate, Survival Rate This is an immediately available PowerPoint presentation that can be conveniently customized. Download it and convince your audience.
-
 Price Indicator Value Analysis Graph Future Of Digital Ownership NFTs Explained Fin SS
This slide represents the various price indicator values that help to analyze NFT collectibles in terms of price behavior, holder patterns, rarity characteristics, and leaderboards. The different factors are sales price, floor price significance, breakeven calculation, etc. Deliver an outstanding presentation on the topic using this Price Indicator Value Analysis Graph Future Of Digital Ownership NFTs Explained Fin SS. Dispense information and present a thorough explanation of Analysis, Leaderboards, Behavior using the slides given. This template can be altered and personalized to fit your needs. It is also available for immediate download. So grab it now.
-
 Staff Onboarding And Training Analyzing The Impact On Onboarding Key Performance Indicators
This slide present KPIs to track regularly to identify trends and areas for improvement in companys onboarding process. It includes information on quarterly decrease in the performance of KPIs such as, new hire retention, voluntary turnover, involuntary turnover, time to productivity, training completion, employee engagement. Present the topic in a bit more detail with this Staff Onboarding And Training Analyzing The Impact On Onboarding Key Performance Indicators Use it as a tool for discussion and navigation on Time To Productivity, Compliance Training Completion, New Hire Retention This template is free to edit as deemed fit for your organization. Therefore download it now.
-
 Key Indicator Dashboard To Measure Okr Report Performance
This slide represents okr report performance measuring key indicator dashboard. This further includes revenue, new restaurant, new hires, avg revenue per restaurant, avg set up time etc. Presenting our well structured Key Indicator Dashboard To Measure Okr Report Performance. The topics discussed in this slide are Dashboard, Measure, Performance. This is an instantly available PowerPoint presentation that can be edited conveniently. Download it right away and captivate your audience.
-
 Financial Metrics Indicating Companys Financial Health Corporate Finance Mastery Maximizing FIN SS
This slide focuses on financial metrics that are indicative of a companys financial health. The top metrics covered in the slide are days sales outstanding, days inventory outstanding, etc. Deliver an outstanding presentation on the topic using this Financial Metrics Indicating Companys Financial Health Corporate Finance Mastery Maximizing FIN SS Dispense information and present a thorough explanation of More Liquidity, Faster Collection Of Payments, Receivables And Inventory using the slides given. This template can be altered and personalized to fit your needs. It is also available for immediate download. So grab it now.
-
 Total Assets Charts Indicating Net Worth Transportation Business Plan BP SS
The slides provide a picture of the businesss financial situation at a particular point in time. It displays the companys assets and liabilities from the year 2023 to the anticipated year 2027.Present the topic in a bit more detail with this Total Assets Charts Indicating Net Worth Transportation Business Plan BP SS Use it as a tool for discussion and navigation on Investing Aspect, Divestments Related, Related Investments This template is free to edit as deemed fit for your organization. Therefore download it now.
-
 Ad Campaign Performance Indicators Linkedin Marketing Strategies To Increase Conversions MKT SS V
This slide covers dashboard to measure the performance of ad campaigns on LinkedIn platform. The purpose of this template is to provide the company an overview on the outcomes of running ad campaigns on LinkedIn. It includes performance based on impressions, CTR, engagement rates, CPC, CPM, etc. Present the topic in a bit more detail with this Ad Campaign Performance Indicators Linkedin Marketing Strategies To Increase Conversions MKT SS V. Use it as a tool for discussion and navigation on Ad Campaign, Performance Indicators, Tracking Dashboard. This template is free to edit as deemed fit for your organization. Therefore download it now.
-
 Key Performance Indicators Post Inventory Audit Optimizing Inventory Audit
This slide showcases kpis of inventory management such as stock out rate, carrying cost and many others inventory variables. Present the topic in a bit more detail with this Key Performance Indicators Post Inventory Audit Optimizing Inventory Audit. Use it as a tool for discussion and navigation on Stock Out Rate, Inventory Carrying Cost, Minimize Inventory Hand. This template is free to edit as deemed fit for your organization. Therefore download it now.
-
 Key Indicator Dashboard Of Product Release
Presenting our well structured Key Indicator Dashboard Of Product Release The topics discussed in this slide are Tasks By Priority, Tasks By Type, Release StatusThis is an instantly available PowerPoint presentation that can be edited conveniently. Download it right away and captivate your audience.
-
 Essential Key Performance Indicators For High Frequency Trading
This slide examines essential key performance indicators and the impact of implementing an expert advisor to the trading platform along with the reasons for changes observed. Presenting our well structured Essential Key Performance Indicators For High Frequency Trading. The topics discussed in this slide are Trade Execution Time, Key Performance Indicators, Implementation. This is an instantly available PowerPoint presentation that can be edited conveniently. Download it right away and captivate your audience.
-
 Potential Impact Of Risk Indicators On High Frequency Trading
This slide examines essential risk indicators of high frequency trading such as ripple effects, reduced market confidence and their potential impact. Introducing our Potential Impact Of Risk Indicators On High Frequency Trading set of slides. The topics discussed in these slides are Ripple Effects, Errant Algorithm, Reduced Market Confidence. This is an immediately available PowerPoint presentation that can be conveniently customized. Download it and convince your audience.
-
 Dashboard Indicating Growth Hacking Strategies Impact
The purpose of the slide is to showcase the dashboard indicating growth hacking strategies impact. It include elements such as performance tracker, link clicks, number of leads, page likes, campaign details, total clicks etc. Introducing our Dashboard Indicating Growth Hacking Strategies Impact set of slides. The topics discussed in these slides are Dashboard, Strategies Impact, Performance. This is an immediately available PowerPoint presentation that can be conveniently customized. Download it and convince your audience.
-
 Statistics Indicating Effective Growth Hacking Methods
The slide shows the statistics related to growth hacking methods used by businesses. It include techniques such as exceptional customer service, free trial, content repurposing, incentives, email marketing, influencer marketing etc. Presenting our well structured Statistics Indicating Effective Growth Hacking Methods. The topics discussed in this slide are Statistics, Growth, Service. This is an instantly available PowerPoint presentation that can be edited conveniently. Download it right away and captivate your audience.
-
 Dashboard Indicating Integrated Retail Marketing Impact
The slide depicts omnichannel retail marketing impact dashboard enabling retailers to analyze campaign performance. It include elements such as total conversations, customer satisfaction rate, incoming conversations, abandon rate etc. Introducing our Dashboard Indicating Integrated Retail Marketing Impact set of slides. The topics discussed in these slides are Dashboard Indicating Integrated, Retail Marketing Impact, Incoming Conversations, Abandon Rate. This is an immediately available PowerPoint presentation that can be conveniently customized. Download it and convince your audience.
-
 System Key Performance Indicators Effective Guide For Real Estate Management System Implementation
Mentioned slide provides information about various KPIs which can be used to track real estate system performance. It includes KPIs such as occupancy rate, rent collection rate, lease renewal rate, vacancy filling days, tenant satisfaction, operational efficiency improvement, etc. Present the topic in a bit more detail with this System Key Performance Indicators Effective Guide For Real Estate Management System Implementation. Use it as a tool for discussion and navigation on Performance, Indicators, Collection. This template is free to edit as deemed fit for your organization. Therefore download it now.
-
 Key Performance Indicators After Using Effective Guide For Project Investment Analysis
This slide illustrate metrices after using project investment analysis techniques. It includes net present value, discounted cash flow, weighted average cost of capital etc. Present the topic in a bit more detail with this Key Performance Indicators After Using Effective Guide For Project Investment Analysis. Use it as a tool for discussion and navigation on Discounted Cash Flow, Expected Commercial Value, Net Present Value. This template is free to edit as deemed fit for your organization. Therefore download it now.
-
 Case Study Indicating Successful Cultural Change Addressing And Managing Resistance To Change CM SS
The slide presents a case study showcasing instances of successful cultural change initiatives and their adept management of resistance. The purpose is to illustrate real-world examples of how strategic cultural change initiatives can effectively mitigate resistance, offering insights and lessons for similar endeavors. Deliver an outstanding presentation on the topic using this Case Study Indicating Successful Cultural Change Addressing And Managing Resistance To Change CM SS Dispense information and present a thorough explanation of Issues Included, Key Steps Included using the slides given. This template can be altered and personalized to fit your needs. It is also available for immediate download. So grab it now.
-
 Implementing Effective Sales Training Positive Impact Of Training On Key Performance Indicator
This slide illustrates positive impact of training program on churn rate and conversion rate of customers. It includes elements such as effective sales strategy, target marketing, high engagement rate. Present the topic in a bit more detail with this Implementing Effective Sales Training Positive Impact Of Training On Key Performance Indicator. Use it as a tool for discussion and navigation on Training Program, Churn Rate And Conversion Rate, Effective Sales Strategy, Target Marketing. This template is free to edit as deemed fit for your organization. Therefore download it now.
-
 Safety Leading And Lagging Indicators Dashboard
This slide showcases dashboard for safety leading and lagging indicators. It aims to track progress in reaching business goals by providing valuable insights to monitor safety performance metrics. It includes various elements such as total manpower, incidents by hazard type, unsafe acts or conditions, etc. Introducing our Safety Leading And Lagging Indicators Dashboard set of slides. The topics discussed in these slides are Safety Leading And Lagging, Indicators Dashboard. This is an immediately available PowerPoint presentation that can be conveniently customized. Download it and convince your audience.
-
 Dashboard Indicating Insider Trading Buyers And Sellers
The slide represents dashboard providing real time insights into insider trading buying and selling activities. It include elements such as total insiders, net buyers, buy sell ratio, and trend analysis. Presenting our well structured Dashboard Indicating Insider Trading Buyers And Sellers. The topics discussed in this slide are Dashboard, Analysis, Net Buyers. This is an instantly available PowerPoint presentation that can be edited conveniently. Download it right away and captivate your audience.
-
 Gl seven staged rapid growth indication diagram powerpoint template
Presenting gl seven staged rapid growth indication diagram powerpoint template. Seven staged rapid growth diagram and icons has been used to design this power point template diagram. This PPT diagram contains the concept of business growth indication. Use this PPT diagram for business and marketing related presentations.
-
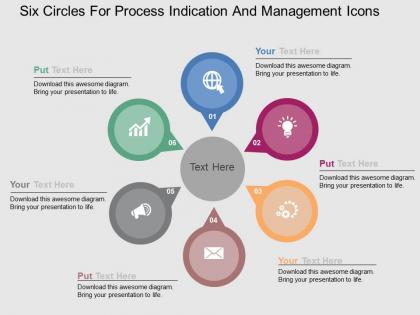 Six circles for process indication and management icons flat powerpoint design
We are proud to present our six circles for process indication and management icons flat powerpoint design. This power point template diagram has been crafted with graphic of six circles and icons. This PPT diagram contains the concept of business process indication and management. Use this PPT diagram for business and marketing related presentations.
-
 Hexagonal diagram with process flow indication flat powerpoint design
We are proud to present our hexagonal diagram with process flow indication flat powerpoint design. Graphic of hexagonal diagram has been used to design this power point template diagram. This PPT diagram contains the concept of business process flow indication. Use this PPT diagram for business and marketing related presentations.
-
 Circles with social media icons and business process indication flat powerpoint design
We are proud to present our circles with social media icons and business process indication flat powerpoint design. This power point template diagram has been crafted with graphic of circles and icons. This PPT diagram contains the concept of social media communication and business process indication. Use this PPT diagram for business and marketing related presentations.
-
 Hexagon with process flow indication flat powerpoint design
We are proud to present our hexagon with process flow indication flat powerpoint design. Graphic of hexagon has been used to design this power point template diagram. This PPT diagram contains the concept of process flow indication. Use this PPT diagram for business and marketing related presentations.
-
 Six hexagons for process flow indication flat powerpoint desgin
We are proud to present our six hexagons for process flow indication flat powerpoint desgin. This power point template diagram has been crafted with graphic of six hexagons . This PPT diagram contains the concept of business data representation and process flow indication .This PPT diagram can be used for business and marketing related presentations.
-
 Arrow diagram indicate the tasks charts and networks powerpoint templates
We are proud to present our arrow diagram indicate the tasks charts and networks powerpoint templates. Circular diagram applications include context diagrams, diagrams for mind mapping, audit flow diagram, circular process flow diagrams, data flow diagrams and more. This PowerPoint Diagram will let you explain the combo Process of four concepts which will lead to Success.


