Powerpoint Templates and Google slides for Indicate
Save Your Time and attract your audience with our fully editable PPT Templates and Slides.
-
 Health indicating monitor information technology icon
Presenting this set of slides with name - Health Indicating Monitor Information Technology Icon. This is a one stage process. The stages in this process are Health Information Technology, Hit, Health Information Management.
-
 Health indicating watch information technology icon
Presenting this set of slides with name - Health Indicating Watch Information Technology Icon. This is a one stage process. The stages in this process are Health Information Technology, Hit, Health Information Management.
-
 Mobile with health indicators information technology icon
Presenting this set of slides with name - Mobile With Health Indicators Information Technology Icon. This is a nine stage process. The stages in this process are Health Information Technology, Hit, Health Information Management.
-
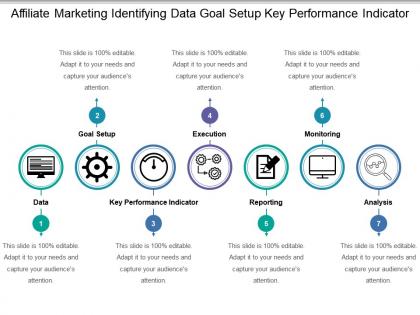 Affiliate marketing identifying data goal setup key performance indicator
Presenting this set of slides with name - Affiliate Marketing Identifying Data Goal Setup Key Performance Indicator. This is a seven stage process. The stages in this process are Affiliate Marketing, Referral Marketing, Pay Per Sale.
-
 High medium low independence matrix with colour indicators
Presenting this set of slides with name - High Medium Low Independence Matrix With Colour Indicators. This is a three stage process. The stages in this process are High Medium Low, High Moderate Low, Top Medium Low.
-
 High medium low priority risk shown as metric indicators
Presenting this set of slides with name - High Medium Low Priority Risk Shown As Metric Indicators. This is a three stage process. The stages in this process are High Medium Low, High Moderate Low, Top Medium Low.
-
 Threshold stability indices vehicles dynamics model summing point
Presenting this set of slides with name - Threshold Stability Indices Vehicles Dynamics Model Summing Point. This is a four stage process. The stages in this process are Threshold Stability Indices, Vehicles Dynamics Model, Summing Point.
-
 Performance evaluation with circular indicator with percentage
Presenting this set of slides with name - Performance Evaluation With Circular Indicator With Percentage. This is a four stage process. The stages in this process are Performance Evaluations, Performance Management, Performance Analysis.
-
 Decisions analytics information flow key performance indicators metrics
Presenting this set of slides with name - Decisions Analytics Information Flow Key Performance Indicators Metrics. This is an editable eight stages graphic that deals with topics like Decisions Analytics, Information Flow, Key Performance Indicators Metrics to help convey your message better graphically. This product is a premium product available for immediate download, and is 100 percent editable in Powerpoint. Download this now and use it in your presentations to impress your audience.
-
 Marketing metrics continuum showing predictive leading indicators
Presenting this set of slides with name - Marketing Metrics Continuum Showing Predictive Leading Indicators. This is a five stage process. The stages in this process are Continuum, Continuity, Circular.
-
 Start stop icons with adjusting indicators
Presenting this set of slides with name - Start Stop Icons With Adjusting Indicators. This is a six stage process. The stages in this process are Start Stop, On Off, Start Pause.
-
 Data information human rights indicator conference global survey
Presenting this set of slides with name - Data Information Human Rights Indicator Conference Global Survey. This is an editable four stages graphic that deals with topics like Data Information, Human Rights, Indicator Conference, Global Survey to help convey your message better graphically. This product is a premium product available for immediate download and is 100 percent editable in Powerpoint. Download this now and use it in your presentations to impress your audience.
-
 Road condition information threshold stability indices vehicles dynamics model
Presenting this set of slides with name - Road Condition Information Threshold Stability Indices Vehicles Dynamics Model. This is an editable eleven stages graphic that deals with topics like Road Condition Information, Threshold Stability Indices, Vehicles Dynamics Model to help convey your message better graphically. This product is a premium product available for immediate download, and is 100 percent editable in Powerpoint. Download this now and use it in your presentations to impress your audience.
-
 Key performance indicator target customer revenue streams cost structure
Presenting this set of slides with name - Key Performance Indicator Target Customer Revenue Streams Cost Structure. This is an editable four graphic that deals with topics like Key Performance Indicator, Target Customer, Revenue Streams Cost Structure to help convey your message better graphically. This product is a premium product available for immediate download, and is 100 percent editable in Powerpoint. Download this now and use it in your presentations to impress your audience.
-
 Build quality indicators change request code review request
Presenting this set of slides with name - Build Quality Indicators Change Request Code Review Request. This is an editable four stages graphic that deals with topics like Build Quality Indicators, Change Request, Code Review Request to help convey your message better graphically. This product is a premium product available for immediate download, and is 100 percent editable in Powerpoint. Download this now and use it in your presentations to impress your audience.
-
 Relocation two house with arrows pointing indicating moving
Presenting this set of slides with name - Relocation Two House With Arrows Pointing Indicating Moving. This is a two stage process. The stages in this process are Relocation, Offshoring, Outsourcing.
-
 Project status indicator project timeline chart ongoing activities
Presenting this set of slides with name - Project Status Indicator Project Timeline Chart Ongoing Activities. This is an editable four stages graphic that deals with topics like Project Status Indicator, Project Timeline Chart, Ongoing Activities to help convey your message better graphically. This product is a premium product available for immediate download, and is 100 percent editable in Powerpoint. Download this now and use it in your presentations to impress your audience.
-
 0414 business consulting diagram 3d business indicator diagram powerpoint slide template
Well-made and outfitted with expert points of interest. Stunning utilization of hues and visuals. Impressive picture quality with high determination. Images don't pixelate when anticipated on wide screen. Can be effortlessly downloaded and spared in any configuration. Compatible with number of on the web and disconnected programming choices. Ease of personalization with organization name, logo and trademark. Easily editable slide outlines.
-
 0414 business consulting diagram three level indicator business diagram powerpoint slide template
We are proud to present our 0414 business consulting diagram three level indicator business diagram powerpoint slide template. Our Business consulting diagram three level Indicator business diagram PowerPoint slide template Power Point Templates Provide The Skeleton Of Your Presentation. Flesh Them Out With Your Weighty Ideas. Our Arrows Power Point Templates Are The Sinews Of Your Lecture. Give Them The Muscle Of Your Vibrant Thoughts.
-
 0314 business ppt diagram warning sign indicates hazard ahead powerpoint template
We are proud to present our 0314 business ppt diagram warning sign indicates hazard ahead powerpoint template. A two sided circular graph is used in this Power Point template. This business PPT is can be used to display any business related data in your presentation.
-
 0514 key performance indicators for project management powerpoint presentation
Businessmen, micro, small and medium enterprises can use the PPT visual as a master slide. PowerPoint presentation supports filling background in a different color from the text. All images are 100% editable in the presentation slide. Text can be differentiated form the background by the handy features provided by PPT layout. There is no space constrain in the PowerPoint design, thus enabling easy addition or edition of data. Smooth functioning is ensured by the presentation slide show on all software’s.
-
 0714 key performance indicators customer service powerpoint presentation slide template
We are proud to present our 0714 key performance indicators customer service powerpoint presentation slide template. Multiple graphics in a circle with various levels of customer satisfaction have been used in this diagram. This diagram is designed to explain key performance indicators in customer service. Use this diagram for customer service in any business, marketing or sales related topics. Set a milestone in presentation making with this exclusive diagram.
-
 0714 key performance indicators of a company powerpoint presentation slide template
We are proud to present our 0714 key performance indicators of a company powerpoint presentation slide template. This is an innovative business diagram with dialog bubble designed by human hand holding brush. Use this diagram to display key performance indicators in any company. Business, sales and managements are the topics, which may well explained by using this diagram in any presentation.
-
 1214 fuel gauge indicator powerpoint presentation
We are proud to present our 1214 fuel gauge indicator powerpoint presentation. This Power Point template has been designed with meter. This black meter is indicating the fuel gauge. Use this PPT for your business and technology related presentations.
-
 1214 loading bar progress indicator powerpoint presentation
Eye- catchy PPT presentation layouts. Popular in the business world for their uniqueness and accuracy. Indicates the progression of business processes in a visual and interesting manner. Helps in the process of decision and strategy making. Easy to merge and to operate without any hassles. Can be downloaded instantly to save your valuable time.
-
 1214 three sequential indicator diagram powerpoint template
Very useful tool for marketing and business related presentations. Can be used by professionals working in marketing firm. Compatible with Google slides and other softwares. High def. graphics leave no scope for pixilation when projected on bigger screens. No space constraints which allow addition of titles. Customisable in terms of color and font size. Convertible into JPEG or PDF format
-
 1114 car dashboard snapshot indicator powerpoint presentation
Made up of sufficient slides of high resolution. Authentic content with flexible data. Adaptable background with color, font and layout. It can be easily converted into PDF and JPG format. Alluring graphs for comparison and fascinating figures to illustrate the concepts. Beneficial for the students, business professional, corporate people and researchers. Format options. You can experience it in full version after downloading.
-
 1114 how to measure key perfomance indicator powerpoint presentation
We are proud to present our 1114 how to measure key perfomance indicator powerpoint presentation. This Power Point diagram slide has been crafted with graphic of flower petal diagram. This PPT slide contains the concept of measuring the key performance and indicate it. Use this PPT slide for your management related presentations.
-
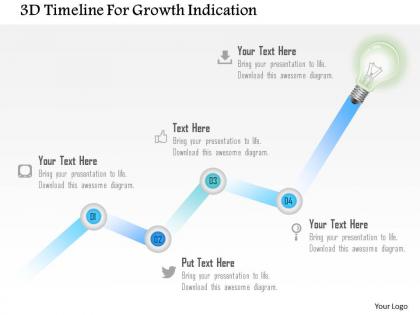 1214 3d timeline for growth indication powerpoint template
We are proud to present our 1214 3d timeline for growth indication powerpoint template. A sequential time line diagram has been used to craft this power point image template. This image template contains the concept of growth indication. Use this image template for your business and success related presentations.
-
 1114 multiple cells for charging indication diagram powerpoint template
We are proud to present our 1114 multiple cells for charging indication diagram powerpoint template. This Power Point template slide has been designed with graphic of apps on mobile. This PPT slide contains the concept of mobile application and mobile technology. Use this PPT slide and display mobile apps related topics in your presentations with this unique PPT.
-
 0115 three speed meter of fuel indication powerpoint template
Extremely beneficial for professionals working in mechanical or technological field. The format of the slide can be easily changed into PDF or JPEG. Great compatibility with Google slides and other softwares. Easily customisable in terms of color, font and size allowing user to have pin-point control. High definition graphics do not pixelate when projected on bigger screen. Company logo or trademark can be easily introduced within the template.
-
 0115 pie chart and magnifier for performance indication powerpoint template
Ideal for marketing professionals, business managers, entrepreneurs and big organizations. This presentation theme is totally attuned with Google slide. Easy conversion to other software’s like JPG and PDF formats. Image quality remain the unchanged even when resize the image. Change PowerPoint design’s font, text, color and design as per your manner. Easy to put in company logo, brand or name.
-
 0115 thermometer with indication and bar graph powerpoint template
Amazing quality resolution presentation design. Perfect picture quality as pixels don’t break when viewed in widescreen view. Well Assorted with online software programs such as JPG and PDF. PowerPoint illustration can be amended easily as access to change color, text and layout. Similar PPT visual accessible with different nodes and stages. Personalize the presentation with your organization insignia and designation.
-
 Four battery icons for charging indication flat powerpoint design
Picture quality does not deter when opened on a big screen display. Trouble-free incorporation of customized content or graphics. Provided guidance to modify the graphical content. Save the presentation visual in JPG or PDF format. Compatible with the online as well as offline PowerPoint softwares. Vivacious background of the slide icons. Effectively useful for the Marketing professionals, interpreters and the strategy designers.
-
 Value indication with feedback flat powerpoint design
We are proud to present our value indication with feedback flat powerpoint design. This power point template diagram has been crafted with graphic of five tags. This PPT diagram contains the concept of value indication. Use this PPT diagram for business presentations.
-
 Progress level indication for process flat powerpoint design
Simple data input like company logo, name or trademark. This PowerPoint icon is fully supported by Google slides. Picture quality doesn’t fade away even when project on large screen. Fast downloading speed and formats can be easily changed to JPEG and PDF applications. Perfect for marketing, sales persons, business managers and entrepreneurs. Adjust PPT layout, font, text and color as per your necessity.
-
 Financial target indication for success flat powerpoint design
We are proud to present our financial target indication for success flat powerpoint design. Concept of financial target indication and success has been displayed in this PPT diagram. This PPT diagram contains the graphic of target board and arrows. Use this PPT diagram for finance related topics in any presentation.
-
 Danger indication for field flat powerpoint design
We are proud to present our danger indication for field flat powerpoint design. Explain the concept and importance of danger indication with this exclusive PPT. This PPT diagram contains the graphic of danger sign. Use this PPT diagram and build an innovative presentation for danger related topics
-
 Gears for process control indication flat powerpoint design
Visually appealing PowerPoint presentation pattern. The presentation template can be downloaded and saved in any desired format. Privilege of insertion of logo and trademarks for more personalization. Download is quick and can be easily shared. Fully modifiable Presentation slide as editing is possible. Access to transform the Presentation design into JPG and PDF. High quality images and visuals used in the PPT design.
-
 Indication meter of various stages flat powerpoint design
We are proud to present our indication meter of various stages flat powerpoint design. Graphic of indication meter has been used to craft this power point template diagram. This PPT diagram contains the concept of control indication. Use this PPT diagram for business and technology related presentations.
-
 Tree made with gears for growth indication flat powerpoint design
We are proud to present our tree made with gears for growth indication flat powerpoint design. Concept of growth indication has been defined in this PPT diagram. This PPT diagram contains the graphic of tree made with gears. Use this PPT diagram for business and marketing related presentations.
-
 Puzzles for leadership indication powerpoint template
We are proud to present our puzzles for leadership indication powerpoint template. Concept of leadership has been displayed in this power point template diagram. This PPT diagram contains the graphic of puzzles and one blue puzzle. Use this PPT diagram for business and marketing related presentations.
-
 Flashlight for search indication flat powerpoint design
We are proud to present our flashlight for search indication flat powerpoint design. This power point template diagram has been crafted with graphic of flashlight. This diagram contains the concept of search indication. Use this PPT diagram for business and technology related presentations.
-
 Three level growth indication flat powerpoint design
We are proud to present our three level growth indication flat powerpoint design. Show the business growth in any presentation with this PPT diagram. This PPT diagram contains the graphic of three level flower pot diagram in growing manner. Use this PPT for growth related topics in any presentation.
-
 Data indication growth chart flat powerpoint design
We are proud to present our data indication growth chart flat powerpoint design. A X-Y chart with growth arrow has been used to design this power point template. This PPT diagram contains the growth indication based on data. Use this PPT diagram for business and sales based data representation in any presentation.
-
 Business result analysis indication flat powerpoint design
Miraculous presented PowerPoint graphics which are very useful for the business analysts , business students and professionals etc., Easily access able into divergent file compositions like PDF or JPG , Insert able trade name or mark or company logo or emblem, Wholly customize able matters, PowerPoint image, structure, intensity etc., Adaptable with all the operating software’s and Google drives.
-
 Option indication chain diagram flat powerpoint design
We are proud to present our option indication chain diagram flat powerpoint design. This power point template diagram has been crafted with graphic of chain diagram. This PPT diagram contains the concept of option indication. Use this PPT diagram for marketing and business related presentations.
-
 Three staged funnel for growth and search indication flat powerpoint design
Revamp able Presentation designs, contents, themes, symbols according to necessity, Diverse into different layouts like JPG or PDF, Germane for the business experts, students and other professionals from various sectors, sufficient room available to reinstate the dummy Presentation graphics data, Can easily insert the company logo or emblems also, well versed with all Google slides and available software’s.
-
 Growth indication with bar graph and process control flat powerpoint design
We are proud to present our growth indication with bar graph and process control flat powerpoint design. Graphic of bar graph has been used to craft this power point template diagram. This PPT diagram contains the concept of result analysis and process control. Use this PPT diagram for business and marketing related presentations and get good remarks.
-
 Money growth and saving indication flat powerpoint design
We are proud to present our money growth and saving indication flat powerpoint design. This power point template diagram has been crafted with graphic of umbrella and coins. This PPT diagram contains the concept of saving indication. Use this PPT diagram for finance and money related presentations.
-
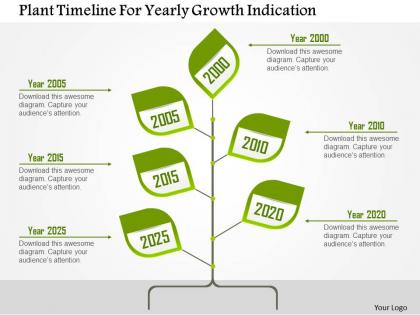 Plant timeline for yearly growth indication flat powerpoint design
We are proud to present our plant timeline for yearly growth indication flat powerpoint design. Plant timeline for yearly growth diagram has been used to design this power point template. This PPT diagram contains the concept of growth indication. Use this diagram template for business and management related presentations.
-
 Sequential growth indication chart flat powerpoint design
We are proud to present our sequential growth indication chart flat powerpoint design. This power point template diagram contains the graphic of growth indication chart. This PPT diagram contains the concept of sequential growth. Use this PPT diagram for business related presentations.
-
 Three teams with compass for direction indication flat powerpoint design
We are proud to present our three teams with compass for direction indication flat powerpoint design. This power point template diagram has been designed with graphic of three teams and compass. These teams are used to show teamwork and direction indication. Use this PPT diagram for business and management related presentations.
-
 Lego blocks bar graph for growth indication flat powerpoint design
We are proud to present our lego blocks bar graph for growth indication flat powerpoint design. Graphic of Lego block bar graph has been used to craft this power point template diagram. This PPT diagram contains the concept of growth indication. Use this PPT diagram for finance and business related presentation.
-
 Meter with client satisfaction level indication flat powerpoint design
We are proud to present our meter with client satisfaction level indication flat powerpoint design. Graphic of meter has been used to design this power point template diagram. This PPT diagram contains the concept of client satisfaction level indication. Use this PPT diagram for business and marketing related presentations.
-
 Two Charts Pros And Cons Indication Flat Powerpoint Design
Presenting two charts pros and cons indication flat PowerPoint design. This PPT slide offers you plenty of space to put in titles and sub titles. High resolution based presentation layout, does not change the image quality even after resizing. This presentation is fully compatible with Google slides. Quick downloading speed and simple editing options in color text and fonts. PPT icons can easily be changed into JPEG and PDF applications. This diagram has been designed for entrepreneurs, corporate and business managers. Easy to use, edit and you can design attractive slides within few minutes.
-
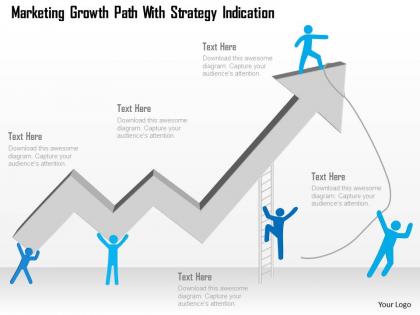 Marketing growth path with strategy indication powerpoint template
We are proud to present our marketing growth path with strategy indication powerpoint template. Concept of marketing growth with strategy has been displayed in this PPT diagram. This PPT diagram contains graphic of growth arrow and 3d men. Use this PPT diagram for finance and marketing related presentations.
-
 Roadmap with location indication powerpoint template
We are proud to present our roadmap with location indication powerpoint template. Graphic of roadmap with location has been used to craft this power point template. This PPT diagram contains the concept of location indication on map. Use this PPT diagram for business and marketing related presentations.
-
 Planning tables with right and cross indication flat powerpoint design
We are proud to present our planning tables with right and cross indication flat powerpoint design. Concept of planning and decision making has been displayed in this PPT diagram. This PPT diagram contains the graphic of planning table and right and cross symbol indication. Use this PPT diagram for business and marketing related presentations.
-
 Focus on weak link indication flat powerpoint design
Easy to download without any hassles. High resolution PPT infographics with fully modifiable size and orientation. Absolutely modifiable color scheme and contrast of PPT images. Add text as per requirement without length constraints. Project anywhere on wide screen without pixilation and edit without loss of resolution. Run effortlessly with Google slides and convert seamlessly to JPG or PDF formats.


