Powerpoint Templates and Google slides for Illustrating Operating
Save Your Time and attract your audience with our fully editable PPT Templates and Slides.
-
 Global Security Insurance Company Business Operations Illustrating Features
Deliver a credible and compelling presentation by deploying this Global Security Insurance Company Business Operations Illustrating Features. Intensify your message with the right graphics, images, icons, etc. presented in this complete deck. This PPT template is a great starting point to convey your messages and build a good collaboration. The twelve slides added to this PowerPoint slideshow helps you present a thorough explanation of the topic. You can use it to study and present various kinds of information in the form of stats, figures, data charts, and many more. This Global Security Insurance Company Business Operations Illustrating Features PPT slideshow is available for use in standard and widescreen aspects ratios. So, you can use it as per your convenience. Apart from this, it can be downloaded in PNG, JPG, and PDF formats, all completely editable and modifiable. The most profound feature of this PPT design is that it is fully compatible with Google Slides making it suitable for every industry and business domain.
-
 Statistical Graph Illustrating Automated Networking Operations
This slide showcases the statistical graph highlighting automated networking operations which helps an organization to improve scalability, security and reduce operational costs. It include details such as configuration generation, data collection, software updates, etc. Introducing our Statistical Graph Illustrating Automated Networking Operations set of slides. The topics discussed in these slides are Configuration Generation, Highest Automated Network Operations, Potential Benefits. This is an immediately available PowerPoint presentation that can be conveniently customized. Download it and convince your audience.
-
 Industrial Automation With IoT Robotics To Operational Tasks Illustration
This coloured PowerPoint icon depicts the use of industrial automation and IoT robotics to enhance operational tasks. It is ideal for presentations on industrial automation, robotics, and IoT technology.
-
 IoT Operations Monitoring In Oil And Gas Industry Illustration
This icon depicts an IoT operations monitoring system in the oil and gas industry. It is a vibrant and colourful illustration of the technology used to monitor and control operations in the industry.
-
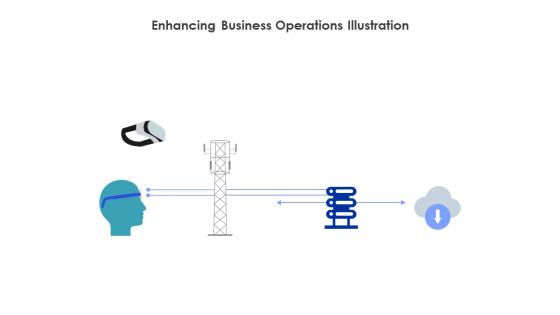
 Enhancing Business Operations Illustration
This coloured PowerPoint icon represents a cutting-edge 5G XR solution designed to enhance the retail experience. With this technology, retailers can optimize their store layouts, inventory management, and customer interactions, resulting in a more efficient and personalized shopping experience for their customers. Take your retail business to the next level with this innovative solution.
-
 Tower Operations Management Illustration
Introducing our vibrant and eye-catching PowerPoint icon for Digital Infrastructure in Telecom Tower Operations Management. This icon represents the crucial role of digital infrastructure in managing telecom tower operations. With its bold colors and sleek design, it is perfect for presentations and materials related to this topic.
-
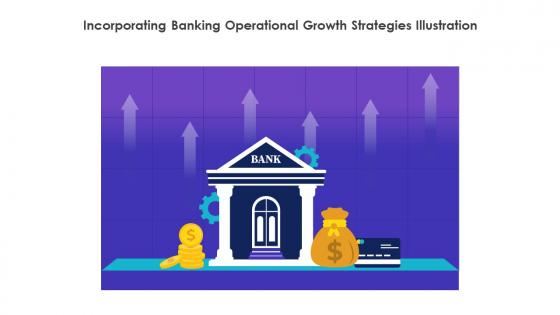
 Incorporating Banking Operational Growth Strategies Illustration
Enhance your banking operations with our vibrant PowerPoint icon, featuring a modern design and bold colors. Perfect for presentations on implementing growth strategies in the banking industry, this icon will add a professional touch to your slides and captivate your audience. Download now and elevate your presentations.
-
 Devops Blockchain Operations Infinity Symbol Illustration
This vibrant powerpoint icon features a combination of DevOps and Blockchain elements, making it the perfect addition to any presentation on these cutting-edge technologies. With its bold colors and sleek design, this icon will help capture the attention of your audience and enhance the visual appeal of your slides.
-
 Finance KPI Dashboard Illustrating Gross And Operating Profit Margin
Introducing our Finance KPI Dashboard Illustrating Gross And Operating Profit Margin set of slides. The topics discussed in these slides are Gross Profit Margin, Operating Profit Margin, Net Profit Margin. This is an immediately available PowerPoint presentation that can be conveniently customized. Download it and convince your audience.
-
 Corporate Dashboard Illustrating Revenue And Operational Expenses
This graph or chart is linked to excel, and changes automatically based on data. Just left click on it and select edit data. Introducing our Corporate Dashboard Illustrating Revenue And Operational Expenses set of slides. The topics discussed in these slides are Gross Profit Margin, PEX Ratio, EBIT Margin, Net Profit Margin. This is an immediately available PowerPoint presentation that can be conveniently customized. Download it and convince your audience.
-
 Project Report Illustrating IT Operations Status
Following slide outlines a project report which can be used by PM to overview the status of IT operations. The report provides detailed information about project name and overview, sponsor, budget, critical success factors, benefits and possible risks. Presenting our well structured Project Report Illustrating IT Operations Status. The topics discussed in this slide are Budget, Operations Status, Risks. This is an instantly available PowerPoint presentation that can be edited conveniently. Download it right away and captivate your audience.
-
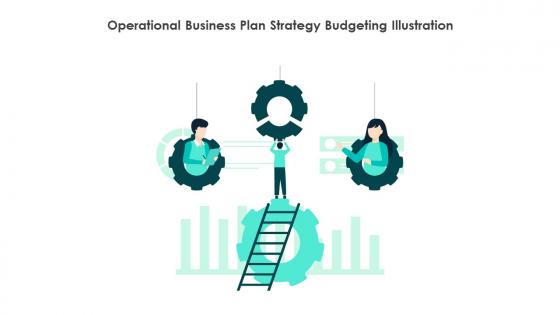
 Operational Business Plan Strategy Budgeting Illustration
This coloured powerpoint Illustration is a visual representation of an operational plan. It is a great way to illustrate the objectives, strategies and actions of a business plan in a simple and easy to understand format. The Illustration is bright and vibrant, making it stand out on any presentation.
-
 Automating IT Operations Management Tools It Process Illustration
This powerpoint Illustration is a colourful representation of automating IT operations management. It is perfect for presentations on streamlining IT processes and improving efficiency. It can be used to illustrate the benefits of automation and the potential for increased productivity.
-
 Finance AI Application Improving Operations With Machine Learning Illustration
This coloured powerpoint Illustration is perfect for illustrating the use of Finance AI Application to improve operations with Machine Learning. It features a vibrant and modern design, and is perfect for presentations, websites, and other digital media.
-
 Operational Risk Management And Mitigation Illustration
This coloured PowerPoint Illustration is an illustration of operational risk management and mitigation. It provides a visual representation of how to identify, assess, and manage risks in order to reduce their impact on business operations. It is a useful tool for improving operational efficiency and ensuring business continuity.
-
 EDW System To Improve Business Operational Efficiency Illustration
This coloured PowerPoint Illustration is a visual representation of EDW System to Improve Operational Efficiency. It is designed to help businesses streamline their processes and increase efficiency, resulting in improved productivity and cost savings.
-
 AI For Effective It Operations Management Illustration
This coloured PowerPoint Illustration on AI for Effective IT Operations Management is designed to provide users with a comprehensive overview of the latest advances in AI driven IT operations. It is easy to use and provides up to date insights into the latest trends in AI driven IT operations management. With this Illustration, users can easily identify potential areas for improvement and develop strategies to maximize efficiency.
-
 Icon illustrating decision tree analysis for user flow operations
Presenting this set of slides with name Icon Illustrating Decision Tree Analysis For User Flow Operations. This is a one stage process. The stage in this process is Icon Illustrating Decision Tree Analysis For User Flow Operations. This is a completely editable PowerPoint presentation and is available for immediate download. Download now and impress your audience.
-
 Staircase timeline illustrating scaling business beyond its current operations
Presenting this set of slides with name Staircase Timeline Illustrating Scaling Business Beyond Its Current Operations. This is a four stage process. The stages in this process are Collaborations, Growth, Strengths. This is a completely editable PowerPoint presentation and is available for immediate download. Download now and impress your audience.
-
 Icon illustrating operational workflow process map
Presenting this set of slides with name Icon Illustrating Operational Workflow Process Map. This is a three stage process. The stages in this process are Icon Illustrating Operational Workflow Process Map. This is a completely editable PowerPoint presentation and is available for immediate download. Download now and impress your audience.
-
 Six point illustration for web server operating system infographic template
Deploy our Six Point Illustration For Web Server Operating System Infographic Template to present high quality presentations. It is designed in PowerPoint and is available for immediate download in standard and widescreen sizes. Not only this, but this layout is also 100 percent editable, giving you full control over its applications.
-
 4 point illustration for sales operations planning infographic template
Deploy our 4 Point Illustration For Sales Operations Planning Infographic Template to present high quality presentations. It is designed in PowerPoint and is available for immediate download in standard and widescreen sizes. Not only this, but this layout is also 100 percent editable, giving you full control over its applications.
-
 Icon illustrating global security of business operations
Introducing our premium set of slides with Icon Illustrating Global Security Of Business Operations. Elucidate the three stages and present information using this PPT slide. This is a completely adaptable PowerPoint template design that can be used to interpret topics like Icon Illustrating, Global Security, Business Operations. So download instantly and tailor it with your information
-
 Horizontal pillar illustrating operating system components
Presenting our set of slides with name Horizontal Pillar Illustrating Operating System Components. This exhibits information on seven stages of the process. This is an easy to edit and innovatively designed PowerPoint template. So download immediately and highlight information on Horizontal Pillar, Illustrating Operating, System Components.
-
 Budget vs forecast vs actual illustrating capital and operating expenses
Presenting our well-structured Budget Vs Forecast Vs Actual Illustrating Capital And Operating Expenses. The topics discussed in this slide are Capital, Operating. This is an instantly available PowerPoint presentation that can be edited conveniently. Download it right away and captivate your audience.
-
 Budget vs forecast vs actual illustrating net operating income
Introducing our Budget Vs Forecast Vs Actual Illustrating Net Operating Income set of slides. The topics discussed in these slides are Revenue, Product Sales, Expenses, Gross Profit, Marketing Expenses. This is an immediately available PowerPoint presentation that can be conveniently customized. Download it and convince your audience.
-
 Spaghetti diagram illustrating assembly line and machines in business operations
Introducing our Spaghetti Diagram Illustrating Assembly Line And Machines In Business Operations set of slides. The topics discussed in these slides are Spaghetti Diagram Illustrating Assembly Line And Machines In Business Operations. This is an immediately available PowerPoint presentation that can be conveniently customized. Download it and convince your audience.


