Powerpoint Templates and Google slides for Highlighted
Save Your Time and attract your audience with our fully editable PPT Templates and Slides.
-
 Graph Highlighting Industrial Relation Disputes For Different Years
This slide covers graph which shows strikes and Lockouts from the period of 2017 to 2021. This slide highlights strikes and Lockouts are the top main reasons for poor industrial relations. Introducing our Graph Highlighting Industrial Relation Disputes For Different Years set of slides. The topics discussed in these slides are Graph Highlighting, Industrial Relation Disputes, Different Years. This is an immediately available PowerPoint presentation that can be conveniently customized. Download it and convince your audience.
-
 Chart Highlighting User Time Spending On Social Media By Age Groups
Introducing our Chart Highlighting User Time Spending On Social Media By Age Groups set of slides. The topics discussed in these slides are Chart Highlighting User, Time Spending, Social Media, By Age Groups. This is an immediately available PowerPoint presentation that can be conveniently customized. Download it and convince your audience.
-
 KPI Dashboard Highlighting Results Of Omnichannel Retail Marketing
The purpose of this slide is to highlight a comprehensive dashboard of omnichannel retail. The key metrics covered in the slide are types of marketing channels, comparison of channels for two different years, transactions by months etc. Presenting our well-structured KPI Dashboard Highlighting Results Of Omnichannel Retail Marketing. The topics discussed in this slide are KPI Dashboard, Omnichannel Retail Marketing. This is an instantly available PowerPoint presentation that can be edited conveniently. Download it right away and captivate your audience.
-
 Using Bpm Tool To Drive Value For Business Forecasted Sales Performance Highlights For 2021
Mentioned slide displays forecasted sales performance highlights of the firm for 2021. Here the graph indicates that category 4 will be the most selling product category in 2021. Deliver an outstanding presentation on the topic using this Using Bpm Tool To Drive Value For Business Forecasted Sales Performance Highlights For 2021. Dispense information and present a thorough explanation of Performance, Product, Indicates using the slides given. This template can be altered and personalized to fit your needs. It is also available for immediate download. So grab it now.
-
 Key Performance Indicators Highlighting Current Problems Of Software Implementation Project Plan
This slide represents the key performance indicators to track the problems faced by organization and draw effective strategies to tackle the problems. It includes key performance indicators of decline in organizational sales and customer engagement rate. Present the topic in a bit more detail with this Key Performance Indicators Highlighting Current Problems Of Software Implementation Project Plan. Use it as a tool for discussion and navigation on Performance, Organization, Engagement. This template is free to edit as deemed fit for your organization. Therefore download it now.
-
 Banking Operation Strategy Dashboard Highlighting Operational Process Management In The Banking
This slide highlights the banking operation strategy dashboard which showcases current account and saving account growth rate, savings account deposits, current account deposits and retail term deposits. Deliver an outstanding presentation on the topic using this Banking Operation Strategy Dashboard Highlighting Operational Process Management In The Banking. Dispense information and present a thorough explanation of Operation, Strategy, Dashboard using the slides given. This template can be altered and personalized to fit your needs. It is also available for immediate download. So grab it now.
-
 Operational Process Management In The Banking Banking Operation Strategy Dashboard Highlighting
This slide highlights the banking operation strategy which includes accounts opened and closed, total deposit vs branch goal, accounts by type, expense to budget and referrals by product. Present the topic in a bit more detail with this Operational Process Management In The Banking Banking Operation Strategy Dashboard Highlighting. Use it as a tool for discussion and navigation on Operation, Strategy, Dashboard. This template is free to edit as deemed fit for your organization. Therefore download it now.
-
 Banking Operation Strategy Dashboard Highlighting Deposits Operational Transformation Banking Model
This slide highlights the banking operation strategy dashboard which showcases current account and saving account growth rate, savings account deposits, current account deposits and retail term deposits. Deliver an outstanding presentation on the topic using this Banking Operation Strategy Dashboard Highlighting Deposits Operational Transformation Banking Model. Dispense information and present a thorough explanation of Operation, Strategy, Dashboard using the slides given. This template can be altered and personalized to fit your needs. It is also available for immediate download. So grab it now.
-
 Operational Transformation Banking Model Banking Operation Strategy Dashboard Highlighting Accounts
This slide highlights the banking operation strategy which includes accounts opened and closed, total deposit vs branch goal, accounts by type, expense to budget and referrals by product. Deliver an outstanding presentation on the topic using this Operational Transformation Banking Model Banking Operation Strategy Dashboard Highlighting Accounts. Dispense information and present a thorough explanation of Operation, Strategy, Dashboard using the slides given. This template can be altered and personalized to fit your needs. It is also available for immediate download. So grab it now.
-
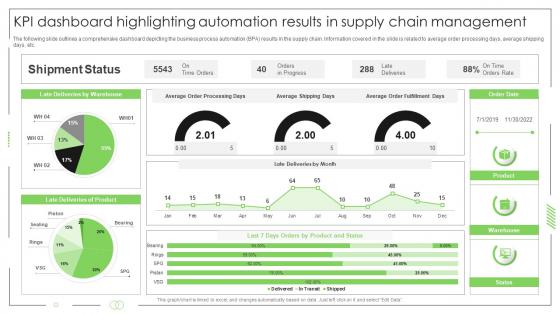 Business Process Automation KPI Dashboard Highlighting Automation Results In Supply Chain Management
The following slide outlines a comprehensive dashboard depicting the business process automation BPA results in the supply chain. Information covered in the slide is related to average order processing days, average shipping days, etc.Deliver an outstanding presentation on the topic using this Business Process Automation KPI Dashboard Highlighting Automation Results In Supply Chain Management. Dispense information and present a thorough explanation of Shipment Status, Late Deliveries, Deliveries Product using the slides given. This template can be altered and personalized to fit your needs. It is also available for immediate download. So grab it now.
-
 Risk Reduction Strategies Stakeholders Key Statistics Highlighting Various Risks Faced By Real Estate Managers
The following slide exhibits major statistics illustrating the different risks faced by the real estate owners and managers in two years. Information covered in this slide is related to physical property damager, tenant risks, administrative risks, cyber risks and employment issues. Deliver an outstanding presentation on the topic using this Risk Reduction Strategies Stakeholders Key Statistics Highlighting Various Risks Faced By Real Estate Managers. Dispense information and present a thorough explanation of Statistics, Highlighting, Corporate using the slides given. This template can be altered and personalized to fit your needs. It is also available for immediate download. So grab it now.
-
 Key Statistics Highlighting Various Managers Implementing Risk Mitigation Strategies For Real
following slide exhibits major statistics illustrating the different risks faced by the real estate owners and managers in two years. Information covered in this slide is related to physical property damager, tenant risks,administrative risks, cyber risks and employment issues.Present the topic in a bit more detail with this Key Statistics Highlighting Various Managers Implementing Risk Mitigation Strategies For Real. Use it as a tool for discussion and navigation on Various Cybercrimes, Estate Managers, Difficulty Dealing. This template is free to edit as deemed fit for your organization. Therefore download it now.
-
 KPI Metrics Dashboard Highlighting Profitability And Liquidity Ultimate Guide To Financial Planning
The following slide outlines key performance indicator KPI dashboard showcasing various financial metrics of the organization. The key metrics are gross revenue, product revenue, service revenue, gross profit, net profit etc. Present the topic in a bit more detail with this KPI Metrics Dashboard Highlighting Profitability And Liquidity Ultimate Guide To Financial Planning. Use it as a tool for discussion and navigation on Gross Revenue, Gross Profit, Product Revenue. This template is free to edit as deemed fit for your organization. Therefore download it now.
-
 HR Induction Dashboard Highlighting Employee Headcount Staff Induction Training Guide
This slide highlights the HR induction dashboard which includes average salary, headcount, turnover rate, employees hired and employees left rate, average age with employment contract and status. Present the topic in a bit more detail with this HR Induction Dashboard Highlighting Employee Headcount Staff Induction Training Guide. Use it as a tool for discussion and navigation on Type Employment Contract, Employment Status, Employees. This template is free to edit as deemed fit for your organization. Therefore download it now.
-
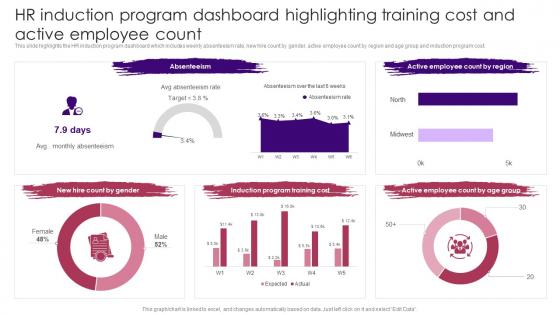 HR Induction Program Dashboard Highlighting Training Cost Staff Induction Training Guide
This slide highlights the HR induction program dashboard which includes weekly absenteeism rate, new hire count by gender, active employee count by region and age group and induction program cost. Deliver an outstanding presentation on the topic using this HR Induction Program Dashboard Highlighting Training Cost Staff Induction Training Guide. Dispense information and present a thorough explanation of Absenteeism, Induction Program, Training Cost, Active Employee using the slides given. This template can be altered and personalized to fit your needs. It is also available for immediate download. So grab it now.
-
 Forecasted Sales Performance Highlights For 2022 Selecting The Suitable BPM Tool For Efficiently
Mentioned slide displays forecasted sales performance highlights of the firm for 2022. Here the graph indicates that category 4 will be the most selling product category in 2022.Present the topic in a bit more detail with this Forecasted Sales Performance Highlights For 2022 Selecting The Suitable BPM Tool For Efficiently. Use it as a tool for discussion and navigation on Record Significant, Sales Performance, Sales Percentage. This template is free to edit as deemed fit for your organization. Therefore download it now.
-
 Forecasted Sales Performance Highlights For 2021 Improving Business Efficiency Using
Mentioned slide displays forecasted sales performance highlights of the firm for 2021. Here the graph indicates that category 4 will be the most selling product category in 2021.Deliver an outstanding presentation on the topic using this Forecasted Sales Performance Highlights For 2021 Improving Business Efficiency Using. Dispense information and present a thorough explanation of Significant Increase, Performance Categories, Sales Percentage using the slides given. This template can be altered and personalized to fit your needs. It is also available for immediate download. So grab it now.
-
 Business Sales Highlights With Pushed Opportunities
Introducing our Business Sales Highlights With Pushed Opportunities set of slides. The topics discussed in these slides are Business Sales, Pushed Opportunities. This is an immediately available PowerPoint presentation that can be conveniently customized. Download it and convince your audience.
-
 Company Sales Highlights In Different Years
Presenting our well-structured Company Sales Highlights In Different Years. The topics discussed in this slide are Company Sales, Different Years. This is an instantly available PowerPoint presentation that can be edited conveniently. Download it right away and captivate your audience.
-
 Company Sales Highlights With Average Profit
Introducing our Company Sales Highlights With Average Profit set of slides. The topics discussed in these slides are Company Sales, Average Profit. This is an immediately available PowerPoint presentation that can be conveniently customized. Download it and convince your audience.
-
 Company Sales Highlights With Target Percentage
Presenting our well-structured Company Sales Highlights With Target Percentage. The topics discussed in this slide are Company Sales, Target Percentage. This is an instantly available PowerPoint presentation that can be edited conveniently. Download it right away and captivate your audience.
-
 Graphical Representation Of Firm Sales Highlights
Introducing our Graphical Representation Of Firm Sales Highlights set of slides. The topics discussed in these slides are Sale Revenue, Profit, Average Revenue, New Customer. This is an immediately available PowerPoint presentation that can be conveniently customized. Download it and convince your audience.
-
 Product Sales Highlights For Generating Revenues
Presenting our well-structured Product Sales Highlights For Generating Revenues. The topics discussed in this slide are Product Sales, Generating Revenues. This is an instantly available PowerPoint presentation that can be edited conveniently. Download it right away and captivate your audience.
-
 Sales Highlights Dashboard For Business Growth
Introducing our Sales Highlights Dashboard For Business Growth set of slides. The topics discussed in these slides are Emails Sent, Call Made, Deals Created. This is an immediately available PowerPoint presentation that can be conveniently customized. Download it and convince your audience.
-
 Sales Highlights Of Different Manufacturing Companies
Presenting our well-structured Sales Highlights Of Different Manufacturing Companies. The topics discussed in this slide are Sales, Different Manufacturing, Companies. This is an instantly available PowerPoint presentation that can be edited conveniently. Download it right away and captivate your audience.
-
 Sales Highlights With Profitability Indicator Ratios
Introducing our Sales Highlights With Profitability Indicator Ratios set of slides. The topics discussed in these slides are Sales Highlights, Profitability Indicator Ratios. This is an immediately available PowerPoint presentation that can be conveniently customized. Download it and convince your audience.
-
 Sales Highlights With Top Revenue Products
Presenting our well-structured Sales Highlights With Top Revenue Products. The topics discussed in this slide are Sales Highlights, Top Revenue Products. This is an instantly available PowerPoint presentation that can be edited conveniently. Download it right away and captivate your audience.
-
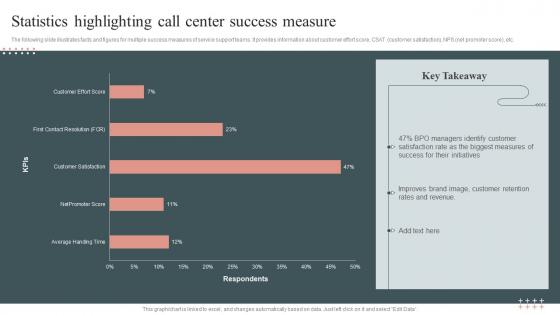 Statistics Highlighting Call Center Success Measure
The following slide illustrates facts and figures for multiple success measures of service support teams. It provides information about customer effort score, CSAT customer satisfaction, NPS net promoter score, etc. Presenting our well structured Statistics Highlighting Call Center Success Measure. The topics discussed in this slide are Customer Satisfaction, Improves Brand Image. This is an instantly available PowerPoint presentation that can be edited conveniently. Download it right away and captivate your audience.
-
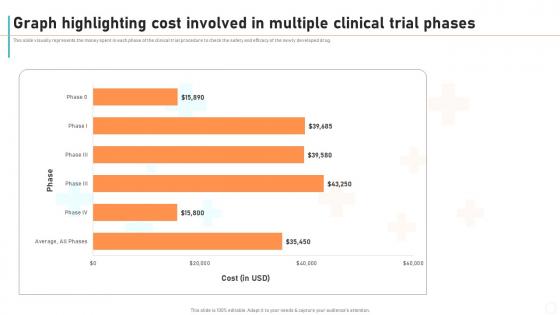 New Drug Development Process Graph Highlighting Cost Involved In Multiple Clinical Trial Phases
This slide visually represents the money spent in each phase of the clinical trial procedure to check the safety and efficacy of the newly developed drug. Deliver an outstanding presentation on the topic using this New Drug Development Process Graph Highlighting Cost Involved In Multiple Clinical Trial Phases. Dispense information and present a thorough explanation of Graph Highlighting, Clinical Trial Phases, Involved using the slides given. This template can be altered and personalized to fit your needs. It is also available for immediate download. So grab it now.
-
 ERP Dashboard Highlighting Results Of Construction Quality Management
Following slide showcases ERP dashboard illustrating the results of construction management. The dashboard covers details of various metrics such as customer complaints, total rework cost, safety meetings, customer satisfaction score, net promotor score etc. Introducing our ERP Dashboard Highlighting Results Of Construction Quality Management set of slides. The topics discussed in these slides are Customer Satisfaction Ratio, Safety Meeting, Net Promoter Score. This is an immediately available PowerPoint presentation that can be conveniently customized. Download it and convince your audience.
-
 Business Monetary Highlights For Planning And Forecasting
The slide shows bar graph showing actual and forecasted revenue, expenses and net profit of a company for various financial years. It is done to effectively conduct financial and investment planning for business growth and sustainability. Presenting our well-structured Business Monetary Highlights For Planning And Forecasting. The topics discussed in this slide are Revenue, Expenses Costs, Net Profit. This is an instantly available PowerPoint presentation that can be edited conveniently. Download it right away and captivate your audience.
-
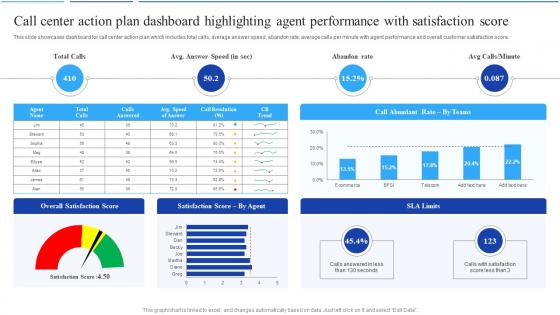 Call Center Action Plan Dashboard Highlighting Agent Performance Call Center Agent Performance
This slide showcases dashboard for call center action plan which includes total calls, average answer speed, abandon rate, average calls per minute with agent performance and overall customer satisfaction score. Present the topic in a bit more detail with this Call Center Action Plan Dashboard Highlighting Agent Performance Call Center Agent Performance. Use it as a tool for discussion and navigation on Total Calls, Avg Answer Speed, Abandon Rate. This template is free to edit as deemed fit for your organization. Therefore download it now.
-
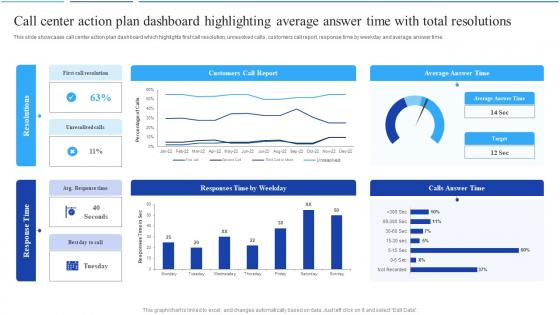 Call Center Agent Performance Call Center Action Plan Dashboard Highlighting Average Answer Time
This slide showcases call center action plan dashboard which highlights first call resolution, unresolved calls, customers call report, response time by weekday and average answer time. Deliver an outstanding presentation on the topic using this Call Center Agent Performance Call Center Action Plan Dashboard Highlighting Average Answer Time. Dispense information and present a thorough explanation of Customers Call Report, Average Answer Time, Calls Answer Time using the slides given. This template can be altered and personalized to fit your needs. It is also available for immediate download. So grab it now.
-
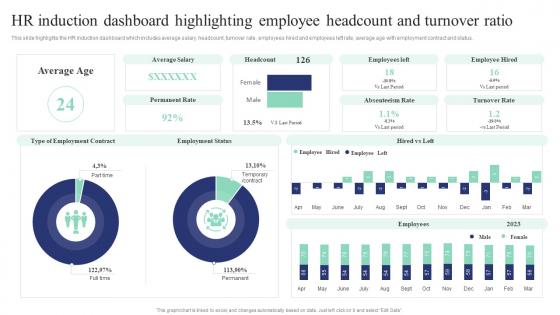 Corporate Induction Program For New Staff Hr Induction Dashboard Highlighting Employee Headcount Turnover
This slide highlights the HR induction dashboard which includes average salary, headcount, turnover rate, employees hired and employees left rate, average age with employment contract and status. Present the topic in a bit more detail with this Corporate Induction Program For New Staff Hr Induction Dashboard Highlighting Employee Headcount Turnover. Use it as a tool for discussion and navigation on Dashboard, Highlighting, Turnover Ratio. This template is free to edit as deemed fit for your organization. Therefore download it now.
-
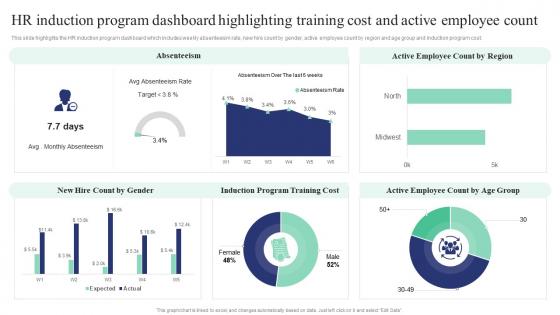 Hr Induction Program Dashboard Highlighting Training Cost And Count Corporate Induction Program For New Staff
This slide highlights the HR induction program dashboard which includes weekly absenteeism rate, new hire count by gender, active employee count by region and age group and induction program cost. Present the topic in a bit more detail with this Hr Induction Program Dashboard Highlighting Training Cost And Count Corporate Induction Program For New Staff. Use it as a tool for discussion and navigation on Dashboard, Highlighting, Employee Count. This template is free to edit as deemed fit for your organization. Therefore download it now.
-
 Project Report For Bank Loan Year Over Year Revenue Generation Highlights Ppt Slides Backgrounds
Following slide illustrates statistics of revenue generation. It depicts that company achieved its highest revenue generation mark in H2 2023. Present the topic in a bit more detail with this Project Report For Bank Loan Year Over Year Revenue Generation Highlights Ppt Slides Backgrounds. Use it as a tool for discussion and navigation on Years Performance, Revenue, Recorded. This template is free to edit as deemed fit for your organization. Therefore download it now.
-
 Project Report For Bank Loan Yearly Project Performance Highlights And Its Degree Of Success
This slide explains about project degree of success based on performance parameters. Performance parameters included here are cost control, schedule meeting, technical performance and customer satisfaction. Deliver an outstanding presentation on the topic using this Project Report For Bank Loan Yearly Project Performance Highlights And Its Degree Of Success. Dispense information and present a thorough explanation of Technical Performance, Schedule Meeting, Customer Satisfaction using the slides given. This template can be altered and personalized to fit your needs. It is also available for immediate download. So grab it now.
-
 Key Statistics Highlighting Average Employee Turnover Rate Industries Developing Staff Retention Strategies
The purpose of this slide is to graphically represent the average staff turnover rate in multiple industries. The industries covered in the slide are construction, manufacturing, transportation, information, financial, hospitality, and health services along with key observations. Present the topic in a bit more detail with this Key Statistics Highlighting Average Employee Turnover Rate Industries Developing Staff Retention Strategies. Use it as a tool for discussion and navigation on Key Statistics Highlighting, Average Employee Turnover Rate, Different Industries. This template is free to edit as deemed fit for your organization. Therefore download it now.
-
 Statistics Highlighting Major Reasons For High Employee Turnover Developing Staff Retention Strategies
The purpose of this slide is to delineate the top reasons which lead to high employee turnover in the organization. The statistical data covers information about reasons such as lack of training programs, lack of awards and recognition programs, poor salary hikes, lack of career advancement opportunities, etc. Present the topic in a bit more detail with this Statistics Highlighting Major Reasons For High Employee Turnover Developing Staff Retention Strategies. Use it as a tool for discussion and navigation on Statistics Highlighting, Employee Turnover. This template is free to edit as deemed fit for your organization. Therefore download it now.
-
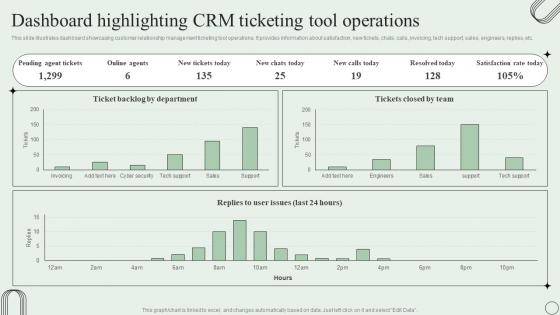 Dashboard Highlighting CRM Ticketing Tool Operations Revamping Ticket Management System
This slide illustrates dashboard showcasing customer relationship management ticketing tool operations. It provides information about satisfaction, new tickets, chats, calls, invoicing, tech support, sales, engineers, replies, etc. Deliver an outstanding presentation on the topic using this Dashboard Highlighting CRM Ticketing Tool Operations Revamping Ticket Management System. Dispense information and present a thorough explanation of Pending Agent Tickets, Online Agents, Satisfaction Rate using the slides given. This template can be altered and personalized to fit your needs. It is also available for immediate download. So grab it now.
-
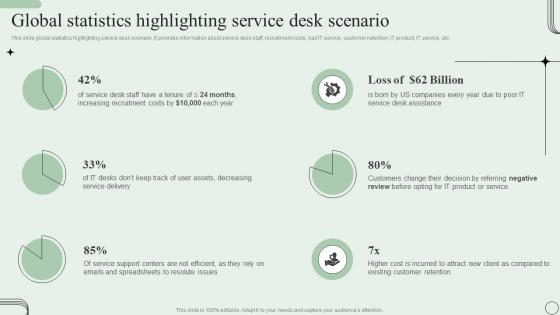 Global Statistics Highlighting Service Desk Scenario Revamping Ticket Management System
This slide global statistics highlighting service desk scenario. It provides information about service desk staff, recruitment costs, bad IT service, customer retention, IT product, IT service, etc. Present the topic in a bit more detail with this Global Statistics Highlighting Service Desk Scenario Revamping Ticket Management System. Use it as a tool for discussion and navigation on Global Statistics Highlighting, Service Desk Scenario. This template is free to edit as deemed fit for your organization. Therefore download it now.
-
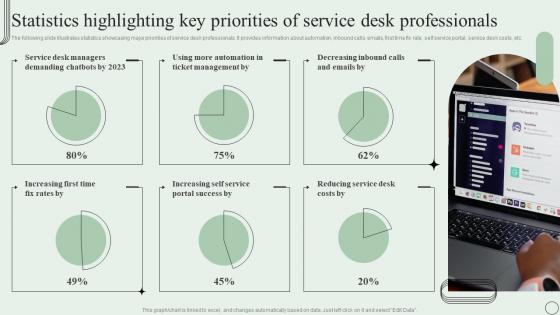 Statistics Highlighting Key Priorities Of Service Desk Revamping Ticket Management System
The following slide illustrates statistics showcasing major priorities of service desk professionals. It provides information about automation, inbound calls, emails, first time fix rate, self service portal, service desk costs, etc. Present the topic in a bit more detail with this Statistics Highlighting Key Priorities Of Service Desk Revamping Ticket Management System. Use it as a tool for discussion and navigation on Service Desk Managers, Ticket Management, Reducing Service Desk . This template is free to edit as deemed fit for your organization. Therefore download it now.
-
 Transaction Monitoring Software Market Highlights
This slide depicts highlights of transaction monitoring software market. It provides information about application market, sector wise market, continent, anti money laundering, manufacturing, scam detection, etc. Introducing our Transaction Monitoring Software Market Highlights set of slides. The topics discussed in these slides are Transaction Monitoring, Software Market Highlights, Market Sector. This is an immediately available PowerPoint presentation that can be conveniently customized. Download it and convince your audience.
-
 KPI Metrics Dashboard Highlighting Organization Introduction To Corporate Financial Planning And Analysis
The following slide outlines key performance indicator KPI dashboard showcasing various financial metrics of the organization. The key metrics are gross revenue, product revenue, service revenue, gross profit, net profit etc. Deliver an outstanding presentation on the topic using this KPI Metrics Dashboard Highlighting Organization Introduction To Corporate Financial Planning And Analysis. Dispense information and present a thorough explanation of Revenues, Profitability, Liquidity using the slides given. This template can be altered and personalized to fit your needs. It is also available for immediate download. So grab it now.
-
 Sustainable Farming Investor Presentation Addressing Impressive Financial Highlights Of Agriculture Firm
This slide caters details about impressive financial highlights of agriculture firm in terms of consolidated turnover, equity, solvency ratio, EBITDA, etc. Present the topic in a bit more detail with this Sustainable Farming Investor Presentation Addressing Impressive Financial Highlights Of Agriculture Firm. Use it as a tool for discussion and navigation on Addressing Impressive, Financial Highlights, Agriculture Firm. This template is free to edit as deemed fit for your organization. Therefore download it now.
-
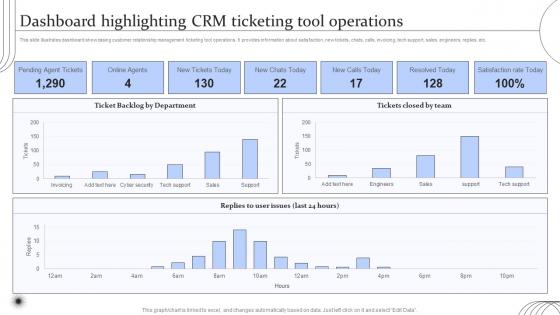 Digital Transformation Of Help Desk Management Dashboard Highlighting CRM Ticketing Tool Operations
This slide illustrates dashboard showcasing customer relationship management ticketing tool operations. It provides information about satisfaction, new tickets, chats, calls, invoicing, tech support, sales, engineers, replies, etc. Present the topic in a bit more detail with this Digital Transformation Of Help Desk Management Dashboard Highlighting CRM Ticketing Tool Operations. Use it as a tool for discussion and navigation on Dashboard, Highlighting CRM, Ticketing Tool Operations. This template is free to edit as deemed fit for your organization. Therefore download it now.
-
 Digital Transformation Of Help Desk Management Global Statistics Highlighting Service Desk Scenario
This slide global statistics highlighting service desk scenario. It provides information about service desk staff, recruitment costs, bad IT service, customer retention, IT product, IT service, etc. Deliver an outstanding presentation on the topic using this Digital Transformation Of Help Desk Management Global Statistics Highlighting Service Desk Scenario. Dispense information and present a thorough explanation of Global Statistics, Highlighting Service, Desk Scenario using the slides given. This template can be altered and personalized to fit your needs. It is also available for immediate download. So grab it now.
-
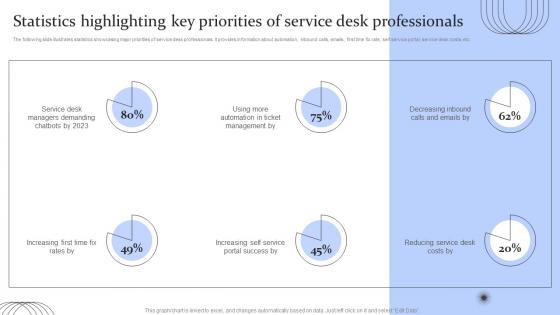 Digital Transformation Of Help Desk Management Statistics Highlighting Key Priorities Of Service Desk
The following slide illustrates statistics showcasing major priorities of service desk professionals. It provides information about automation, inbound calls, emails, first time fix rate, self service portal, service desk costs, etc. Deliver an outstanding presentation on the topic using this Digital Transformation Of Help Desk Management Statistics Highlighting Key Priorities Of Service Desk. Dispense information and present a thorough explanation of Statistics Highlighting, Key Priorities, Service Desk Professionals using the slides given. This template can be altered and personalized to fit your needs. It is also available for immediate download. So grab it now.
-
 Healthcare Administration Overview Trend Statistics Areas Key Statistics Highlighting Most Common Website Issues
The following slide showcases a graphical representation of major website issues faced by the healthcare organizations. No Hypertext Transfer Protocol HTTPS, broken links, outdated website design and slow load web page are the problems which are outlined in the slide. Present the topic in a bit more detail with this Healthcare Administration Overview Trend Statistics Areas Key Statistics Highlighting Most Common Website Issues. Use it as a tool for discussion and navigation on Statistics, Highlighting, Organizations. This template is free to edit as deemed fit for your organization. Therefore download it now.
-
 Overview Of Service Delivery Dashboard Highlighting Customer Satisfaction Score
This slide shows customer service delivery dashboard. It includes KPIs such as total weekly cases, weekly chats, customer satisfaction, server performance, etc. Introducing our Overview Of Service Delivery Dashboard Highlighting Customer Satisfaction Score set of slides. The topics discussed in these slides are Customer Satisfaction, Customer Feedback, Server Performance. This is an immediately available PowerPoint presentation that can be conveniently customized. Download it and convince your audience.
-
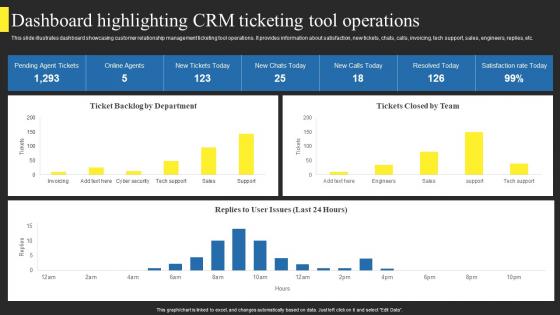 Dashboard Highlighting Crm Ticketing Tool Using Help Desk Management Advanced Support Services
This slide illustrates dashboard showcasing customer relationship management ticketing tool operations. It provides information about satisfaction, new tickets, chats, calls, invoicing, tech support, sales, engineers, replies, etc. Deliver an outstanding presentation on the topic using this Dashboard Highlighting Crm Ticketing Tool Using Help Desk Management Advanced Support Services. Dispense information and present a thorough explanation of Dashboard, Operations, Management using the slides given. This template can be altered and personalized to fit your needs. It is also available for immediate download. So grab it now.
-
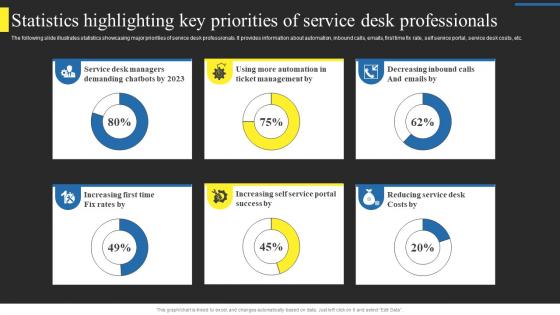 Statistics Highlighting Key Priorities Of Service Using Help Desk Management Advanced Support Services
The following slide illustrates statistics showcasing major priorities of service desk professionals. It provides information about automation, inbound calls, emails, first time fix rate, self service portal, service desk costs, etc. Deliver an outstanding presentation on the topic using this Statistics Highlighting Key Priorities Of Service Using Help Desk Management Advanced Support Services. Dispense information and present a thorough explanation of Statistics, Highlighting, Priorities using the slides given. This template can be altered and personalized to fit your needs. It is also available for immediate download. So grab it now.
-
 Call Center Action Plan Dashboard Highlighting Average Answer Time Call Center Smart Action Plan
This slide showcases call center action plan dashboard which highlights first call resolution, unresolved calls, customers call report, response time by weekday and average answer time. Deliver an outstanding presentation on the topic using this Call Center Action Plan Dashboard Highlighting Average Answer Time Call Center Smart Action Plan. Dispense information and present a thorough explanation of Call Center, Action Plan, Dashboard, Resolutions using the slides given. This template can be altered and personalized to fit your needs. It is also available for immediate download. So grab it now.
-
 Call Center Smart Action Plan Call Center Action Plan Dashboard Highlighting Agent Performance
This slide showcases dashboard for call center action plan which includes total calls, average answer speed, abandon rate, average calls per minute with agent performance and overall customer satisfaction score. Present the topic in a bit more detail with this Call Center Smart Action Plan Call Center Action Plan Dashboard Highlighting Agent Performance. Use it as a tool for discussion and navigation on Call Center Action Plan, Dashboard, Agent Performance, Satisfaction Score. This template is free to edit as deemed fit for your organization. Therefore download it now.
-
 Call Center Improvement Strategies Call Center Action Plan Dashboard Highlighting Average
This slide showcases dashboard for call center action plan which includes total calls, average answer speed, abandon rate, average calls per minute with agent performance and overall customer satisfaction score. Present the topic in a bit more detail with this Call Center Improvement Strategies Call Center Action Plan Dashboard Highlighting Average. Use it as a tool for discussion and navigation on Customers Call Report, Response Time, Resolutions. This template is free to edit as deemed fit for your organization. Therefore download it now.
-
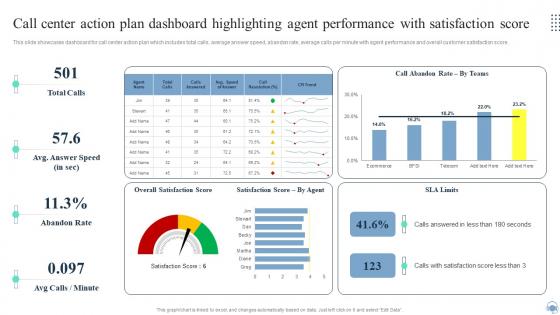 Q910 Call Center Action Plan Dashboard Highlighting Agent Performance Call Center Improvement Strategies
This slide showcases dashboard for call center action plan which includes total calls, average answer speed, abandon rate, average calls per minute with agent performance and overall customer satisfaction score. Present the topic in a bit more detail with this Q910 Call Center Action Plan Dashboard Highlighting Agent Performance Call Center Improvement Strategies. Use it as a tool for discussion and navigation on Total Calls, Avg Answer Speed, Abandon Rate. This template is free to edit as deemed fit for your organization. Therefore download it now.
-
 Key Performance Indicators Highlighting Current Problems Of Organization System Integration Plan
This slide represents the key performance indicators to track the problems faced by organization and draw effective strategies to tackle the problems. It includes key performance indicators of decline in organizational sales and customer engagement rate. Deliver an outstanding presentation on the topic using this Key Performance Indicators Highlighting Current Problems Of Organization System Integration Plan. Dispense information and present a thorough explanation of Organization, Performance, Highlighting using the slides given. This template can be altered and personalized to fit your needs. It is also available for immediate download. So grab it now.
-
 Security Automation Dashboard Highlighting Network And Phishing Alerts Security Orchestration Automation
This slide highlights the dashboard for security automation which includes total automations performed, hours saved, cost savings, records created, automation ratio, incidents by group and incident timeline. Deliver an outstanding presentation on the topic using this Security Automation Dashboard Highlighting Network And Phishing Alerts Security Orchestration Automation. Dispense information and present a thorough explanation of Security Automation, Dashboard Highlighting, Network And Phishing Alerts using the slides given. This template can be altered and personalized to fit your needs. It is also available for immediate download. So grab it now.
-
 Real Estate Project Feasibility Report For Bank Loan Approval Year Over Year Revenue Generation Highlights
Following slide illustrates statistics of revenue generation. It depicts that company achieved its highest revenue generation mark in H2 2023. Deliver an outstanding presentation on the topic using this Real Estate Project Feasibility Report For Bank Loan Approval Year Over Year Revenue Generation Highlights. Dispense information and present a thorough explanation of Revenue, Generation, Highlights using the slides given. This template can be altered and personalized to fit your needs. It is also available for immediate download. So grab it now.
-
 Yearly Project Performance Highlights And Its Degree Real Estate Project Feasibility Report For Bank Loan Approval
This slide explains about project degree of success based on performance parameters. Performance parameters included here are cost control, schedule meeting, technical performance and customer satisfaction. Present the topic in a bit more detail with this Yearly Project Performance Highlights And Its Degree Real Estate Project Feasibility Report For Bank Loan Approval. Use it as a tool for discussion and navigation on Performance, Highlights, Success. This template is free to edit as deemed fit for your organization. Therefore download it now.


